Real Estate … The Set-Up

Looking For The ‘Reversal’ To Fail

The $2-Trillion Op-Ex today, provided upward bias for the overall markets.

Not expected, was biotech SPBIO, to be part of that move.

After today and possibly because of this announcement, we’re out of the sector until price action demands attention.

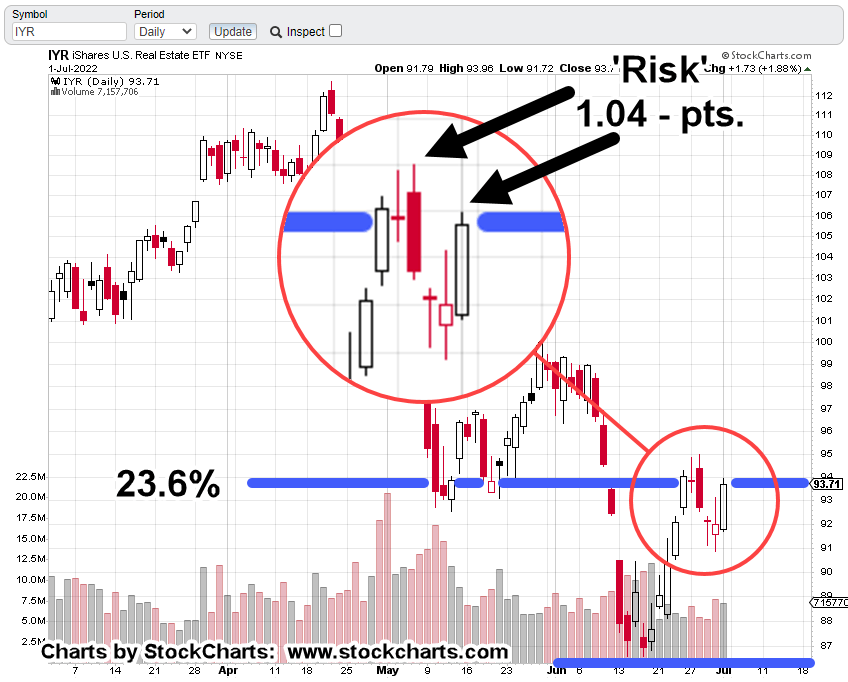
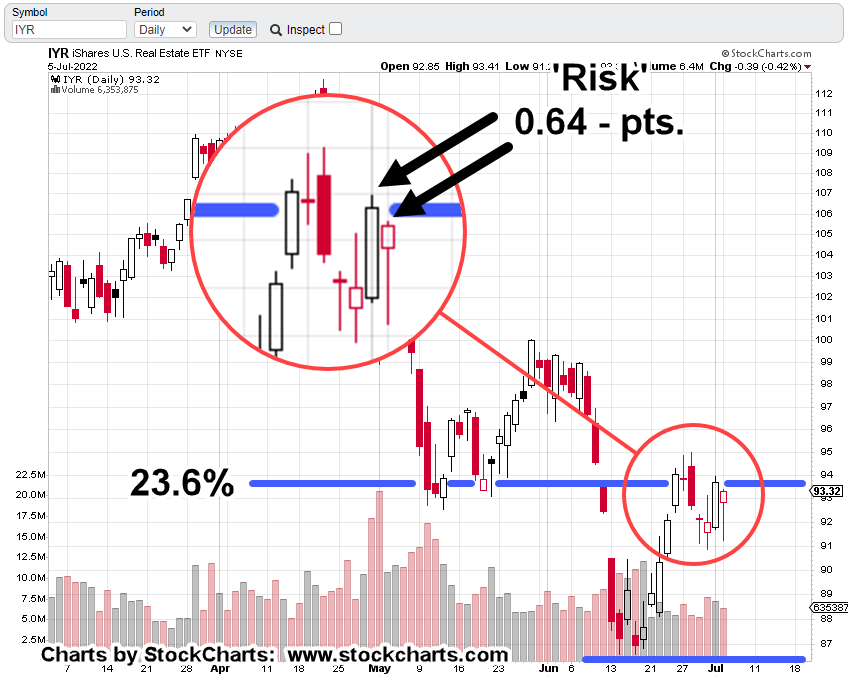
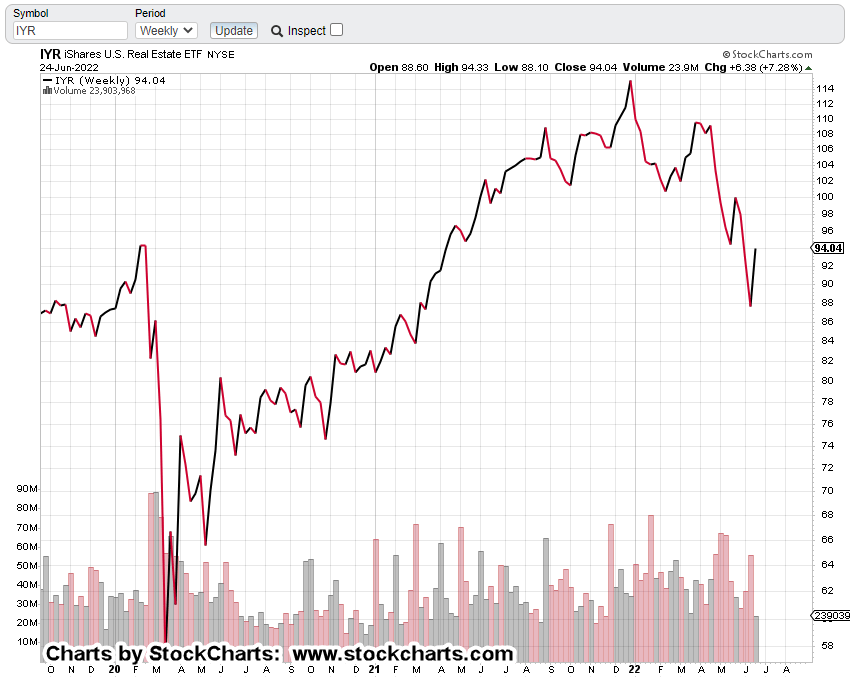
While the Dow, S&P, NASDAQ were up significantly for the day, obviously absent, was real estate (IYR).

Days like today help narrow the focus. Who is not participating in the up move?

While the other indices are up multiple percentage points, IYR, finished the day up only +0.69%.

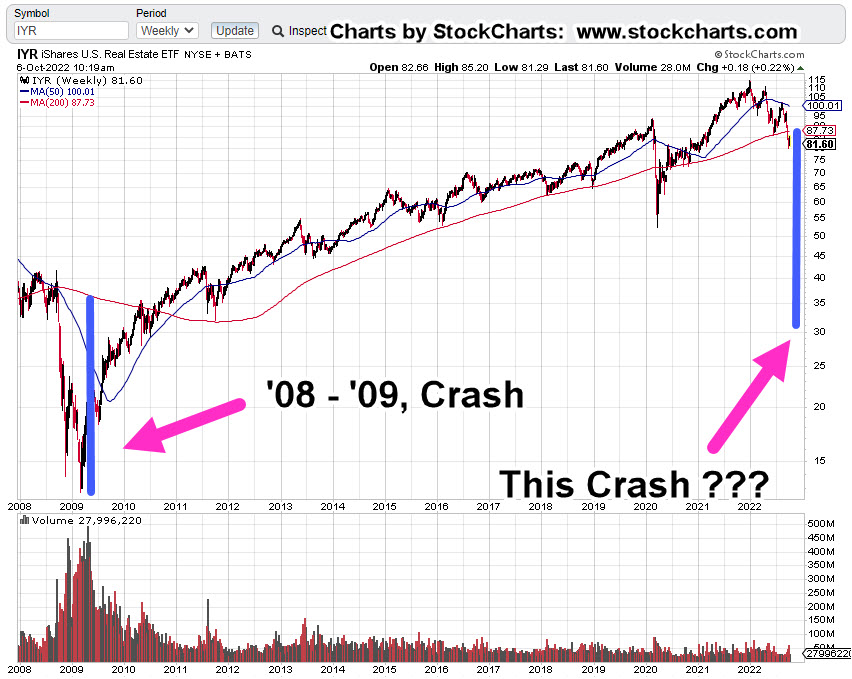
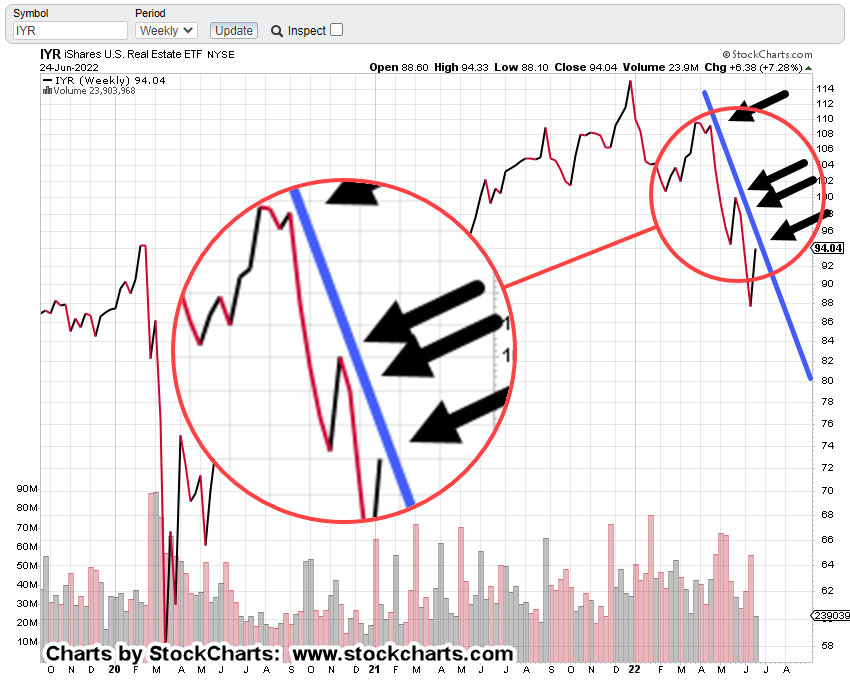
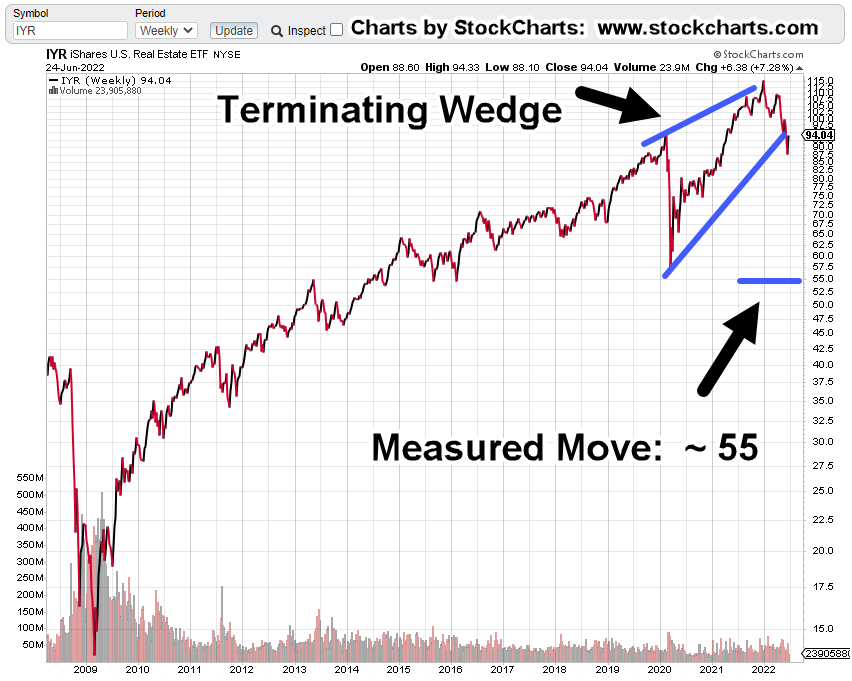
Real Estate (IYR) Weekly

The prior linked YouTube post from Scott Walters is not the premise for going short (not advice, not a recommendation).

It is, however, a reminder that what’s going on, is at a level no one has seen before.

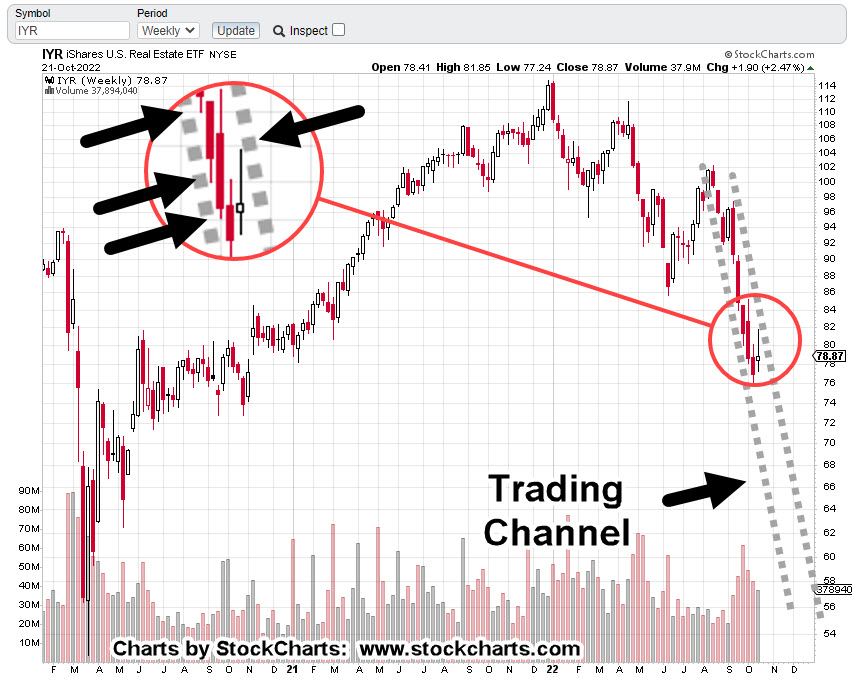
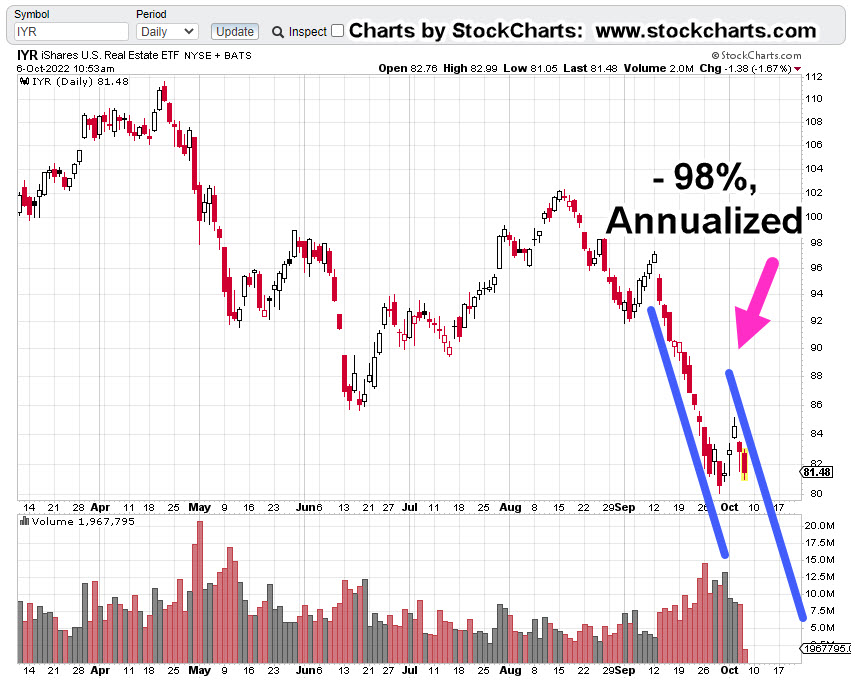
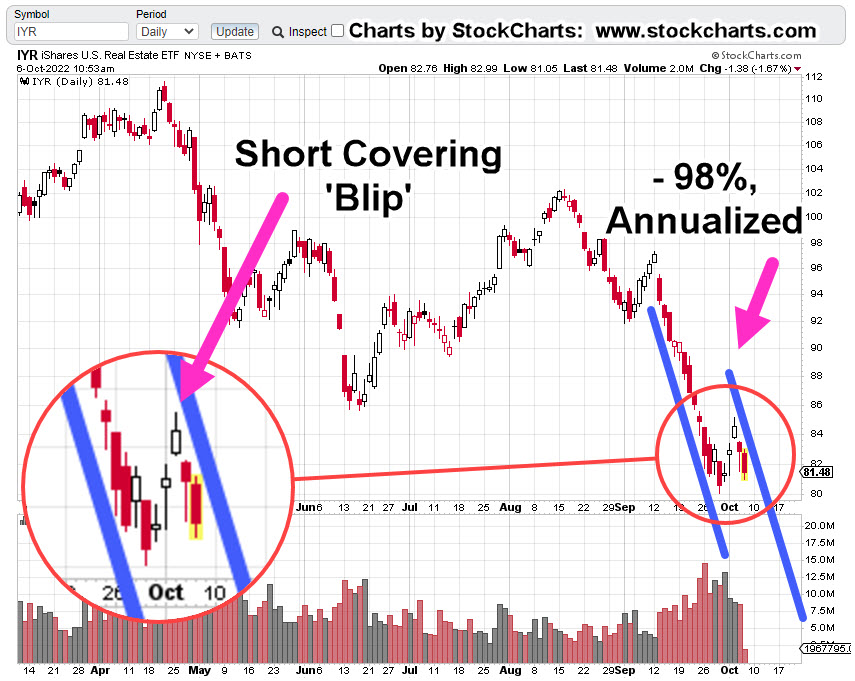
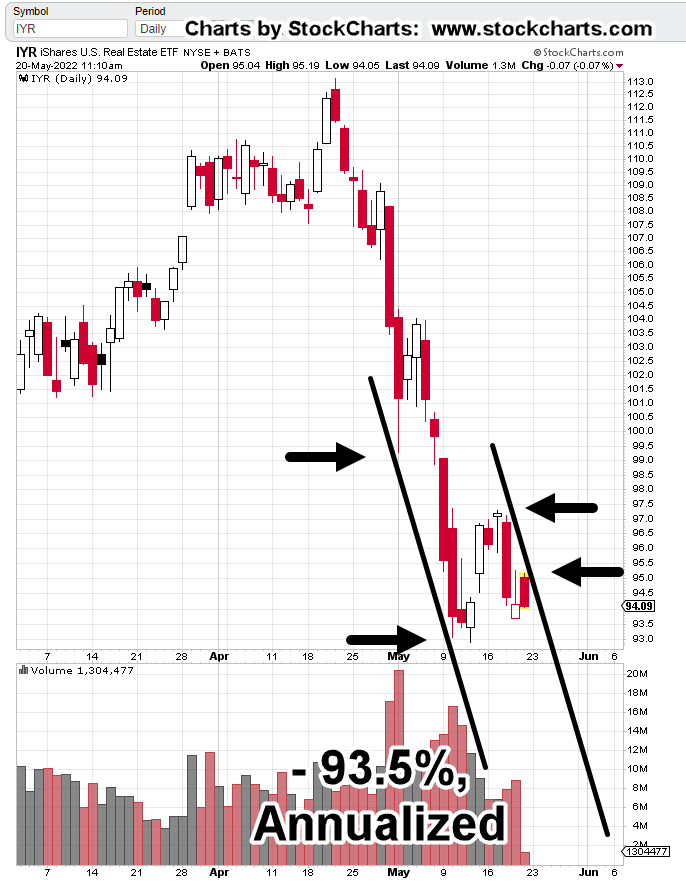
Unless IYR, somehow gets out of the channel, it’s declining at -84%, annualized.

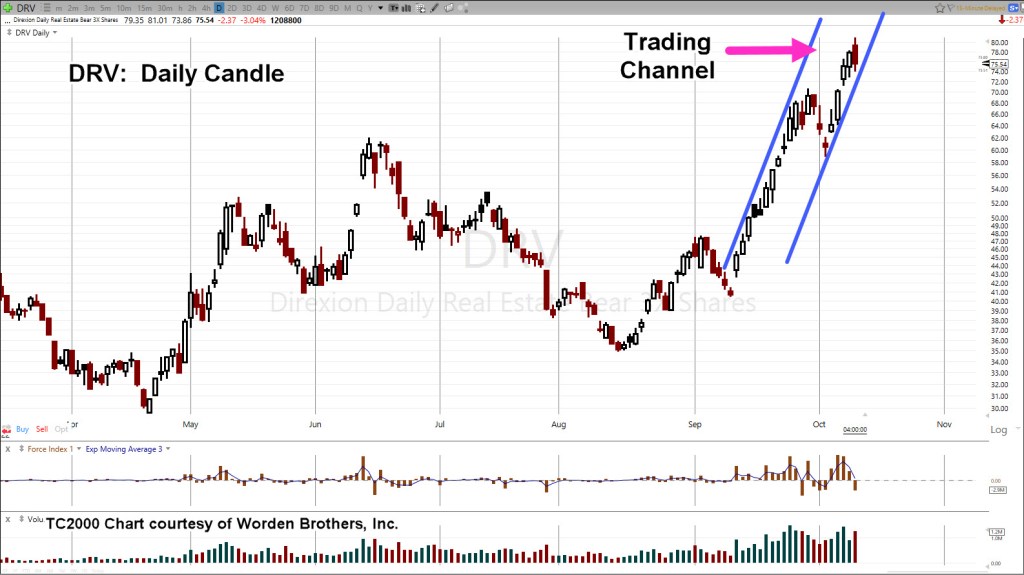
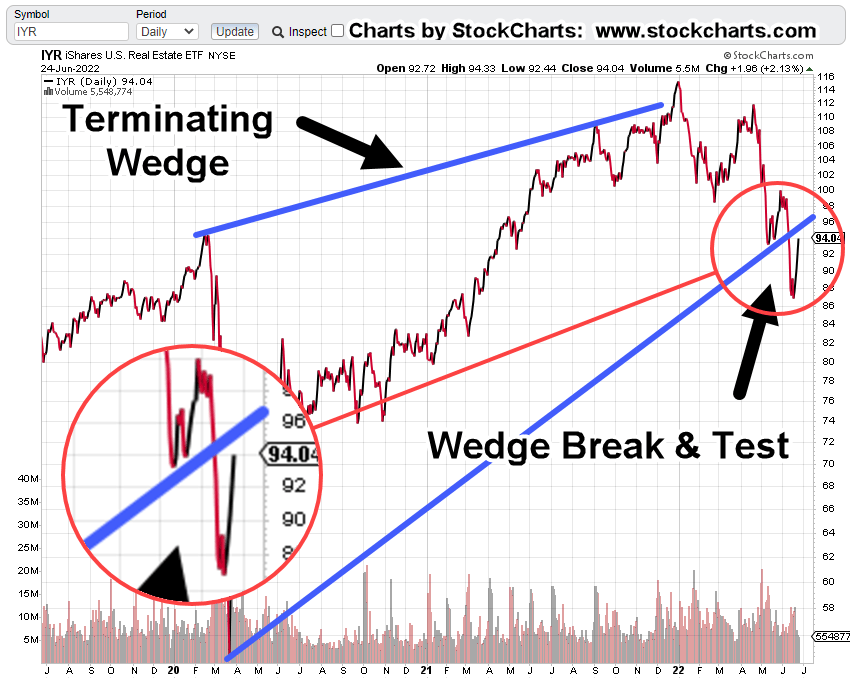
The set-up for this short trade (DRV-22-05) is based on a weak retrace (to 38.2%) on the daily with the anticipation, today’s reversal bar will ‘fail’ at the next session.

Real Estate, (IYR) Daily

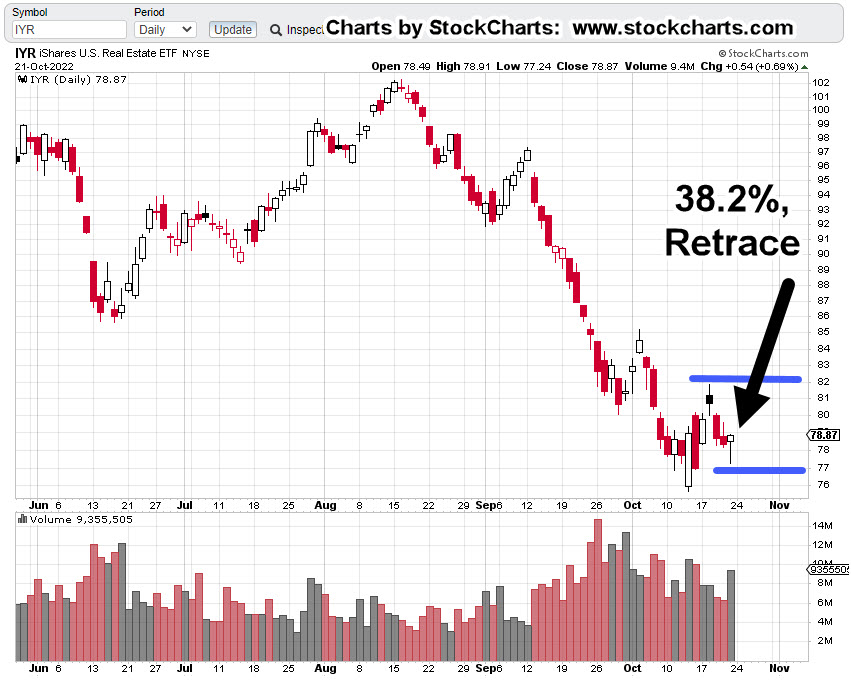
The expectation for the next session is straightforward; lower open or gap-lower open and posting a new daily low.

The chart of IYR below, shows what we’re looking for (not advice, not a recommendation).

Obviously, a new daily high at the next session negates the set-up and warrants a trade exit.

A new daily low and we’ve got a ‘failure’ of the reversal bar; DRV-22-05, is liklely to be increased (not advice, not a recommendation).

Stay Tuned

Charts by StockCharts

Note:  Posts on this site are for education purposes only.  They provide one firm’s insight on the markets.  Not investment advice.  See additional disclaimer here.

The Danger Point®, trade mark: No. 6,505,279

Position Changes

Courtesy Update: 2:38 p.m., EST

Charts to be posted in a subsequent update.

Biotech is not behaving as expected; LABD-22-08, has been exited completely with an overall profit of about +8.5%.

We all know that real estate is in the largest bubble in U.S. history … and that’s not hyperbole.

With today’s upward bias in the market and IYR, not responding in kind (remaining weak), a position has been opened in leveraged inverse, DRV @ 74.53 (not advice, not a recommendation).

Price action in IYR, could still pressure somewhat higher into the close; thus, DRV would decline but the anticipation is if so, not by much.

Trade is labeled as DRV-22-05; stop is TBD, to be provided after the close.

Stay Tuned

Charts by StockCharts

Note:  Posts on this site are for education purposes only.  They provide one firm’s insight on the markets.  Not investment advice.  See additional disclaimer here.

The Danger Point®, trade mark: No. 6,505,279

Real Estate Crash … Exit Targets

The DRV, Exit(s)

Well-calculated stops, (mostly) take care of trade implosion. So, where’s the exit?

The answer is there’s no set answer.

We’ll explain that by using the current plan for DRV-22-04 (not advice, not a recommendation).

Questions

First question to determine an exit in this case, is to ask:

“What are the media pundits, and/or ‘experts’ talking about right now?”

Well, that’s easy.

Just like the ‘silver squeeze’ idea that won’t go away (even as SLV continues downward), the ‘Fed pivot‘ is another delusion that keeps holding on.

As parts of the market (like IYR) continue their free-fall, all eyes are on the next Fed meeting; waiting for them to pivot and ‘save us’.

Right around November 1st, or 2nd, seems like it can’t help but be some kind of emotional cathartic set-up.

Unless stopped out ahead of time, the plan, is to plan an exit within that window.

Let’s go to the IYR, 3X Leveraged Inverse fund DRV.

IYR, 3X Inverse, DRV, Daily

At the end of today’s session DRV has posted a downside reversal candle.

The next session will be important.

We either have follow-through to the downside, thus validating the reversal (and exit of the position) or we have some variation of an inside day or new daily high.

If the trading channel remains valid, the compressed chart below shows a potential exit range: DRV 140 – 200.

During the next session(s), if DRV, posts a new daily high (unless stopped), the DRV-22-04, stop will be moved to this session’s low @ 73.86

Positions & Current Stance (courtesy only, not advice).

The following is the positioning of my firm’s main (largest) account.

DRV-22-04:

Entry @ 66.463, Stop @ 63.98

ZSL-22-01:

Entry @ 28.08, Stop @ 28.53:

Discretionary exit (today) @ 31.5513***

Trade Closed

LABD-22-08***:

Entry @ 25.1278 (yesterday) and 24.735 (today), Stop @ 22.59

***, Indicates change

Note: Positions may be increased, decreased, entered, or exited at any time.

Stay Tuned

Charts by StockCharts

Note:  Posts on this site are for education purposes only.  They provide one firm’s insight on the markets.  Not investment advice.  See additional disclaimer here.

The Danger Point®, trade mark: No. 6,505,279

Real Estate ‘Crash Channel’

Not Saying That Lightly

For real estate, the crash may be happening as we speak.

Even if it’s not, the sector (IYR) has developed an aggressive trading channel as we’ll see below.

First, we’ll look at ‘big picture’ potential on the weekly chart.

Real Estate IYR Weekly

The distance traveled from the 200 Week Moving Average during the crash of ’08 – ’09, is shown.

That same distance is projected on the current situation.

Everybody’s ‘looking for the bottom’ … well, there it is. 🙂

Of course, that’s only a potential bottom.

Where it gets really scary is the channel that’s been confirmed on the daily chart, shown below.

The zoom version shows the weak blip higher … potential short covering that looks complete.

One caveat is that as (or if) IYR price action approaches the lows, technically speaking, it’s a support level.

That’s the time to watch the right-side channel line to see if it’s penetrated, thus negating the aggressive downtrend.

Positioning

Everyone has their own style and this is NOT financial advice.

However, a short was initiated early this session in Leveraged Inverse Fund DRV, labeled DRV-22-04.

Opened @ 66.4633, with a stop at session low, 63.98

Stay Tuned

Charts by StockCharts

Note:  Posts on this site are for education purposes only.  They provide one firm’s insight on the markets.  Not investment advice.  See additional disclaimer here.

The Danger Point®, trade mark: No. 6,505,279

Silver’s ‘Mysterious’ Decline

Read The Chart

Media analysts and YouTubers alike, are scratching their collective coneheads.

They’re asking; why is silver down a whopping – 39%, from its print high of February 1st, this year?

If we factor in the high of SLV 48.35 (from April of 2011), silver’s been pummeled – 65%.

With the ‘rampant’ inflation and never-ending money printing, silver (along with gold) should, there’s that word ‘should’, be skyrocketing higher.

It’s an apparent mystery; steeped with smoke-filled back rooms and intrigue.

The ‘Inflation’ Narrative

Let’s help unravel silver’s decline by taking a look at some of the facts.

First up, is ‘inflation’.

The inflation narrative is false. There; glad we got that out of the way. 🙂

How do we know?

We know it’s false because the price action itself, tells us it’s false.

It’s obvious at this point, what we have is supply destruction and not inflation.

The Economic ‘Connection’

Next up, is the economy.

Silver along with copper are industrial metals. They follow the economy … more so with copper. Copper futures are down – 32.5%, from their March 7th, highs.

Coper’s industrial uses are linked here. Nearly half of copper production is for building and construction.

Since the largest real estate bubble in world history has just popped, copper demand is essentially going to collapse.

If at this early stage of Great Depression 2.0, the average person can’t pay the phone bill, where are they going to get any money to drive precious metals demand higher?

Moving on to ‘truth’, we have price action.

Silver SLV, Weekly Close

The chart below has SLV, penetrating one support level (upper blue line) and just now, at the next support.

Since gold (GLD) is in position for an upward test of its wedge breakdown (chart not shown), it’s reasonable to expect another bounce off support for silver.

Using the ‘rule of alternation’, we already had a brief move off the first support level before reversing.

The next contact at lower support, will likely bounce for longer or not at all.

If silver can’t go higher … look out below.

Silver SLV, To Single Digits?

The economic depression is just getting started and industrial metals demand is already collapsing.

Although a data point of one, the following is significant.

Supporting the ‘depression’ assessment is this link; specifically, time stamp 3:20, with a recent graph of housing listings in California … going vertical.

SLV, is in position to test higher; thus, confirming the wedge pattern (grey lines) shown below.

Added to that pattern is a measured move target should SLV, break down to lower levels after an upward test.

There it is: ‘Mystery’ solved.

Silver is heading lower because price action said it would.

Now, the fundamentals are kicking in to add a potential mass acceleration to the decline.

Stay Tuned

Charts by StockCharts

Note:  Posts on this site are for education purposes only.  They provide one firm’s insight on the markets.  Not investment advice.  See additional disclaimer here.

The Danger Point®, trade mark: No. 6,505,279

“The Big One” for Real Estate

Subtle Clues, Time’s Up

‘Sometimes it seems as if the market hangs in the balance by the weight of a feather.’: Wyckoff, circa 1910.

Is this the big reversal to the downside?

Before we get to that answer, let’s review two recent market pivots (including today).

A Day To Remember

Back on May 4th, the post with the same title, linked here, was to be used for reference on a go-forward basis.

The post has a linked article, whose comment section could be surmised as the bourgeois rebuke of a 78-year-old fund manager.

That manager was quoted as saying, “It’s the biggest bear market of my life”; to which the younger crowd responded with derision, effectively saying the old man’s a dolt, an idiot, a doofus and needs to retire.

Now that time has passed, let’s remind ourselves when the quote was published with the daily (IYR) chart below.

Not only did IYR, not close higher after that, it never printed higher either. It was the top of the pivot reversal, to the day.

The 23.6%, Retrace

Then we have this report just days ago, showing IYR’s price action coming back to a (very weak) Fibonacci 23.6%, retrace.

The daily chart repeated below, showed the ‘risk’ on a short position as approximately 1.04-pts (not advice, not a recommendation).

Risk Narrows Even More

As a result of today’s new daily low and lower close, one can (theoretically) reduce the risk of a short position even further (not advice, not a recommendation).

The risk is now defined as the distance between today’s close (IYR: 93.32) and Friday’s high of IYR: 93.96

A subsequent push above Friday’s high negates the short and would likely indicate a potential move to a 38.2%, retrace.

Subtleties of The Market

A lower daily print and marginally lower close (IYR down just – 0.39-pts.) does not look like anything of consequence.

We’ll see about that, at the next session.

Stealth Crash?

Lastly, we have this and especially this.

Could we be right in the middle of a historic crash and not even know it?

Of course, it’s never for sure, until it’s over.

However, if shorting opportunities are being spotted, entered, and managed correctly, probabilities are that one will already be positioned short when ‘the big one’ hits.

Stay Tuned

Charts by StockCharts

Note:  Posts on this site are for education purposes only.  They provide one firm’s insight on the markets.  Not investment advice.  See additional disclaimer here.

The Danger Point®, trade mark: No. 6,505,279

Active: Positioned short via SRS (SRS-22-01), with stop at SRS: 16.38

Recession First … Depression Next

The Last Place To Be … Real Estate

The most illiquid of all ‘assets’: Real Estate

Two quarters of negative GDP (even with cooked books) equals recession.

Next up, full-blown depression.

Some would argue (like J.B. and Dan) that we’re already in a depression … we skipped the recession part altogether.

Do not pass Go. Do not collect $200.

Anyone who thinks the Fed’s going to ‘pivot’ because the numbers are weak, does not understand (or won’t admit to) the real purpose of the entity; but I digress.

The Strategy

Way back in December of 2020, this post was released which discussed ‘Genesis 41’, specifically.

It was an intuitive assessment; we’re in a phase where corn and grain (i.e., the food supply) are potentially more important than ‘stacking‘ silver or gold.

Over the ensuing year and a half, how correct, that has proven to be.

Then, nine-months ago, was this post, presenting the ‘elephant’; a massive population decline whose repercussions would last the lifetimes of anyone reading.

Now, we have this. A report that confirms the elephant.

It’s all starting to hit the mainstream, although the language is still being couched to not cause undue panic. Good luck with that.

So, what’s next?

The Danger Point: Real Estate

While mainstream press and money managers alike struggle to figure out the obvious, we have price action itself telling us the next likely direction of the market.

During an economic downturn there are many places not to be such as semiconductors, airlines and other low margin businesses, restaurants and so on.

However, the most illiquid of all, is real estate. It does not matter how bad one wants to sell, if there is no buyer, there is no sale.

Real Estate IYR, Weekly Chart

Last week, real estate IYR, closed right at the Fibonacci 23.6% retrace as shown.

Getting closer in on the daily, it’s marked up to show the risk from a shorting perspective (not advice, not a recommendation).

Real Estate IYR, Daily Chart

In this case, the risk on a short position is defined as the distance from last Friday’s high (IYR: 93.96) to that same week’s high of IYR: 95.0

Let’s add, Friday’s action saw IYR, retrace a Fibonacci 76.4% (the most available) of the entire move for the week.

The Summary

Amazon (AMZN), ProLogis (PLD), and Real Estate IYR, are joined at the hip.

Now the economy’s imploding, massive warehouse space is not needed.

Ditto that for employees as well.

ProLogis is already down – 31.2%, from its all-time highs set just this past April.

We’ve already shown PLD, has a nasty habit of going straight down during a market route.

Last time, PLD, crashed over – 84%, in just two months.

It’s likely to be worse, this time around.

Stay Tuned

Charts by StockCharts

Note:  Posts on this site are for education purposes only.  They provide one firm’s insight on the markets.  Not investment advice.  See additional disclaimer here.

The Danger Point®, trade mark: No. 6,505,279

Dumpster Fire … Real Estate

Price Reductions, Accelerating

From a technical perspective, it’s a disaster.

The last post showed price action had nowhere to go but down.

In that post, a trading channel was identified on the weekly chart.

Now, this week, with the action from the past three sessions and possibly a fourth (today), the channel is being confirmed.

Then, we have this:

Price Reductions Accelerating … At Record Pace

As if on cue, to support the assertion from Tuesday’s gold update; specifically:

“We should expect market events to reach never before seen extremes.”

We’re getting that same ‘never before extreme’, in real estate; presenting itself as accelerating price reductions.

At time stamp 5:20 at this link, we can see a graphical presentation of that collapse.

To borrow a quote from Dan at i-Allegedly: ‘Anyone who thinks price reductions are going to taper off, are kidding themselves’.

We’re just getting started.

Real Estate IYR, Daily Close

It’s about fifteen minutes before the open and IYR, is trading down nearly – 2%, in the pre-market.

That action confirms the declining channel shown.

As a result of this week’s apparent pivot (identified in the last post), a new channel appears to be emerging.

This one’s more aggressive.

If the new channel ‘sticks’, real estate trouble’s happening faster than most would expect.

Pulling out a little farther on the chart shows the downside potential.

Declining at nearly – 95%, annualized hardly seems possible.

Nearly everyone has been lulled to sleep with the orderly decline of the markets thus far.

In non-related but nevertheless connected event, the situation world-wide is moving faster, not slower.

It does not matter these events are completely fabricated (as was The Speck).

The effects of the fabrication are real.

Wyckoff Analysis Leads The Way

This week’s reversal off of last week’s trend lines confirms their existence.

Price action itself is leading the way; this is the crux of Wyckoff analysis.

The market itself defines what’s important.

Stay Tuned

Charts by StockCharts

Note:  Posts on this site are for education purposes only.  They provide one firm’s insight on the markets.  Not investment advice.  See additional disclaimer here.

The Danger Point®, trade mark: No. 6,505,279

Predatory Lending = Collapse

The Top, Is In

Just like the last bubble but worse.

That’s the assessment from agents in the field on the imminent real estate implosion.

Interest rates have risen dramatically, applications have evaporated, properties not moving as before, prices are dropping, lenders deploying the last resort; Adjustable-Rate Mortgages (ARM).

When the ARMs, show up in force, it’s over.

Technical & Fundamental

Over the past several days, the real estate situation has been assessed from both a technical (chart) perspective as well as the fundamentals.

The bottom line (below), is so long, it may have to be covered in several posts.

  • On a weekly and daily close basis, IYR has contacted underside resistance.
  • On a weekly and daily close basis, IYR has contacted the right side of a downward trading channel.
  • Multiple gap-fills at IYR, 91 and 94. Volume declines over – 22.5%, on the second gap-fill.
  • Multiple rising wedge breaks on multiple time-frames signal a potential drop of – 41.5%, from current levels.
  • Trading volume contracting (as price is rising) on multiple time frames, indicates potential lack of trader commitment to higher prices.
  • Financial press gets in the game (with several reports), saying ‘now is the time to buy’.
  • As highlighted above, once the Adjustable Rates dominate, the top is in.
  • This top may be far worse than ’07 – ’08, as debt levels are much higher, consumer is tapped-out and there is a massive ‘elephant’.
  • That elephant is now going mainstream with the resultant effect of unprecedented population decline/disablement.

So, let’s get started.

Real Estate IYR, Weekly Close

Un-marked chart.

Test of underside resistance

Zoom of underside contact.

Right side trendline.

Zoom of contact points.

Trading Channel

Wedge Break: Daily Chart

Zoom of break and test

Wedge Break: Weekly Chart

Note:

A measured move to 55-area, gets IYR, back to 2020 lows. That’s a reasonable expectation for an initial leg down.

If we use Prechter’s assessment concerning bubbles (manias), price action eventually retraces every bit (sometimes more) of the entire bubble move.

That puts the ultimate destination of IYR, somewhere in the vicinity of 14.0, or lower, representing a decline of – 88%.

Closing Argument

Remember this gold breakout?

It was going to be $3,000/oz., in months, not years.

Gold-O-Mania was coming. You could even sign up and pay money to read the group-think of the imminent launch.

Well, obviously at this point, $3,000/oz., is nowhere in sight.

Gold (GLD) is even lower now than it was then. On top of that, the ‘changing of hands’ assessment has not been negated; prices continue to grind lower.

Having the financial press cheerlead at the exact wrong time, is an (almost) necessary component to identify a lasting reversal.

As we can see here and here, the financial media’s position is, we’re heading higher. There is ‘real buying’ (whatever that is) for the first time in weeks.

However, from the chart evidence presented above (and we didn’t even get to ‘gap-fills’, ‘multiple wedges’, ‘contracting volume’ … maybe later), it’s hard to present that price action will somehow move significantly higher.

Price action behavior above, appears to point to an immediate or very near-term downside reversal.

Summary

Lastly, we have this from Activist Post: Real estate housing crash in progress.

Be careful. If you read the article, can you see the ruse?

It’s been discussed before on this site. That is, the real purpose of the Fed.

All is going according to plan.

Stay Tuned

Charts by StockCharts

Note:  Posts on this site are for education purposes only.  They provide one firm’s insight on the markets.  Not investment advice.  See additional disclaimer here.

The Danger Point®, trade mark: No. 6,505,279

Real Estate … ‘Train Wreck, Ahead’

Channel Confirmation

Does it really matter if IYR’s channel is at -99%, or -93.5%?

The sector’s going down fast; that’s the important part.

Unless there’s some kind of decisive, high-volume break to the upside, we’ve got IYR in a confirmed trading channel, declining at approximately – 93.5%, on an annualized basis.

The morning gap open in IYR, was higher as expected; sated in the pre-market report.

However, instead of reaching the 100%, ‘a-b-c’ target, where wave ‘a’ would be equal to wave ‘c’ (a common occurrence), the gap higher only reached a 61.8% target: indicating significant weakness.

The daily chart, has the situation as of 11:30 a.m., EST

Real Estate IYR, Daily

One thing that’s not happened yet … there is no new daily low for IYR.

It has not posted below yesterday’s low of 93.70.

That’s about the only factor that remains as potential upside for the sector.

If yesterday’s low is penetrated, then it weights probability significantly to the downside (not advice, not a recommendation).

Stay Tuned

Charts by StockCharts

Note:  Posts on this site are for education purposes only.  They provide one firm’s insight on the markets.  Not investment advice.  See additional disclaimer here.

The Danger Point®, trade mark: No. 6,505,279