Note: Posts on this site are for education purposes only. They provide one firm’s insight on the markets. Not investment advice. See additional disclaimer here.
It’s just a few hours before the futures open and we’re about to see if we have a (continuing) downside reversal.
Remember, last week was Fibonacci Week 34, as discussed in this update.
That week’s range was just over 3.1%.
The time before that, similar narrowness Week 21, was around 2.5%.
Perhaps, even more interesting, going back to Week 1, we have yet another narrow range of 2.9%.
We’re about to find out if that sequence of narrow ranges means something or not.
Holiday Turns
This coming week is a holiday week.
It seems appropriate at this time, to re-publish analysis done years ago and currently behind the password firewall of my firm’s main website.
Author’s Note: At the time, I was publishing a daily market summary.
Here it is, from June 27th, 2015 … so long ago.
Market Summary: 6/27/15
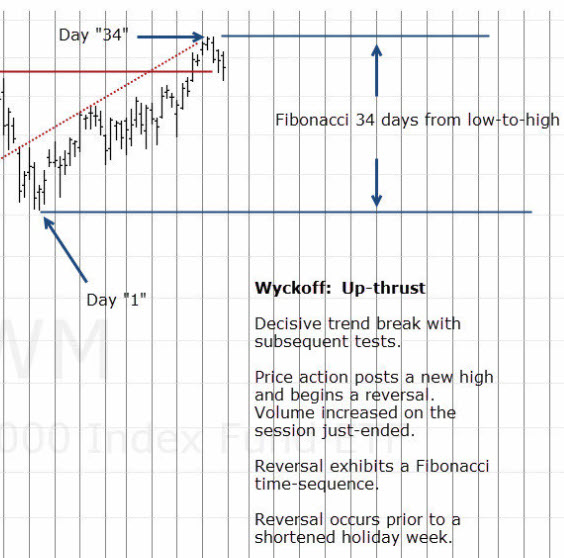
The Russell 2000 index has reversed. In addition, the S&P 500 volatility has declined to pre-2008 crisis levels. We now have yet another potential reversal during or just prior to (or just after) a holiday week.
This is how the Russell looked when the reversal was identified.
Author’s Note: The hyperlink above is password protected. The chart below, has been brought outside the firewall.
The following data shows the original analysis (first chart) and then, months later, how that analysis was proven out to have identified the (near) exact moment of reversal.
Continuing on with the original (6/27/15) post.
For clarity, the reversal area of the chart has been expanded below:
Other notable reversals that occurred prior to, during, or just after a holiday week:
Week of 5/23/08: S&P 500 makes a high on the Monday prior to Memorial Day: S&P then crashes over 53%.
Week of 7/3/14: Russell 2000 makes a high on the Tuesday of the July 4th week: Subsequent decline is 9%
Week of 9/5/14: Russell 2000 makes a high on the Wednesday after the Labor Day weekend: Subsequent decline is 12%
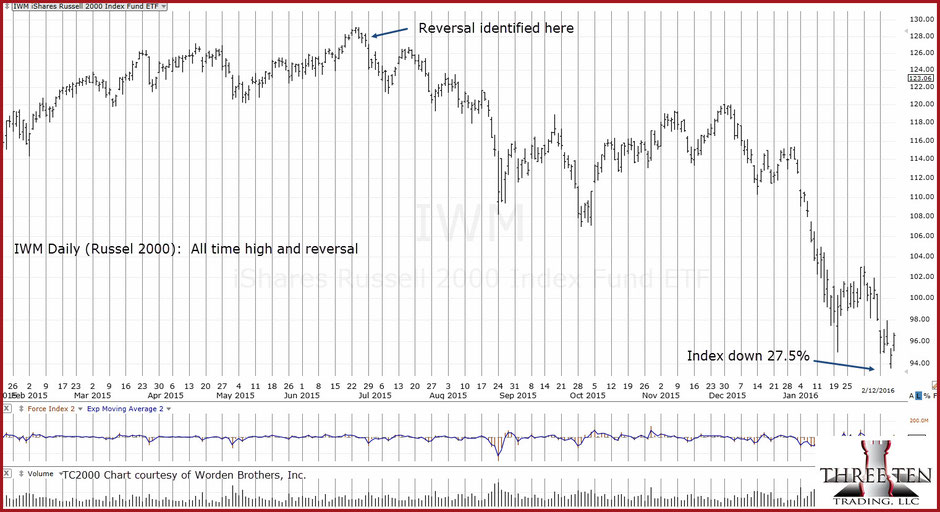
Week of 6/26/15: Russell 2000 makes a high on the Wednesday prior to the July 4th week: Subsequent decline: 27%
Going way back: The all time market high of 1929, occurred on September 3rd, of that year. That date was the Tuesday following the Labor Day Weekend. Subsequent decline was 84 – 89%
Author’s Note: Months later, we now have the result as shown below:
Note: Posts on this site are for education purposes only. They provide one firm’s insight on the markets. Not investment advice. See additional disclaimer here.
There’re a lot of moving parts to biotech and it’s like a game of chicken.
Is there going to be another ‘planned’ event pulled out of the bag that requires ‘protection’ or will this side (and this one) win-out before that happens?
Price action’s always the final arbiter and right now, it’s positing lower.
Gold:
Gold (GLD) ‘blipped’ higher on Friday and the usual suspects are out touting the hyperinflation narrative.
Owning (some) precious metals seems to be a good thing.
However, the public constantly knee-jerks into this sector and is absolutely rabid in their behavior (i.e., silver stockpiles are running out!!!).
It suggests at least, there’s something else afoot.
Prechter published in the early 2000’s, Central Banks, are followers, not leaders. The fact they are buying gold at this point, may be a contrary indicator.
Talk about going against the herd. 🙂
Over and again, it’s the boring (does not generate ‘clicks’) food supply first, then gold and silver (not advice, not a recommendation).
Real Estate:
What can be said?
It’s the largest manufactured bubble in world history and it has already popped.
Thinking it’s all going to sort itself out in a year or two is delusional. We’ve probably got decades of bear market.
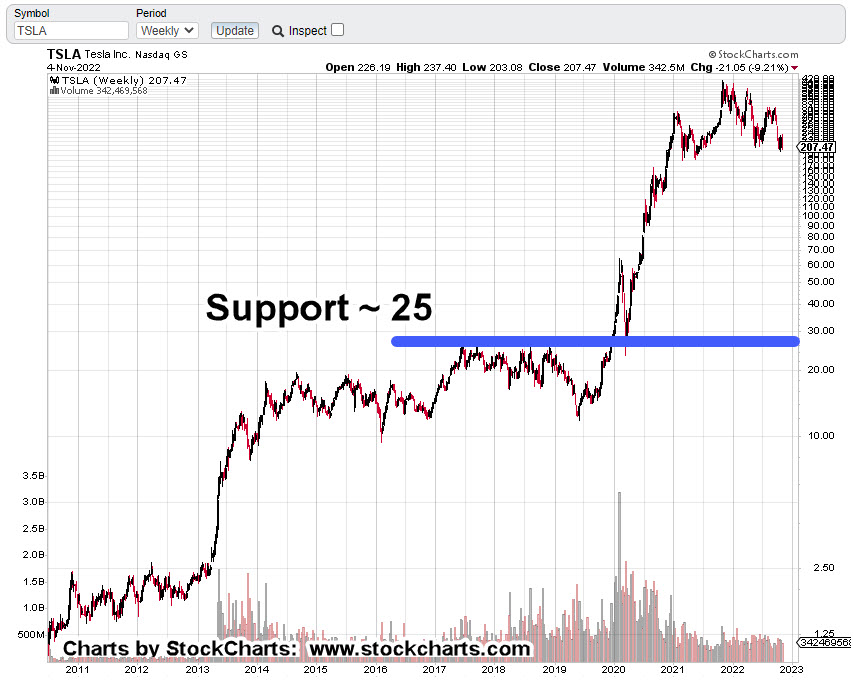
Tesla:
Anyone with an anode of research capability, knows the whole EV premise, is based on a falsehood.
However, that fact is probably not what’s going to bring Tesla (and the rest of the market) down.
Let’s stop for a moment and consider the above link which has been available for nearly four-years.
How many views? Just 9,824 (as of this post)
That equates to only 0.003% of the U.S. population.
As the global supply chains implode, getting parts and having stable infrastructure (i.e., electricity) will probably be the defining factor.
Now, on to the charts.
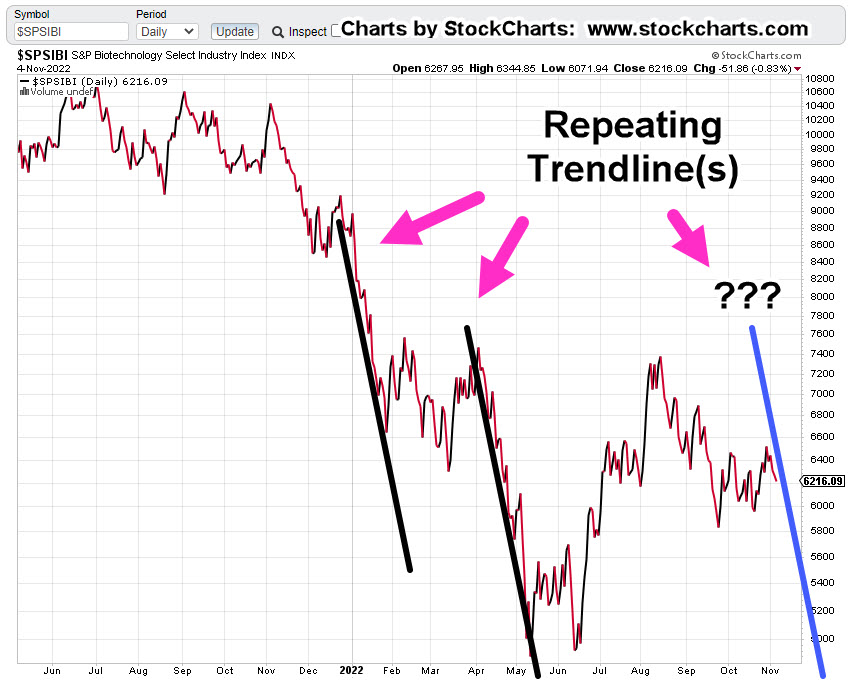
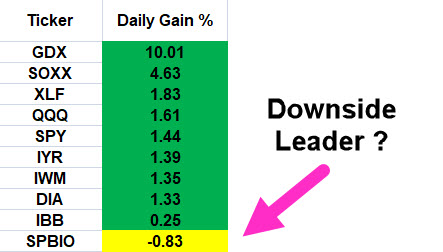
Biotech SPBIO, Daily Close
The following sessions will let us know if we’re at the right edge of the downtrend line.
We’ve already had an up-thrust reversal and a test of that reversal. last Friday was lower … probabilities point down.
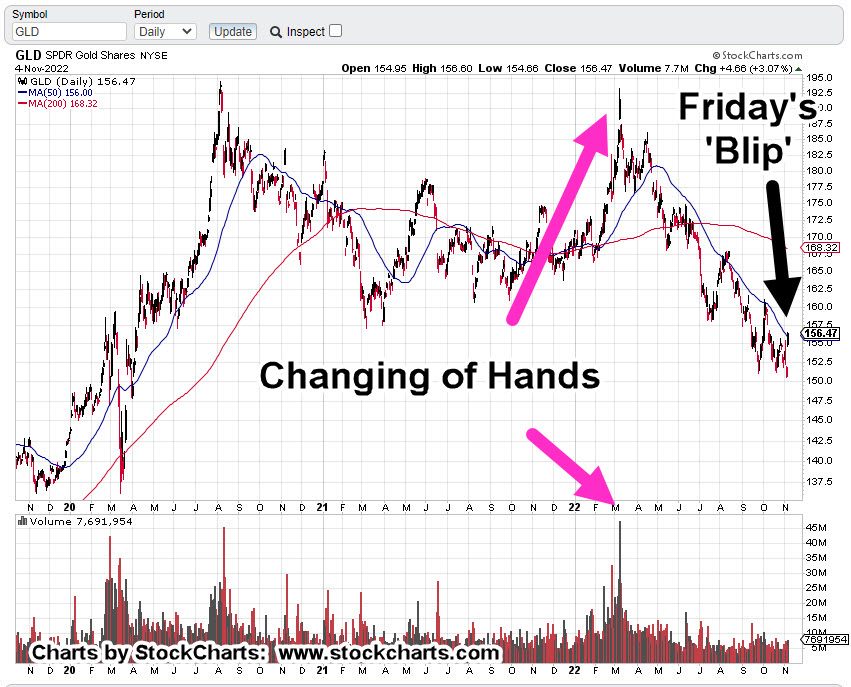
Gold GLD, Daily
Looking at the chart on the strategic, longer term, Friday’s blip is hardly noticeable. We’ve already presented how this could be a minor up-thrust (reversal) in itself.
To keep the upside intact, price action must remain and continue above current levels.
Real Estate IYR, Daily
Real estate may be working its way into an up-thrust condition. As shown, Fibonacci Day 21 from the October 13th, low is this coming Thursday, the 10th.
According to the Economic Calendar there are several potential catalysts that may push the price above resistance (temporarily).
Note: Posts on this site are for education purposes only. They provide one firm’s insight on the markets. Not investment advice. See additional disclaimer here.
Note: Posts on this site are for education purposes only. They provide one firm’s insight on the markets. Not investment advice. See additional disclaimer here.
Both time cycles and Fibonacci are aligned … targeting intermediate low(s) for the Russell (IWM), in June.
This post, released late on Monday, showed a potential reversal set-up for the IWM.
The next morning (yesterday), saw a sharp, brief move higher which quicky reversed into a sustained decline.
That decline continues during this session.
The weekly chart of IWM is below; marked up with a Fibonacci time sequence.
Russell 2000, IWM, Weekly
Week 34, identified with the back font, represents a 1 : 1, Fibonacci projection of the initial leg down.
Week 34, in the magenta font, is a 1 : 1.618 projection of the same initial move.
These are projections only (not advice, not a recommendation).
However, there’s a time cycle study available at this link.
Go to time stamp 8:27, for the Russell 2000. The method is different, but the projection is similar; heading lower into early Summer (mid to late June).
Note: Posts on this site are for education purposes only. They provide one firm’s insight on the markets. Not investment advice. See additional disclaimer here.
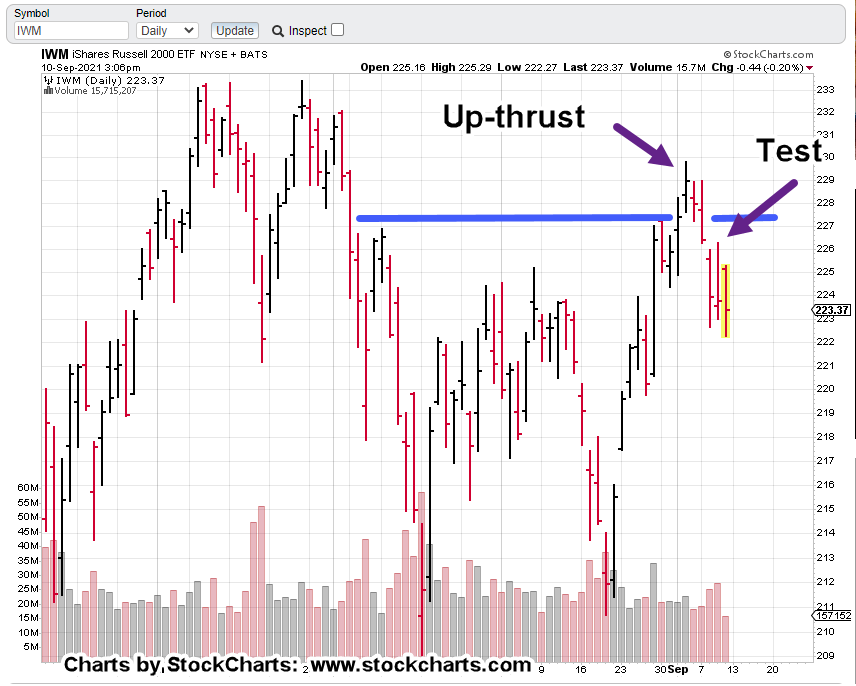
Russell 2000, attempts to break through resistance; reverses and then tests (Monday), just as ZeroHedge says the short squeeze is over.
There’s a lot of trying-to-make-everything-look-complicated, wording in the link above but the take-away is, the market may be finished with the recent short squeeze.
At this juncture, Russell 2000 (IWM) looks like it’s hit long-time resistance around the 211, area and reversed.
The past two trading days may have tested that reversal.
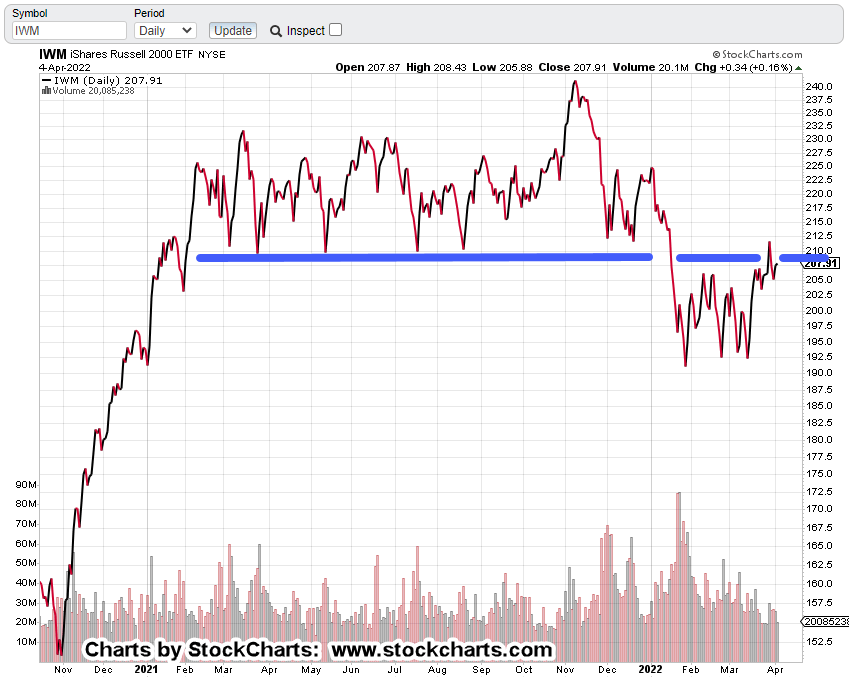
IWM, Daily Close
The support (blue line), now turned resistance has been in-effect for over a year.
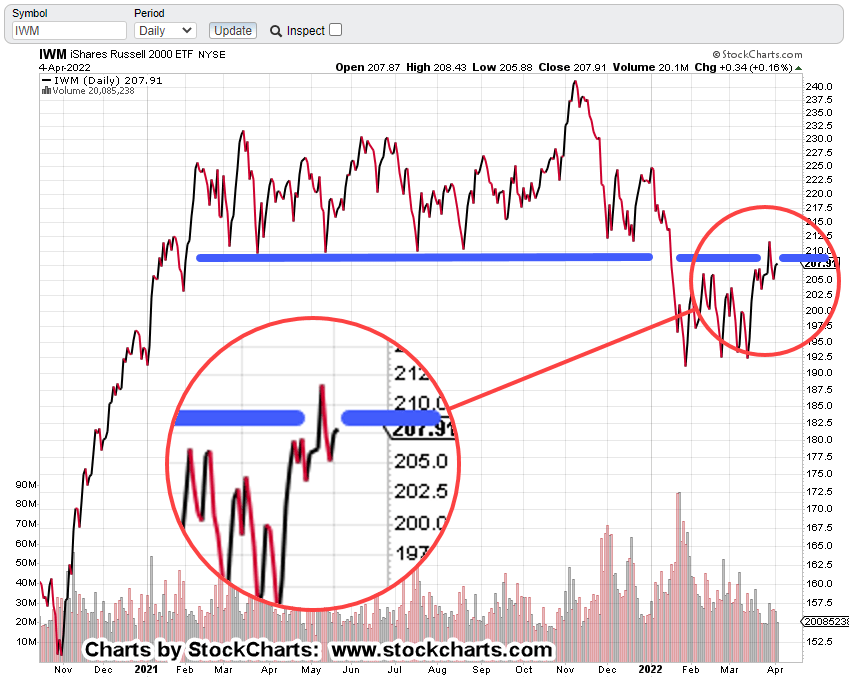
The zoomed version below shows it’s clear, at this juncture, price action’s not penetrating resistance.
As with bonds in this report, we’re at the danger point.
This is where risk is least for either short or long (not advice, not a recommendation).
Naturally, with the ZeroHedge report (above) saying that shorts have been effectively covered, price action direction favors the downside.
Note: Posts on this site are for education purposes only. They provide one firm’s insight on the markets. Not investment advice. See additional disclaimer here.
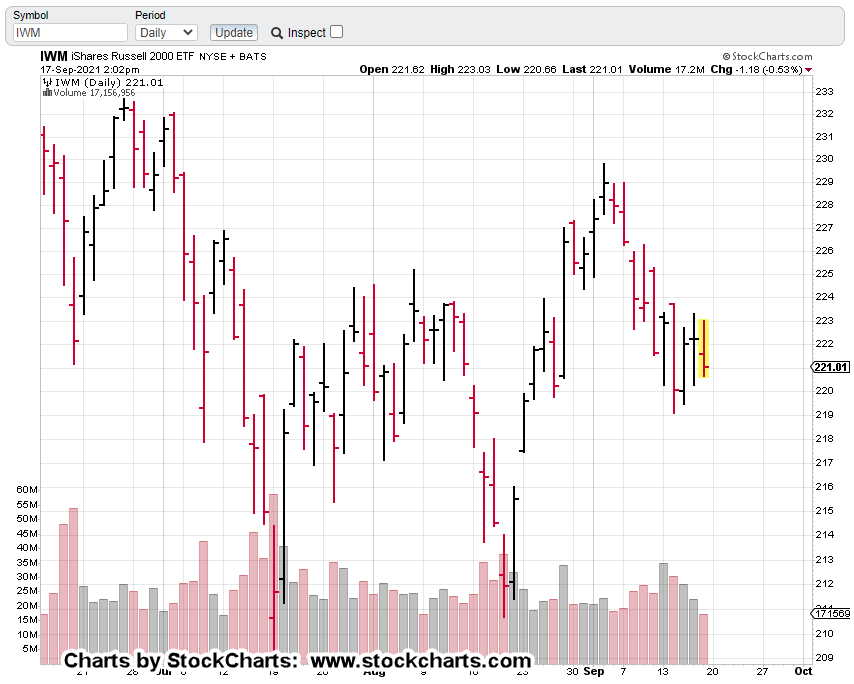
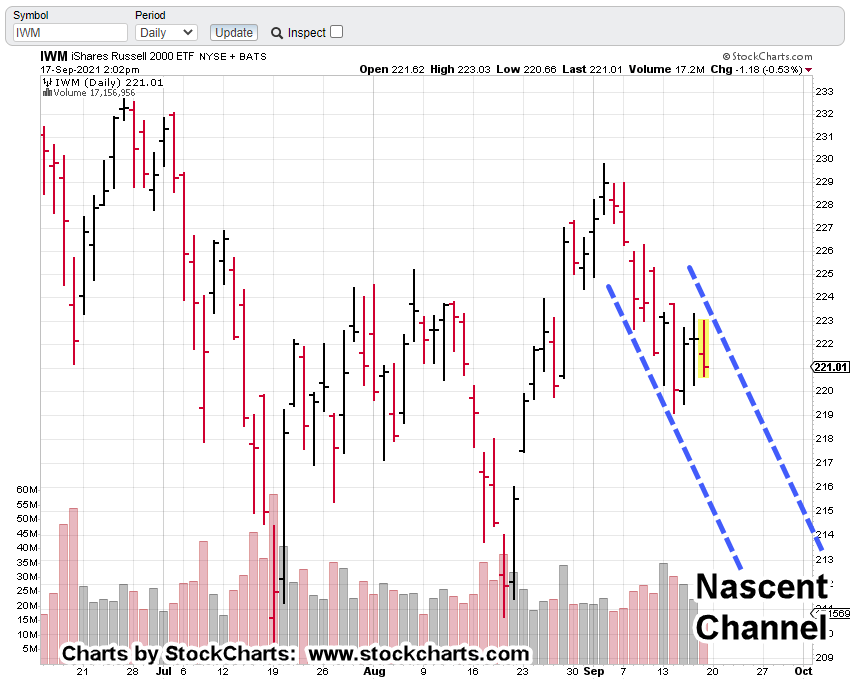
The past six months shows the Russell 2000 (IWM) in choppy and impulsive action; both up and down.
The last eight trading days have seen that choppy action begin to exhibit a hint of order.
It does not look like much … until you put in a trend-line .. or two:
Adding to the intrigue; channel width is at Fibonacci 8-Days.
If today’s session closes lower (no guarantees) and posts a new daily low (below 220.26), it adds weight the Russell may be in the very early stages of trending lower.
Note: Posts on this site are for education purposes only. They provide one firm’s insight on the markets. Not investment advice. See additional disclaimer here.
Note: Posts on this site are for education purposes only. They provide one firm’s insight on the markets. Not investment advice. See additional disclaimer here.
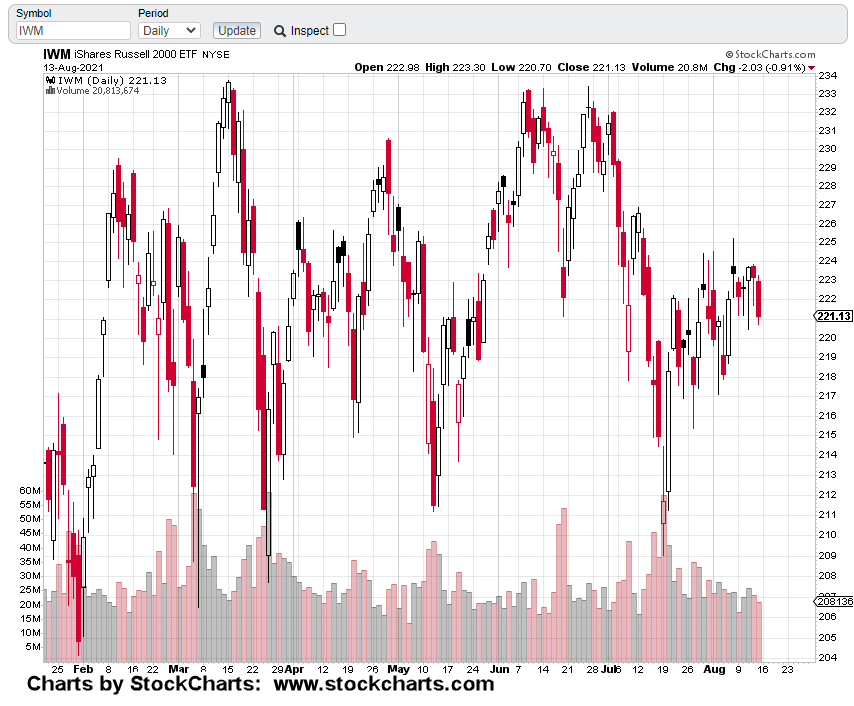
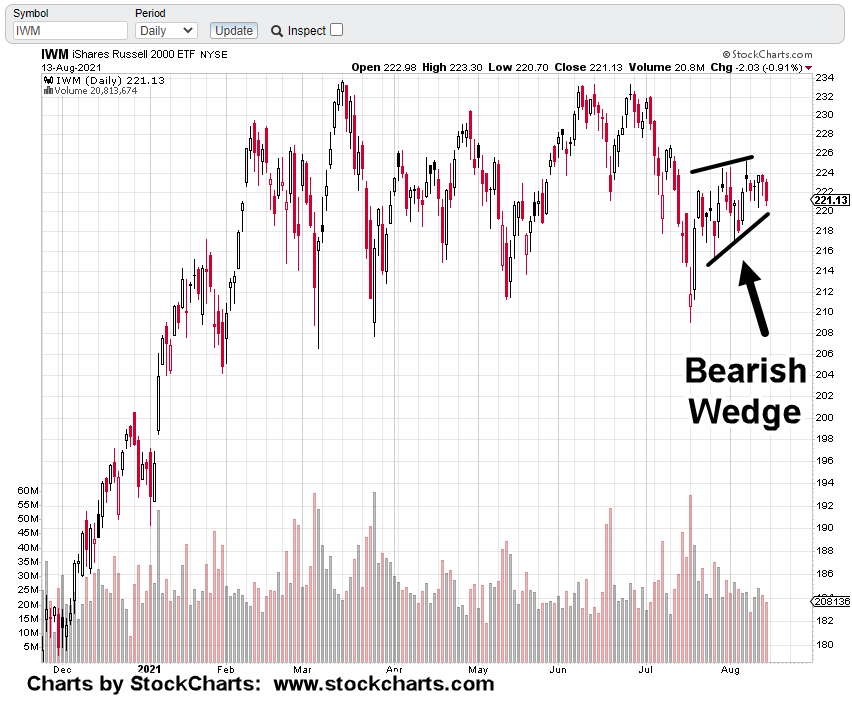
The Russell 2000 (IWM as proxy) has been congesting sideways for about five months.
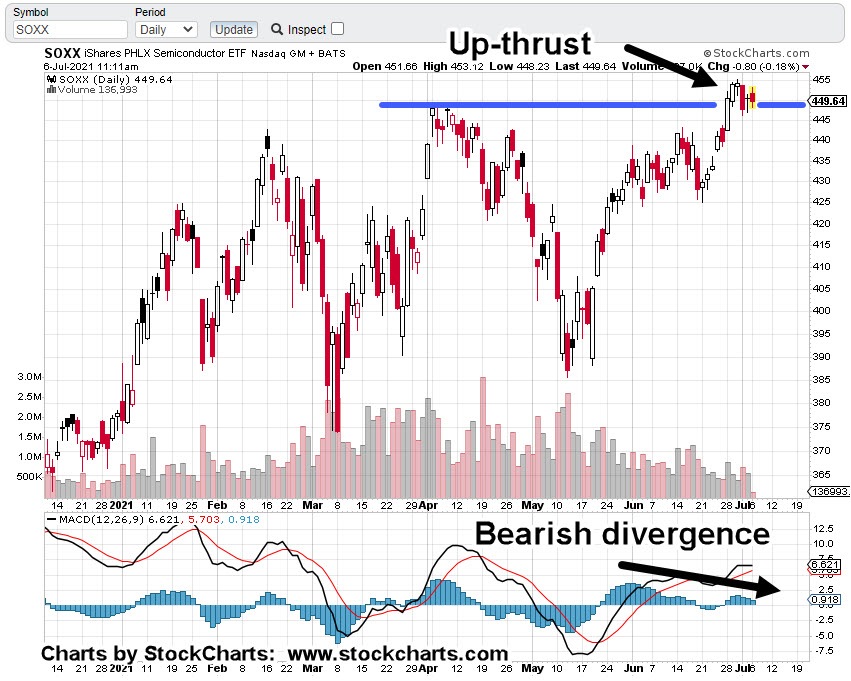
While the overall markets, S&P, Dow, SOXX, IYR and the QQQs, have been moving on to new highs … the Russell has stagnated.
Taking a cue from Steven Van Metre’s reports on ‘who goes first’ in a downturn, it’s the small caps.
At this juncture, it looks like the Russell’s ready.
The six month daily chart of IWM below, shows choppy action.
Pulling back somewhat and labeling the bearish wedge, puts it into perspective (second chart):
Pulling out and labeling the wedge:
One item of note (not shown) at the top of the wedge, where price action pivoted lower (August 6th), is a Fibonacci 62%, retrace level.
So, we have a bearish wedge retracing 62% … along with non-confirmation of the overall highs; S&P, Dow, SOXX, etc.
Major reversals take a long time to form. However, once they get underway, it’s like a juggernaut to the bottom.
Harkening back to the oil (USO) bear market of 2014, nearly all (if not all) the YouTuber’s at the time, completely missed the bearish set-up.
What they did instead, once the downdraft started, was pump out update after update about ‘catching the bottom and setting up for the new bull market in oil’.
It never happened.
Oil continued lower for a year and a half before getting into a sideways range.
The big money’s in the big move. Monitoring the Russell provides confirmation a significant reversal’s in the works (not advice, not a recommendation).
As with biotech (SPBIO), already in a bear market, the IWM could break lower while the overall markets continue to thin-out and even make new highs.
Recall, we’re getting close to an up-coming holiday: Labor Day
The 1929, high was on the Tuesday just after Labor Day weekend.
Note: Posts on this site are for education purposes only. They provide one firm’s insight on the markets. Not investment advice. See additional disclaimer here.
Note: Posts on this site are for education purposes only. They provide one firm’s insight on the markets. Not investment advice. See additional disclaimer here.