Biotech (Short), The Details

Relentless Positioning For The Downside

Like a terrier on a mailman’s leg, positioning short biotech via LABD, has been relentless (not advice, not a recommendation).

This update details the current positioning via 3X, Leveraged Inverse Fund, LABD.

This is not investment advice; this site has no obligation to provide the following information.

However, as stated in the About section, one of the purposes here, is to document trade actions and results.

With that in mind, the green arrows show the locations of LABD entries for the short-biotech (SBPBIO) trade identified as LABD-22-05.

Biotech SPBIO, 3X Leveraged Inverse Fund LABD, Daily

The magenta arrow at the far right of the chart, is the ‘break-even’ point. It’s about 1.75 – 2.0 points away from the current price.

Note: This is not ‘Dollar Cost Averaging’.

Few in the industry know that ‘dollar cost averaging’ is based on a scam conducted by the bucket shops in the early 1900s.

It’s comforting to know, that method (the scam), has made its way into at least one SEC certification requirement.

There, I feel much better 🙂

One of, if not the main reason for working this trade with the current method, is the real danger this market could ‘implode’ at any minute.

We’re just one (un)planned event away from being down 20% – 50% overnight.

Biotech SPBIO ($SPSIBI), Weekly Close

The weekly close shows SPBIO to be unique among all the major indices (miners excluded).

Not even the sister index IBB, has the weekly MA cross (black arrow) to the downside.

“You Are Here”

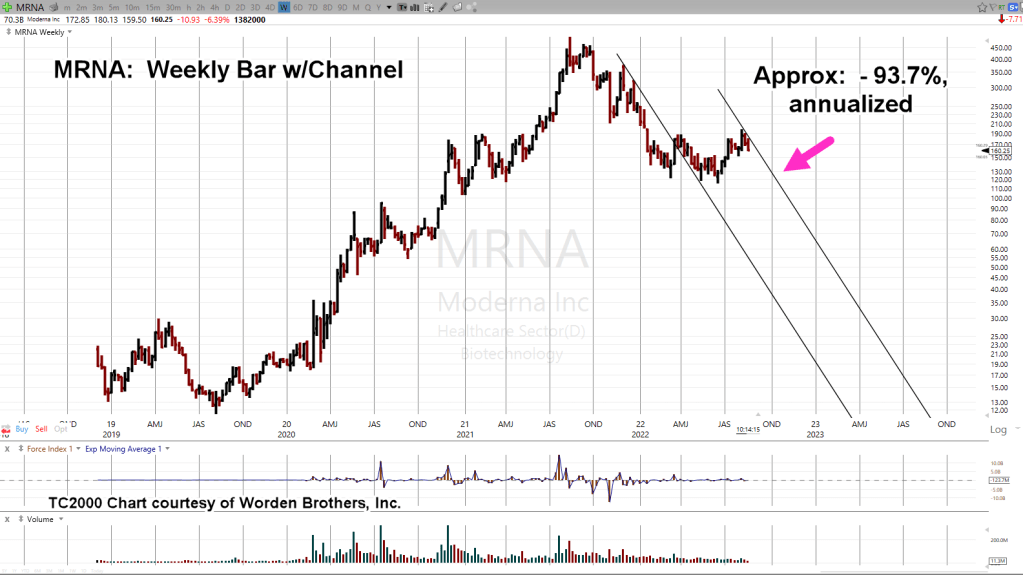
On the chart below, the complete positioning short SPBIO is shown as the magenta rectangle.

Also shown, are measured move targets.

Looking at the potential of this trade, the reason for the dogged persistence becomes clear.
Summary

As always, anything can happen … the trade could fall apart.

That’s true.

However, probabilities for continued market downside are increasing, not decreasing.

Stay Tuned

Charts by StockCharts

Note:  Posts on this site are for education purposes only.  They provide one firm’s insight on the markets.  Not investment advice.  See additional disclaimer here.

The Danger Point®, trade mark: No. 6,505,279

Biotech … Possibly, FATE(AL)

Trend-Lining @ -99%, Annualized

Is biotech about to go ‘flat-line’?

It’s not just biotech.

As The Maverick of Wall St. presents in his latest video, linked here … the entire market is poised for its next leg down.

In that video, estimates for that next leg are anywhere from -30% to -90%.

Fate Therapeutics FATE, Daily

FATE, is one of our ‘three amigos‘ of the sector, SPBIO.

The daily chart shows a confirmed, multi-hit trend line that’s declining at over -99%, annualized

FATE, isn’t the only one in the ‘- 99%’, crowd

TWST, is also trending lower at -99%, and BEAM, is running a close second at -98%, annualized.

Summary

Today, Friday (mid-session), is the last trading day before a holiday weekend.

During such days, we typically have an upward (low volume) bias.

With that, there’s still just a bit more trading room for FATE to contact the right side trendline.

Of course, what happens next will be the important part.

Stay Tuned

Charts by StockCharts

Note:  Posts on this site are for education purposes only.  They provide one firm’s insight on the markets.  Not investment advice.  See additional disclaimer here.

The Danger Point®, trade mark: No. 6,505,279

GDX, Down 5-Months, & Counting

Way Back, To 2012

We have to go all the way back nearly ten-years, to find five consecutive down-months.

The bear market in the miners GDX, and GDXJ, is not any news to those accessing (or following) this site over the long-haul.

Nearly two years ago, this report pegged the bear market before it was even a blip in anyone else’s pineal gland. 🙂

That fact’s proven-out by the listing of no fewer than ten links to other analyst’s super-bullish posts on gold and gold miners.

It’s safe to say at that time, everybody else was pointed in one (bullish) direction.

So, what’s happened to GDX (and GDXJ) since that October 25th, 2020, report?

GDX, is down approximately – 38.2%, and GDXJ, has declined – 47.6%.

Not exactly a bull market.

Senior Miners, GDX, Monthly Bar

Looking at the chart, it’s obvious; the prior ‘five-months’, distance traveled, was much less than our current situation.

Add to that, there’s no real support until lower levels. The decline’s free to continue, unabated.

Summary

This site’s primary focus is strategy. The longer term, the better.

Including the October 25th, 2020, report on the gold miners, we’re coming up on several other significant two-year anniversaries:

Bitcoin to Replace Gold?

Dollar Reversal; Ready

Corn Goes Vertical

Let’s not forget, ‘The Speck’, as we call it, was identified as a hoax well over two years ago; documented with this post.

The intuitive assessment of only partial data (at best) was, and probably will remain, the most important post of all.

Stay Tuned

Charts by StockCharts

Note:  Posts on this site are for education purposes only.  They provide one firm’s insight on the markets.  Not investment advice.  See additional disclaimer here.

The Danger Point®, trade mark: No. 6,505,279

What ? … There’s No ‘Pivot’ ?

There Never Was

Well, another financial media lie has come and gone.

As Jerrimiah Babe says, time stamp 6:05, at this link:

“The good times are over.”

The Dow Jones was down over 1,000 points on the day and finished (along with the S&P, NASDAQ) right at the session lows.

Typical action for the markets under such conditions, is a follow-through at the next trading session, Monday.

Recall, it’s been presented many times on this site (Holiday Turns), major reversals tend to occur just before, during, or just after, a holiday week.

The 2008, countertrend reversal took place on the Monday (5/19/08), leading into Memorial Day Weekend. The big one in 1929, was the Tuesday (9/3/29) following the Labor Day Weekend.

The current reversal (discussed below), if it holds, has come a couple weeks early in the ‘holiday’ window.

It’s possible because of the massive size of this monster, that a week or two does not make a difference.

Let’s look at the Dow 30 and its perfect Wyckoff Up-Thrust, Reversal, and Test.

Dow 30, DIA Daily Close

Daily Close with Fibonacci retrace levels identified.

A close-in look on the reversal area.

Looking at the zoom-chart above, we had a Wyckoff Up-Thrust that touched 61.8%, then declined sharply before coming back to test at 50%.

After the test was another sharp decline. One can make the case, the up-thrust has been tested.

Continued (overall) downside is the higher probability with a ‘no Fed pivot’ providing the tailwind.

Stay Tuned

Charts by StockCharts

Note:  Posts on this site are for education purposes only.  They provide one firm’s insight on the markets.  Not investment advice.  See additional disclaimer here.

The Danger Point®, trade mark: No. 6,505,279

Tech Talk, Biotech SPBIO

Standard Fibonacci Test

If biotech’s reversing to the downside, then it’s behaving normally.

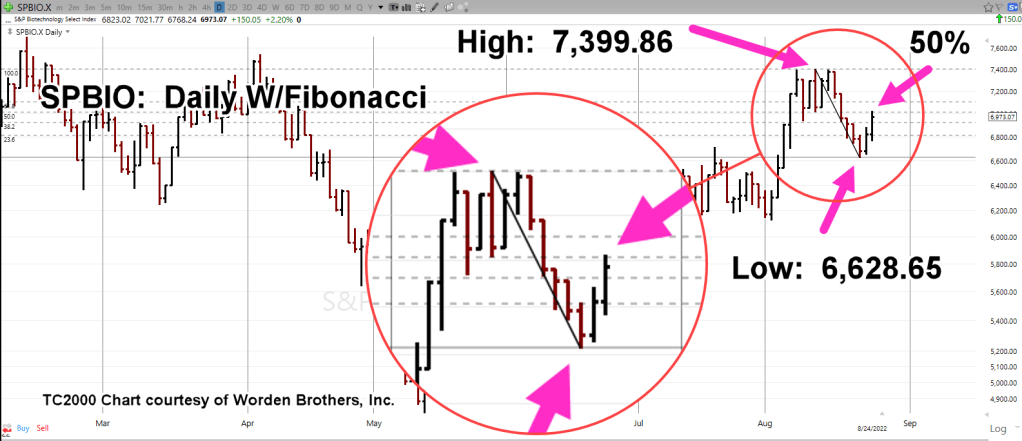
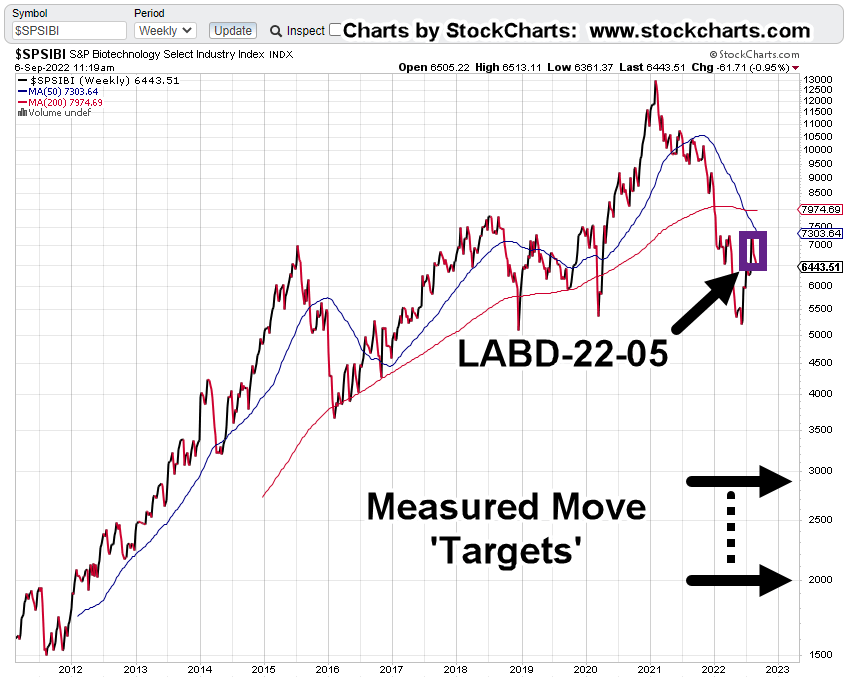
As we’ll see below, today was a standard 50%, Fibonacci retrace on the daily.

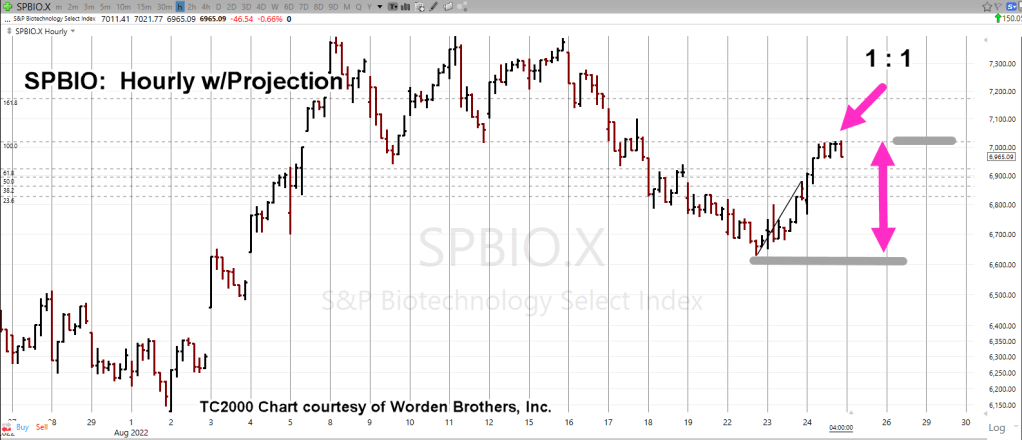
There’s an added bonus of 1 : 1, correlation on the corrective wave up to that 50%; shown on the hourly chart.

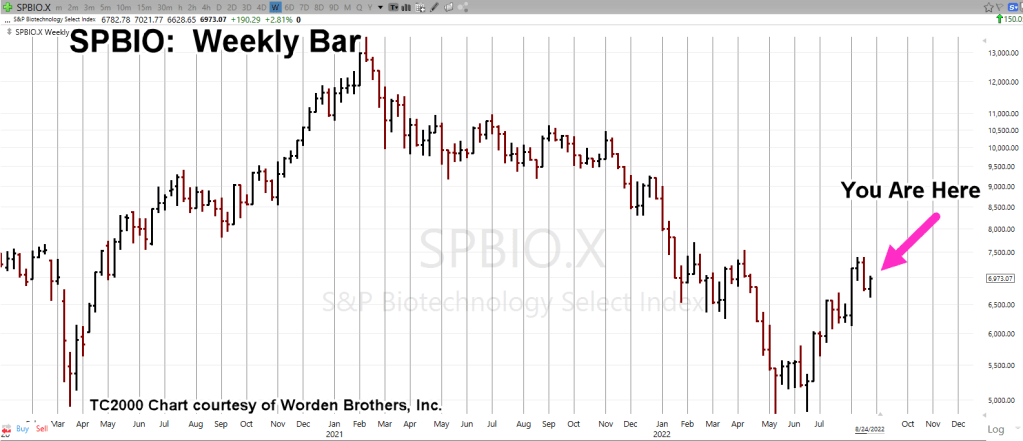
Just to get our bearings, we’ll present the longer time frame, the weekly below.

Biotech SPBIO, Weekly

Next, we’ll get closer in on the daily.

Observe the Fibonacci retrace from the recovery high (8/11/22), the interim low (8/22/22), and today’s potential retrace high.

The next chart is a zoom of the retrace area

Bonus: Hourly Chart w/ Fibonacci Projection

Corrective waves follow an ‘a-b-c’ pattern with each having Fibonacci relationships between themselves.

The hourly chart below has the retrace from the 8/22/22, interim low.

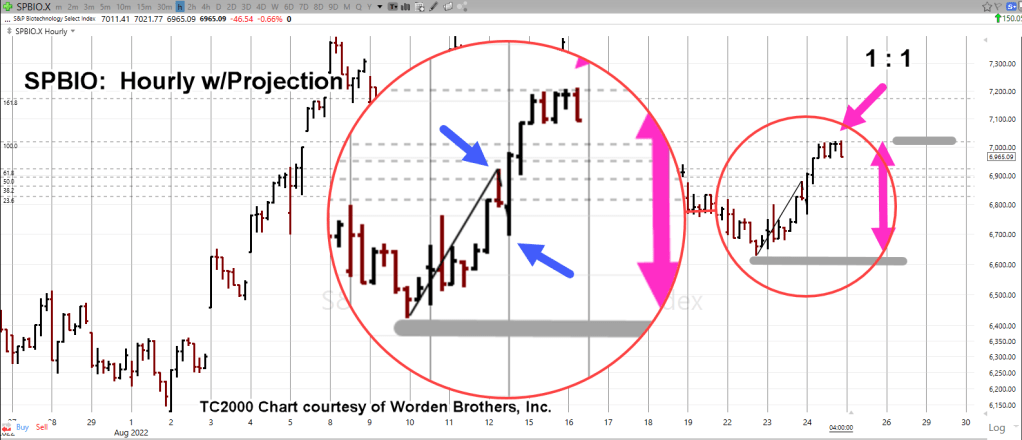
The current location of the top of ‘wave c’, is a near perfect 1 : 1, ratio of the initial ‘wave a’.

The zoom chart below attempts to provide detail on where the wave terminations were identified.

The left blue arrow is the top of corrective wave ‘a’.

The right-side blue arrow is the bottom of wave ‘b’ and the beginning of wave ‘c’.

Summary

So, what does that all mean?

We’re at an inflection point.

If SPBIO has retraced 50%, of its initial leg down from a long term high, then expectations are for continued downside action.

The fact we had a countertrend move that mapped out a near perfect 1 : 1, a-b-c correction, points probabilities to the downside as well.

However, in the market, there are no guarantees.

Stay Tuned

Charts by StockCharts

Note:  Posts on this site are for education purposes only.  They provide one firm’s insight on the markets.  Not investment advice.  See additional disclaimer here.

The Danger Point®, trade mark: No. 6,505,279

Gold’s Downside … Just Starting

Long Term ‘Changing of Hands’

A bearish analysis for gold?

What kind of idiot would think that gold (GLD) is going lower?

Well, for starters, it’s not what one ‘thinks’ that’s important.

Way back, when I was being mentored by the late David Weis, he never started our sessions with ‘what do you think’.

No, he always started by presenting a chart and then asking (and I quote), “What do you see?”

It was never ‘what’s the Fed doing’ or ‘what’s Cramer saying’ (that’s an easy one), or ‘what are earnings’ or any other number of useless, distracting rabbit-holes.

“What do you see?”

With that, we’re going to look at the long-term chart of gold (GLD) on a weekly close basis.

Gold (GLD) Weekly Close

With the passing days, weeks and now months, we can see there’s been a significant, potentially long-lasting reversal to the downside.

The prior report linked here, contains no fewer than seven other links to gold (GLD) that identified ‘changing of hands’ in various stages as it transpired.

Slow Motion Train-Wreck

So far, events in gold have been moving slowly and thus hypnotizing the gold bulls.

It was nearly two-years (20-months) between the Wyckoff Up-Thrust high (8/6/20), and the test of that high (3/8/22).

Enough time to put everybody to sleep.

At this point, GLD is back down near support levels … another bounce higher is not unreasonable.

However, it’s trading in a downward channel (not shown) that’s declining at approximately – 30%, annualized.

The above linked report presents long-term downside targets for GLD (not advice, not a recommendation).

The ‘Event’

As Pinball Preparedness puts it, each day that passes brings us one day closer to ‘the event’.

None of us in the proletariat know what the event will be.

It could be an excuse as disconnected as Archduke Ferdinand.

Stay Tuned

Charts by StockCharts

Note:  Posts on this site are for education purposes only.  They provide one firm’s insight on the markets.  Not investment advice.  See additional disclaimer here.

The Danger Point®, trade mark: No. 6,505,279

Three Amigos of Biotech

BEAM, TWST & FATE

It looks like having a real (positive) P/E, may be about to be important.

The prior biotech update said that so far, no P/E, negative P/E, and ‘no money down’ was not affecting the sector.

That is, until now.

Well, ok. I made up the ‘no money down’, part. 🙂

That little jest does not take away from the fact, biotech SPBIO, and its top three weightings, BEAM, TWST and FATE, have all reversed, decisively to the downside.

For the week just ended, BEAM is down – 22.86%, TWST down – 19.18%, and FATE down – 14.16%.

Back at the ranch in the IBB index, Moderna (MRNA) is also down – 14.65% for the week.

So, we have confirmation the entire industry is now continuing its downward course.

Contrast the reversal of index SPBIO, at – 7.04%, with S&P (SPY) at – 1.16%, and the market itself is telling us where to go for opportunity (not advice, not a recommendation).

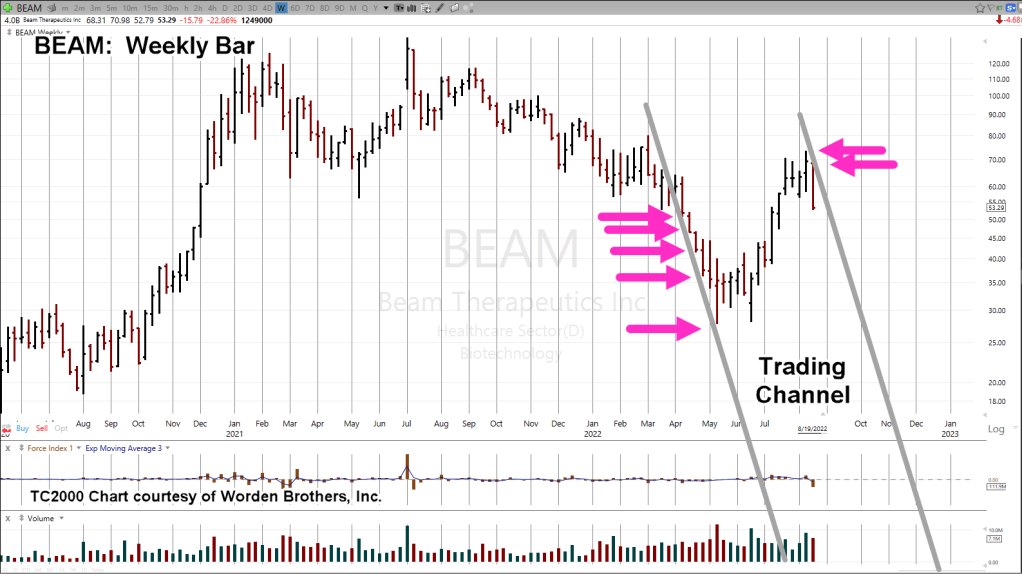
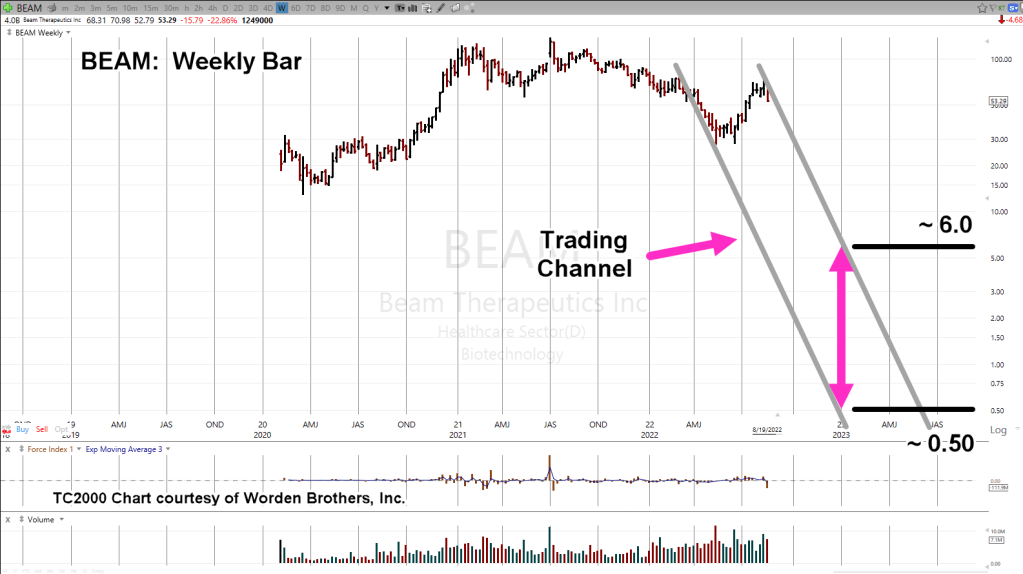
At this point, all three amigos (BEAM, TWST, FATE) are in downward trading channels.

Trading channel for BEAM is the most aggressive. The weekly chart is below.

Beam Therapeutics (BEAM) Weekly

If BEAM maintains its channel for the rest of this year, the chart below shows the target area(s) for price action.

The coming week may let us know if this channel will be confirmed or negated.

Recall, the S&P is topping out and appears to be reversing.

Goldman says the squeeze is over but that ‘downside is limited’.

We’ll see.

Stay Tuned

Charts by StockCharts

Note:  Posts on this site are for education purposes only.  They provide one firm’s insight on the markets.  Not investment advice.  See additional disclaimer here.

The Danger Point®, trade mark: No. 6,505,279

Silver’s Bull-Fight

Wedge Breakdown, Imminent?

Like a stubborn mule, silver’s just not going along with the ‘hyperinflation’ narrative.

How many years of mainstream ‘breakout’ forecasts, has it been?

‘Silver upside breakout just around the corner’. ‘Silver to launch higher because of inflation’. ‘Silver physical shortage to expose futures manipulation’ … and on.

It’s not happening. Why?

Silver, more so than gold, is an industrial metal. In that sense, more like copper than gold.

That said, silver’s price action alone, tells us (along with copper) we’re in an imploding economy.

Before we get to the charts, let’s review what was said at the last update on silver (emphasis added):

“Since gold (GLD) is in position for an upward test of its wedge breakdown (chart not shown), it’s reasonable to expect another bounce off support for silver.

Using the ‘rule of alternation’, we already had a brief move off the first support level before reversing.

The next contact at lower support, will likely bounce for longer or not at all.“

Well, ‘bounce for longer’, is exactly what we got.

The prior bounce from low to high lasted 11-trading days (5/13/22 – 5/27/22). The current bounce lasted nearly twice as long; 20-trading days.

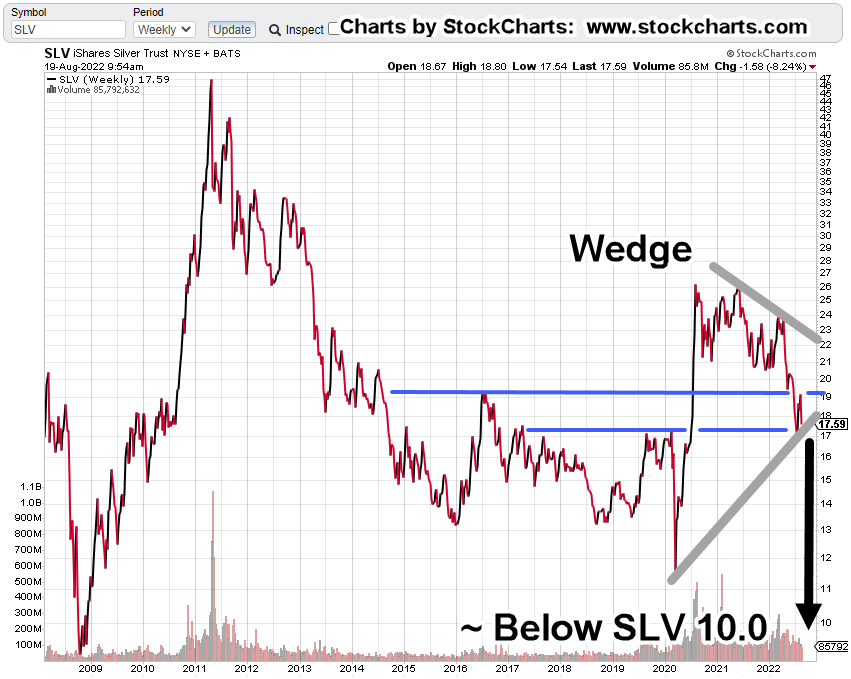
Silver (SLV), Weekly Close

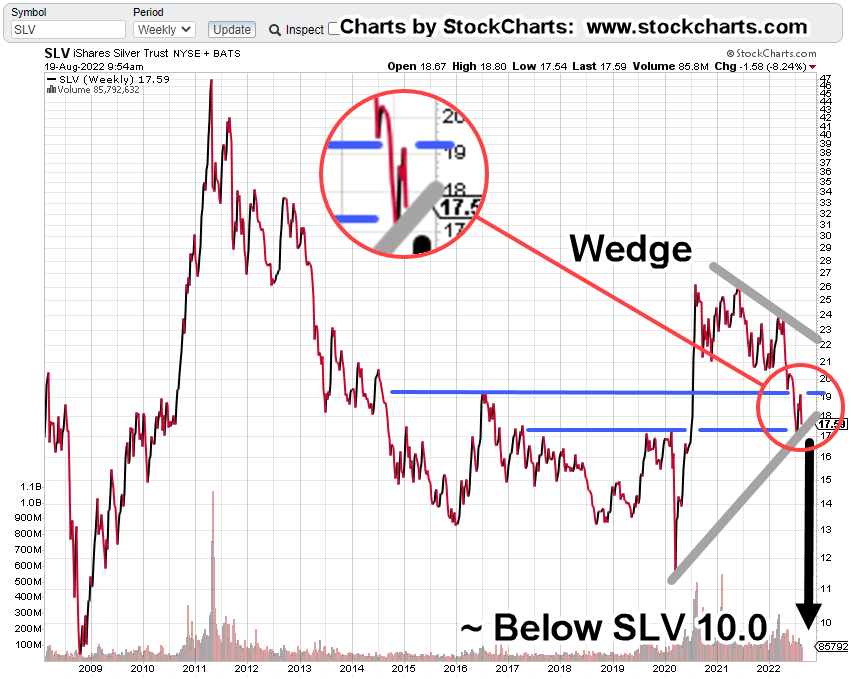
Since the last update, price action bounced off support, confirmed the wedge, tested upside resistance and now, back down to the wedge boundary.

The zoom chart below shows the detail of the resistance test and reversal.

If SLV posts a decisive break below the wedge boundary, standard traditional charting technique provides a downside target in the vicinity of SLV 10.0, or slightly below.

Summary

As always, anything can happen. If silver decides to start posting bullish action, the analysis will be changed.

At this point, with growing fundamentals of economic collapse, i.e., Great Depression 2.0, silver’s price action is fighting the bulls (and winning), thus, confirming the economic decline (not advice not a recommendation).

Stay Tuned

Charts by StockCharts

Note:  Posts on this site are for education purposes only.  They provide one firm’s insight on the markets.  Not investment advice.  See additional disclaimer here.

The Danger Point®, trade mark: No. 6,505,279
The Moderna (MRNA) Channel

Chief Cook & Bottle Washer

We’re about forty minutes into the session; Moderna (MRNA) has just confirmed the up-thrust reversal discussed in the last update.

It took seven trading days for MRNA, to post a new weekly low below 160.06.

That was plenty of time to perform research like finding this bullish outlook and deciding for oneself, whether to be bull or bear.

This update is brief.

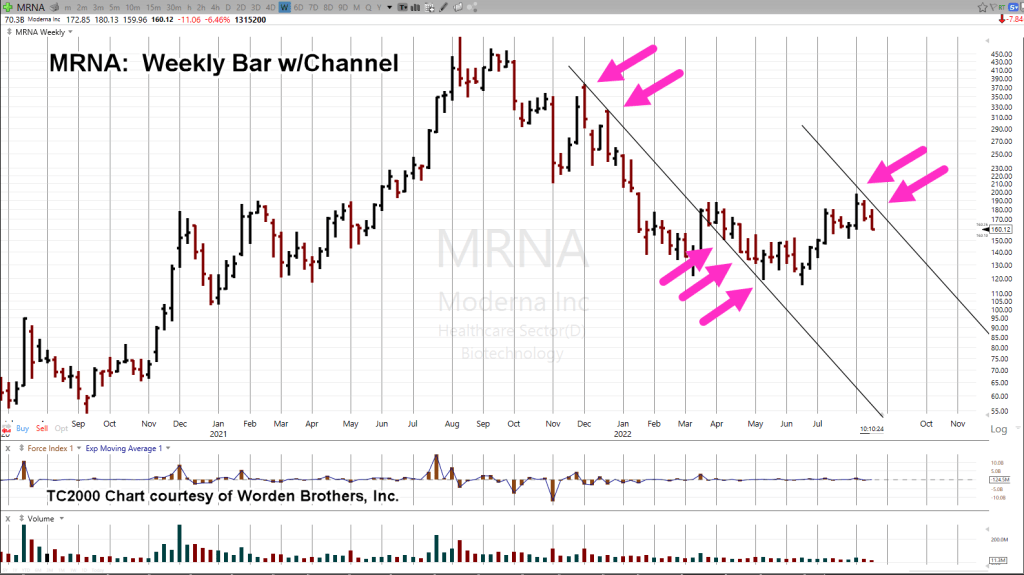
Two charts of MRNA, are shown below.

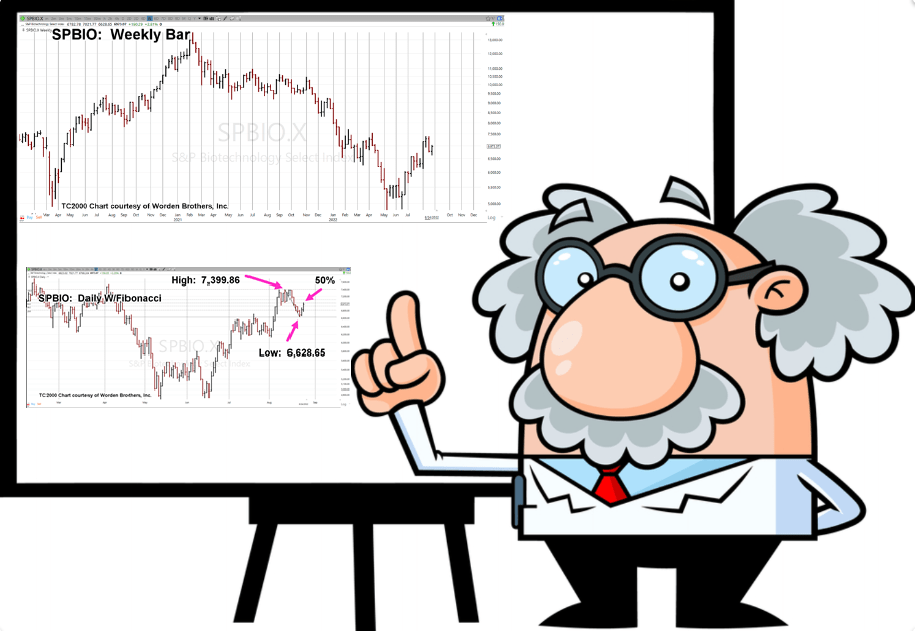
Price action’s in a channel with the right side declining at approx: – 93.7%, annualized.

Moderna MRNA, Weekly Bar

Compressed version.

We’re using MRNA, as the proxy for the biotech sector.

The previous report showed a weak 23.6%, retrace and potential reversal.

With today’s print below 160.06, it looks like an initial confirmation of the right-side trend line (not advice, not a recommendation).

Stay Tuned

Charts by StockCharts

Note:  Posts on this site are for education purposes only.  They provide one firm’s insight on the markets.  Not investment advice.  See additional disclaimer here.

The Danger Point®, trade mark: No. 6,505,279
No P/E ? … No Problem … Yet

Biotech SPBIO, Has No P/E

Is this like Carvana on steroids?

Looking at the top ten components of the SPBIO sector, making up over 14%, of the weighting, none have a P/E ratio.

The three largest weightings are listed below along with hyperlinks to their corporate summaries or research.

Beam Therapeutics Inc.: BEAM

Twist Biosciences Corp.: TWST

Fate Therapeutics Inc.: FATE

The Return on Equity for the list is Negative – 31.9%

With returns like that, it’s unlikely a positive P/E, is showing up anytime soon.

The Market Itself

Livermore worked to prefect his technique, searching for what’s going to happen in a ‘big way’.

Wyckoff discovered the market itself, decides on its next likely course.

Loeb presented the power of ‘focus’; Concentrated positions that eschewed the mediocre mantra of ‘a well-diversified portfolio’.

It’s important to note, Loeb was the former Vice Chairman of E.F. Hutton. The old commercials from the 70s, like the one linked here, were talking about him: ‘When Loeb talks, people listen’.

The Biotech Short

The vultures are circling this sector.

We’ve already shown in the last update, speculative volume on the 3X Inverse fund LABD, is literally off the chart.

The corporate links above, give us a potential ‘why’ for their short positioning.

All three of those companies have a common theme.

Stay Tuned

Charts by StockCharts

Note:  Posts on this site are for education purposes only.  They provide one firm’s insight on the markets.  Not investment advice.  See additional disclaimer here.

The Danger Point®, trade mark: No. 6,505,279