Real Estate … Ready for Reversal

Unrelenting, Down Data

‘The economy has already collapsed’.

That’s from Jerimiah Babe and is likely, correct.

Recent data-points supporting the case for ‘collapse already in progress’, are below:

American’s spending drops … again.

Pending homes sales worst annual decline … ever.

There are nine other supplemental data points for the economic mayhem, collapse, collapse-in-progress scenario; they are listed at the end of this post.

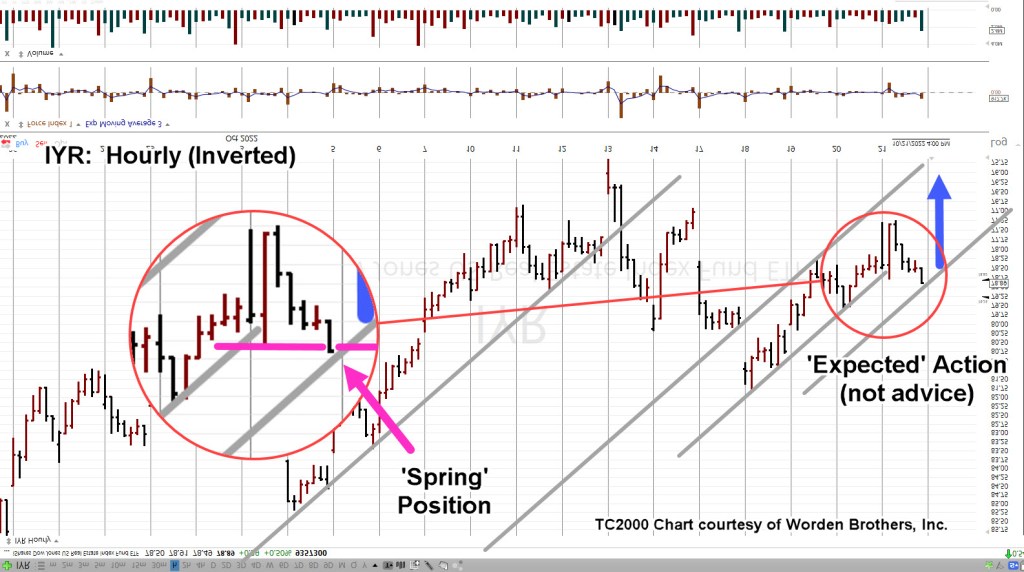
For now, we’re talking about real estate and specifically the proxy for the sector, IYR.

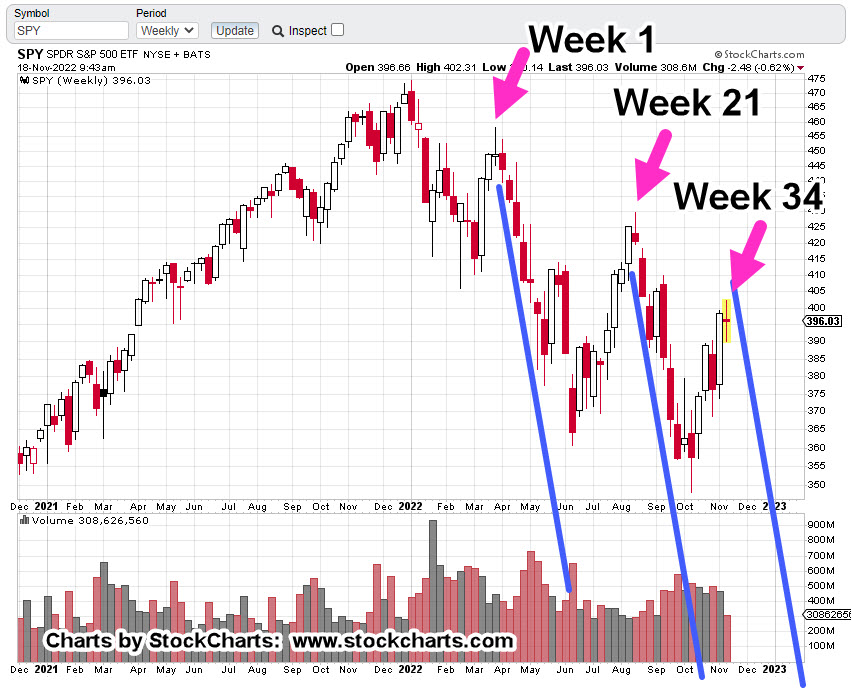
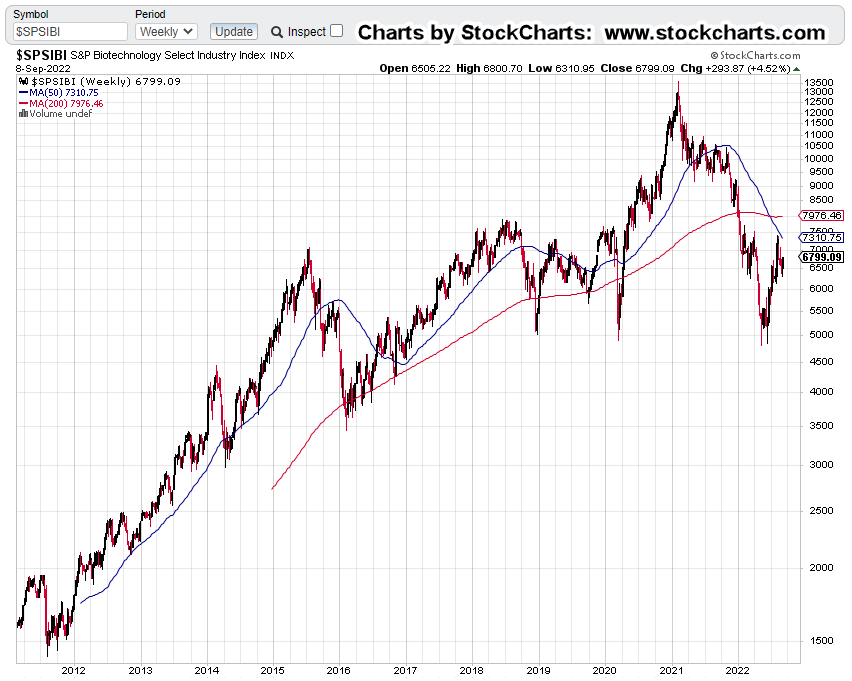
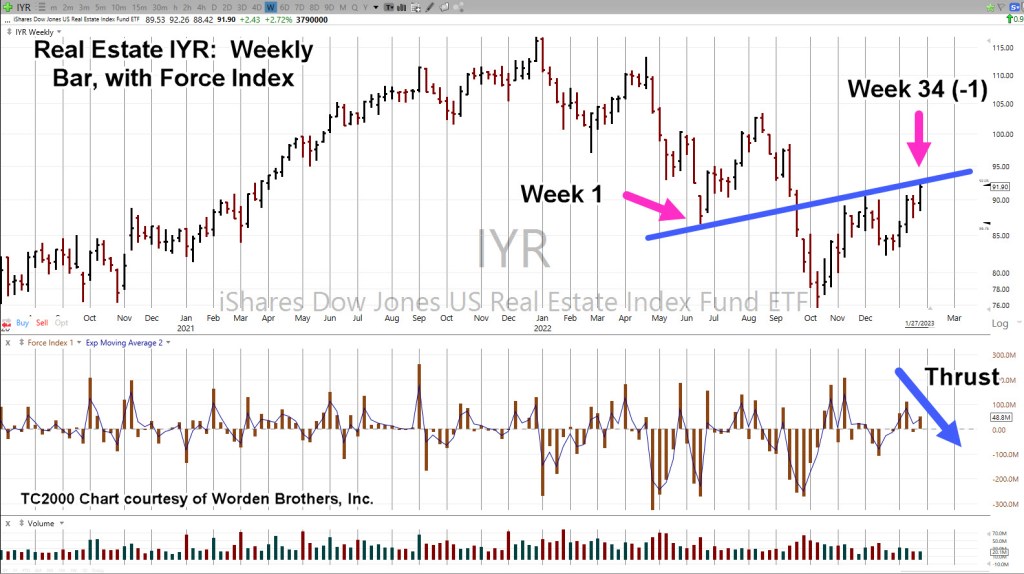
Real Estate IYR, Weekly

As stated in the last post, we’re going to follow-up with a potential IYR, downside reversal by covering three more technical points; Fibonacci time correlation, thrust energy and trading channel.

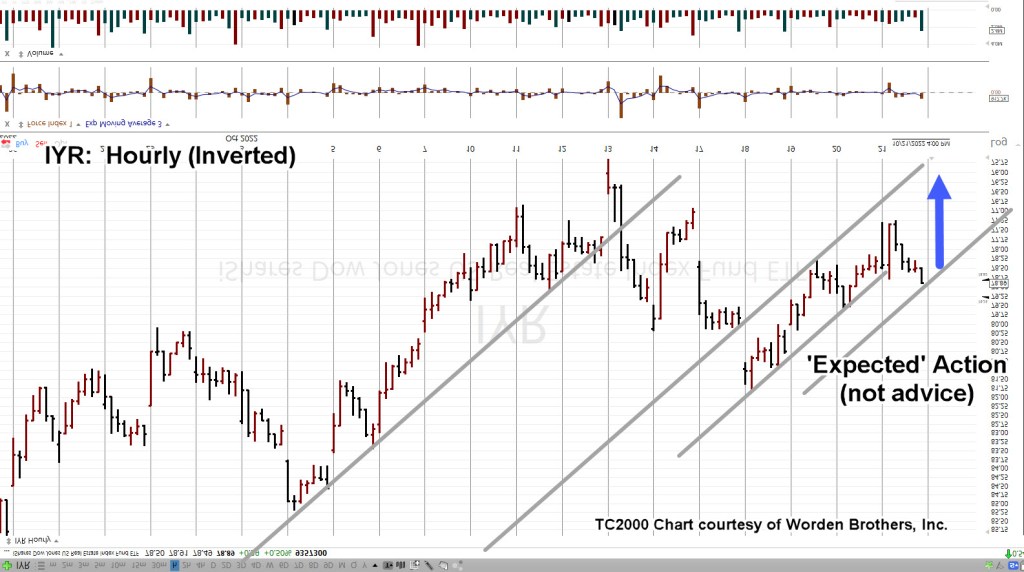
First up: Last week completed a Fibonacci 34 (-1 week) time frame that may result in a reversal into a trading channel (shown on second chart).

Upward force (Thrust Index) declined significantly over the prior upward push during the week of 1/13/23.

The weekly chart has been compressed and trading channel lines added.

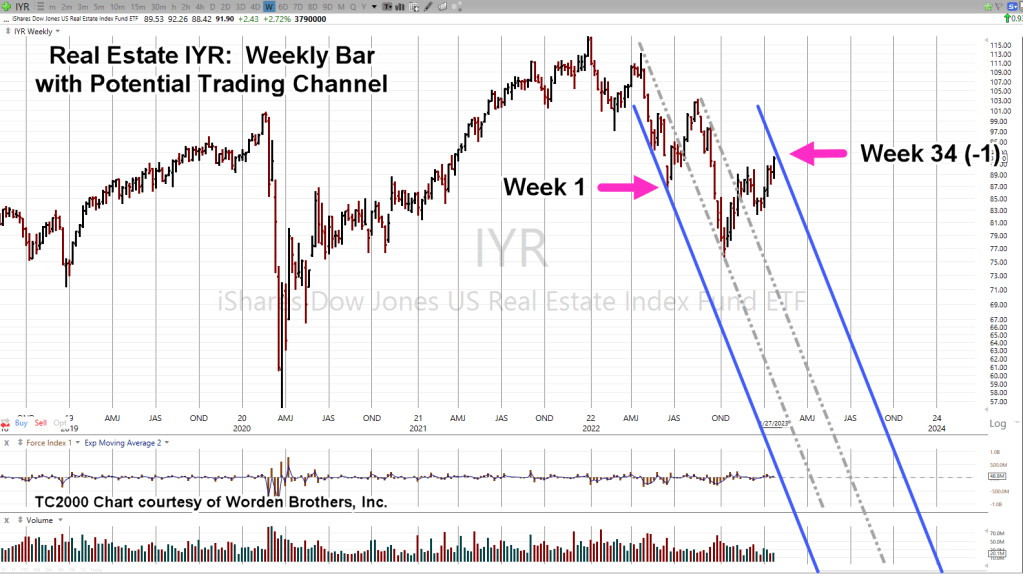
Internal trendlines are printed as grey dashed lines.

As shown, we’re at ‘Week 34 (-1)’.

If this market’s in reversal and adhering to a Fibonacci time sequence, we could see an immediate reversal or another minor high next week to make it an even 34 or go one additional week to make it 34 (+1) weeks.

Either way, we’re at The Danger Point®

The 1929 – 1932 Trading Channel(s)

Here’s a bit of insight you’ll not find anywhere else.

Research and data gathered by my firm, has shown markets tend to reverse just before, during, or just after a Holiday Week.

In our case below, The 1929, all time high was 379.61, posted on September 4th; the Tuesday following the Labor Day Weekend.

The final low and subsequent reversal was 41.81, posted on July7th 1932; the Thursday following the July 4th Holiday:

Enough Said.

Chart provided by macrotrends @ www.macrotrends.net

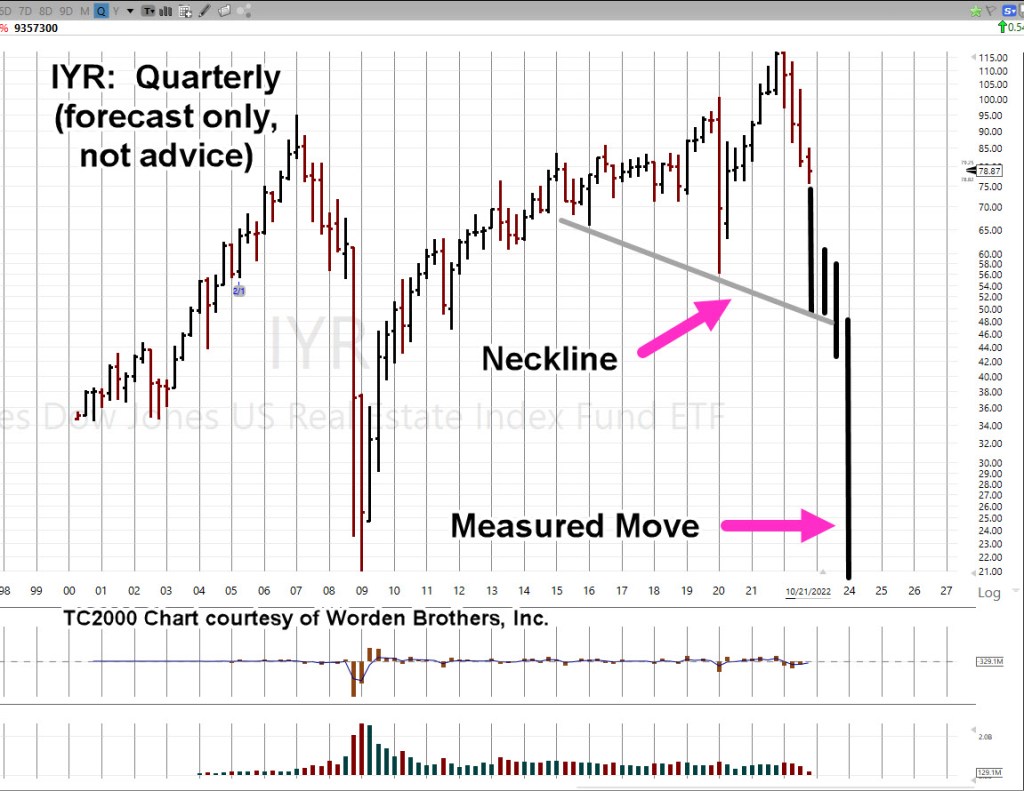
There are at least three main trading channels in effect for the entire (nearly) three year down move.

Trading channels are an old and repeating characteristic of the markets.

Real Estate Re-Cap

The all-time high in real estate IYR, was 116.89, posted on December 31, 2021, the Friday before the New Year’s Weekend.

Since then, there have been several trading channels in effect; at this juncture, we may have yet another.

With the data links provided at the beginning and the links at the end of this post, sustained price action to the downside is more probable (not advice, not a recommendation).

This coming week is likely to be quite interesting as the Fed continues on its path of price and demand destruction.

Stay Tuned

Charts by StockCharts

Note:  Posts on this site are for education purposes only.  They provide one firm’s insight on the markets.  Not investment advice.  See additional disclaimer here.

The Danger Point®, trade mark: No. 6,505,279

Addendum

Congratulations on reading this far. You must be serious about your work. Supporting data for the bearish case is below.

Housing data stabbed in the heart.

Blackstone redemption limits

Population set to collapse or is already collapsing.

Real estate fire sales … just the tip?

Home sales biggest annual drop.

New ‘protections‘ affecting the market?

Copper prices at record highs.

Pilots with bad hearts? No problem.

Where did all the workers go?

Gold … Now, Comes Deflation

The ‘Pivot’, No One Expects

Happy days are here, again!

So, the Fed can pivot, and the bull’s on again.

At least, that’s what the media wants us to believe. The CPI is out, and ‘inflation’ has slowed.

The problem is, as Michael Cowan stated in this update (he’s done the work), from here, it does not matter what the Fed does.

The decline (crash) or whatever you want to call it, is baked in the cake.

Once deflationary forces start, it becomes a juggernaut.

The previous update on gold (GLD) showed in multiple time frames, upward thrust energy is dissipating; in at least one case, (weekly) it’s also divergent.

Now that we’ve had yet another blip higher, as expected, it’s rabid bullishness in the gold camp.

So, let’s look at what GLD, is actually doing. What does the market say about itself?

Gold (GLD), Daily

One thing is for sure; GLD, is at The Danger Point®

If GLD can’t hold above (and move above) this level, it may be in serious trouble.

Let’s look at it a different way … the terminating wedge.

A ‘wedge’ is typically the last pattern in a move up or down, hence the name.

As this post is being created (12:23 p.m., EST), GLD continues to decline from its open; currently sitting right at the resistance (potential support) level at the 168-area.

In a separate market, biotech SPBIO, has completely reversed its opening spike and is now posting lower.

We’re still maintaining the LABD-22-14 trade (not advice, not a recommendation).

Today’s CPI print and resulting price action, may be the kick-off to an overall sustained and persistent decline.

Stay Tuned

Charts by StockCharts

Note:  Posts on this site are for education purposes only.  They provide one firm’s insight on the markets.  Not investment advice.  See additional disclaimer here.

The Danger Point®, trade mark: No. 6,505,279

Biotech’s, ‘Cash Burning Inferno’

If There’s One, There’s Probably More …

How many biotech ‘outfits’ are at risk of being incinerated during a market implosion?

For activist short-seller, Scorpion Capital, they’ve found at least one and they’re not mincing any words.

They sate: Twist Bioscience (TWST) is ‘cash burning inferno‘ and then go on to say:

Price target for TSWT, is Zero.

Their report supporting that assessment is linked here.

Note: It’s 236-pages, long!

Maybe it’s a one-off.

However, considering the other market implosions in just the past week, probably not.

As is typical for an equity in a long decline, the lawsuits have already started.

Other implosions just in the past seven days, are FTX, and Twitter. Maybe, Amazon (AMZN) will be next.

Analysis, vs. Antics

Seems like every other week or so, we’ve got some kind of Alpha, Beta, Delta, Gamma, extreme du jour, that’s supposed to cause ‘fireworks‘.

Reporting on fireworks, does not help navigate the current (or any future) situation.

What does help, is to clearly and without bias, assess what price action’s telling us.

We’ve already analyzed the biotech sector many times over as (potentially) the index most susceptible for a severe decline if not outright implosion.

That implosion may already be underway (not advice, not a recommendation).

Back To Wyckoff

Wyckoff analysis pointed us to biotech over a year ago.

Now, as is typical, the truth is starting the come out; a trickle at first …

So, for today’s update were going shift gears and follow-up on the prior two posts here and here.

We’ll take another look at the S&P (SPY); specifically, the weekly chart.

S&P 500, Weekly

The weekly is shown with trendlines.

Looking at those lines, is there any other basis for drawing them at the location shown?

The short answer is yes and it’s on the second chart.

The chart below has a Fibonacci time correlation for the trendlines, now, potential trading channel.

We’re currently at Week 34, from the beginning of the (potential) channel.

It may be something, it may be not.

As of this post (10:07 a.m., EST), we don’t know and price action itself, is the final arbiter.

Summary

Because of the supposed ‘fireworks’ scheduled for the day, we may not know if we’re at a pivot point until next week.

That week just so happens, to be a holiday week.

Many times, this site has a presented a proprietary insight; market reversals tend to occur just before, during, or just after a holiday week.

Obviously, the most famous of these was September 3, 1929 (the day after Labor Day weekend), which was the all-time high and reversal, leading to the crash.

Stay Tuned

Charts by StockCharts

Note:  Posts on this site are for education purposes only.  They provide one firm’s insight on the markets.  Not investment advice.  See additional disclaimer here.

The Danger Point®, trade mark: No. 6,505,279

Set-Up Details … Real Estate

At A ‘Confluence’

The last update, posted late in the session, said with the upward bias provided by the sizable Op-Ex event, we can look for the weakest (or one of the weakest) sectors.

The chart below summarizes yesterday’s action:

Friday 10/21/22, Single Day Gains

Gold miners GDX, is the outlier at the top and real estate IYR, the outlier at the bottom.

Before anybody gets excited about ‘hyperinflation’, just a reminder; silver SLV’s, action has retraced to a weak 38.2% (chart not shown), as it was forecasted to do from last week’s update:

“Silver (SLV) is currently at support levels; therefore, some upward action (staying below SLV: 18.5) is normal behavior.”

Price action is the final arbiter; we’ll see what happens next.

Back to real estate.

Professional Wisdom: ‘The Crash’

We’re going to use the experience and insight provided by Scott Walters concerning the potential for real estate; that is, we’re in a world-wide event the scale of which, no one alive (and possibly, ever) has seen before.

The Economic Ninja has just seconded that opinion (time stamp 3:45) with his quote:

“Right now, we are in the greatest collapse since The Great Depression; and I believe it will be as severe, if not worse, sharper, faster, than what people experienced in 1929”.

So, what would that ‘collapse’ look like on a chart of real estate, IYR?

Ah, yes. That’s the hard part.

To take useful wisdom like that above, and somehow map it into potential market behavior.

For that, we’re going to use the Quarterly chart of IYR.

Real Estate IYR, Quarterly

There are still two months and one week left to go in the 4th, Quarter.

We’re at a confluence of price action as we’ll cover in the Hourly chart farther down; first, what’s the potential?

Here is one artist’s rendition (not advice, not a recommendation).

That puts it into perspective.

We may know at the very next open, if we’re pivoting higher or continuing the decline.

Butterfly In The Amazon

Of course, the market’s not going to tell anyone its next move. We have to decipher that (read the tape) ourselves.

Sometimes, as Wyckoff said a century ago … ‘It’s as if the weight of a feather is all that’s needed, to push the market further or to reverse.’

So, let’s look at that feather (the butterfly) on the hourly chart.

Since we’re positioned short (DRV-22-05), the chart’s inverted to mimic leveraged inverse fund DRV.

Real Estate IYR, Hourly (Inverted)

The important part is we see a repeating pattern of trendlines.

Moving in closer, we have this. The blue arrow is ‘expected’ action based on the analysis up to this point (not advice, not a recommendation).

Moving even closer, the zoom shows IYR, finished the day in Wyckoff spring position; having pushed past minor support (resistance on non-inverted).

Summary

If IYR opens lower or gap-lower, we’ll have to wait and see if it posts a new daily low (below IYR ,77.24).

If that happens, we have some confirmation lower prices are ahead and can then set a definitive stop for DRV-22-05.

Obviously, a higher open (pushing past IYR 78.91), negates the trade.

Stay Tuned

Charts by StockCharts

Note:  Posts on this site are for education purposes only.  They provide one firm’s insight on the markets.  Not investment advice.  See additional disclaimer here.

The Danger Point®, trade mark: No. 6,505,279

Decision Point: Biotech

To Bounce, Or Not

Final stages of the bear market?

That’s what the ‘analyst’ at this link has to say.

If you know your market history, ‘opinions’ like that were pushed out all the way down to the bottom after the crash of 1929.

As for me, I’m going with the 78-year-old money manager that was quoted saying (paraphrasing):

‘It’s the biggest bear market of my life.’

Back to the analyst above, another opinion could be (looking at price action), we’re not in the ‘final stages’ of anything … except maybe the beginning.

Before we leave the topic, IYR real estate closed at 103.84, when the ‘old-timer’ spoke. Yesterday’s close was 81.43, down -22%, from that level and down – 30.3%, from all-time highs … and counting.

The ‘final stages’ of this decline is (potentially) years, if not decades away.

Biotech Decision Point

With about twenty-minutes before the open, biotech SPBIO, is set higher with leveraged inverse (pre-market) LABD, down approximately – 1.6-pts. (-6.3%).

We’re at a decision point for the sector.

Looking at the chart of inverse LABD below, a trend (and potential trading channel) is clear.

This morning’s gap-lower open is set to test that trend.

SPBIO, Leveraged Inverse LABD, Daily

If biotech remains in its downtrend that started at the August 11th, high of 7,399.86, expectations are for some kind of upside LABD, reversal within the first hour of trade.

If not, price action then opens the door for a move above established resistance at SPBIO, between 7,400 and 7,700.

As unbelievable as that would be, it could still happen.

Summary

The first hour of trade will be watched closely.

Price action itself will define if SPBIO, has fished its down move or if we’re just confirming the trend already established.

Stay Tuned

Charts by StockCharts

Note:  Posts on this site are for education purposes only.  They provide one firm’s insight on the markets.  Not investment advice.  See additional disclaimer here.

The Danger Point®, trade mark: No. 6,505,279

We’ve Seen This Movie, Before

1907, 1929, 1974, 1987, 2000, 2007, … and Now

As Scott Walters has said:

It’s different this time.

It’s Worse!

That ‘worse’ part includes the adverse moves in the market.

This time around, as opposed to ’07 – ’08, they really do seem to be worse.

Which, brings us to biotech SPBIO.

Biotech SPBIO, Weekly

Just to remind ourselves where biotech is at the moment, we have the un-marked weekly chart.

This sector’s the only one (miners excluded) that’s trading below the 50-Week and 200 Week Moving Averages with a 50-wk cross to the downside.

On a weekly basis, we’re in a major long-term downtrend that looks to have finished its upside correction.

Getting closer-in on the hourly chart we have the following.

SPBIO, Hourly

What do you see?

Here’s the marked-up version.

Over and again; a fractal set-up called ‘Spring-to-Up-Thrust‘.

The zoom chart below shows that price action appears to be struggling at the resistance area (black line).

Danger Point

At this juncture we’re at The Danger Point®

Enough of a push higher and SPBIO, could continue on upward, overcoming significant technical and fundamental barriers.

However, since we’re trending lower in the longer timeframes, probabilities suggest that downtrend may be ready (or near ready) to re-assert itself.

Stay Tuned

Charts by StockCharts

Note:  Posts on this site are for education purposes only.  They provide one firm’s insight on the markets.  Not investment advice.  See additional disclaimer here.

The Danger Point®, trade mark: No. 6,505,279

Gold & Silver, Timeline’s End ?

Government, Is Always Last

The laws enacted by the Government to prevent the crash of 1929, were passed in 1934.

So, now we have at least two states (here and here) eliminating sales tax on the purchase of gold and silver.

Where were they way back in 2001, as the metals were bottoming?

Interestingly (then again, not) it’s a Fibonacci 21-years, nearly to the day, from that 2001 bottom.

That’s not the only Fibonacci correlation being observed.

Let’s take a look at Junior Miners GDXJ, and see if it too, has a Fibonacci event.

Junior Miners GDXJ, Weekly

We’re just one week short of Fibonacci 13-Weeks, from the late January 2022, bottom.

One extra week is well within margin of error when considering the 89-Week timeframe as shown.

But wait, there’s more.

Looking at the daily chart, not only is there a bearish MACD divergence, we’re also just one day shy before it’s a Fibonacci 55-Days, from the 1/28/22, bottom.

Junior Miners, GDXJ, Daily

Can it all line up this perfectly?

Well, it can if no one is watching; that’s where the crowd and the government come in.

Summary

It’s a fairly safe assessment, nobody expects a downside reversal … nobody.

Even though time and again, we have clues that opportunity for precious metals may come later not sooner (not advice, not a recommendation).

The lockdowns in Shanghai with subsequent starvation and bartering (here and here), show under such conditions, precious metals are nowhere on the list.

Closer to home, the Texas Freeze of 2021, exposed that (lack of metals demand) as well.

Housing prices are starting to ease-off as well as prices for used cars.

Gold (GLD) may have reached its peak, March 8th, this year. Let’s see what happens next.

Stay Tuned

Charts by StockCharts

Note:  Posts on this site are for education purposes only.  They provide one firm’s insight on the markets.  Not investment advice.  See additional disclaimer here.

The Danger Point®, trade mark: No. 6,505,279

The Plug has been Pulled

Mid Session

92-Years Almost To The Day

Barring any new highs in the S&P, which seems less and less likely, the market has bookended two historic extremes.

September 3rd, 1929, was the peak back then; September 2nd, 2021, is the peak now.

This site has said many times, if we’re doing our job right, whenever the big reversal comes, we’ll already be in position (not advice, not a recommendation).

So, far that has proven to be correct; having gone short via DRV and TZA during the past week.

This down move is still very young. It’s almost imperceptible and could somehow be negated.

However, with each passing day when there’s no attempt or unsuccessful attempts at new highs, downside probability continues to build.

Stay Tuned

Charts by StockCharts

Note:  Posts on this site are for education purposes only.  They provide one firm’s insight on the markets.  Not investment advice.  See additional disclaimer here.

What’s Next For Biotech?

Mid Session

Biotech SPBIO, In A Rally

Ready For Up-Thrust Reversal?

We already have the clue.

Biotech SPBIO, just went into a spring condition and is now in a rally.

From the sage observations of David Weis, we can expect … or at least start to look for, an Up-thrust.

The unmarked daily chart of SPBIO, is below. The charts that follow, show the potential up-thrust area. After that, we have a Fibonacci 23.6%, level added.

Just to add intrigue, September 7th, is 12-days from the August 20th low … well within acceptable range for a Fibonacci 13-Days.

Spring and Up-thrust notations:

Fibonacci retrace level:

Stay Tuned

Note:  Posts on this site are for education purposes only.  They provide one firm’s insight on the markets.  Not investment advice.  See additional disclaimer here.

Market Top, September 7th?

The Day After Labor Day, 1929

The Tuesday after Labor Day 1929, was the the Dow high before the crash.

Empirical data gathered over the years has shown markets tend to reverse just before, during, or just after a holiday week.

Will that apply this time around?

At least three things will happen on Tuesday, September 7th.

Relief assistance‘ runs out. It will be a Fibonacci 13-days from the S&P August 19th low. Tuesday the 7th, is the first market open following a holiday:

Stay Tuned

Charts by StockCharts

Note:  Posts on this site are for education purposes only.  They provide one firm’s insight on the markets.  Not investment advice.  See additional disclaimer here.