What Do You See?
We’re heading straight into winter.
Who knows what type of ‘weather’ we’ll have this time.
So, nat-gas can’t go any lower than where it is now, right?
Wrong
That type of thinking’s called a ‘Mind Trap’, link here.
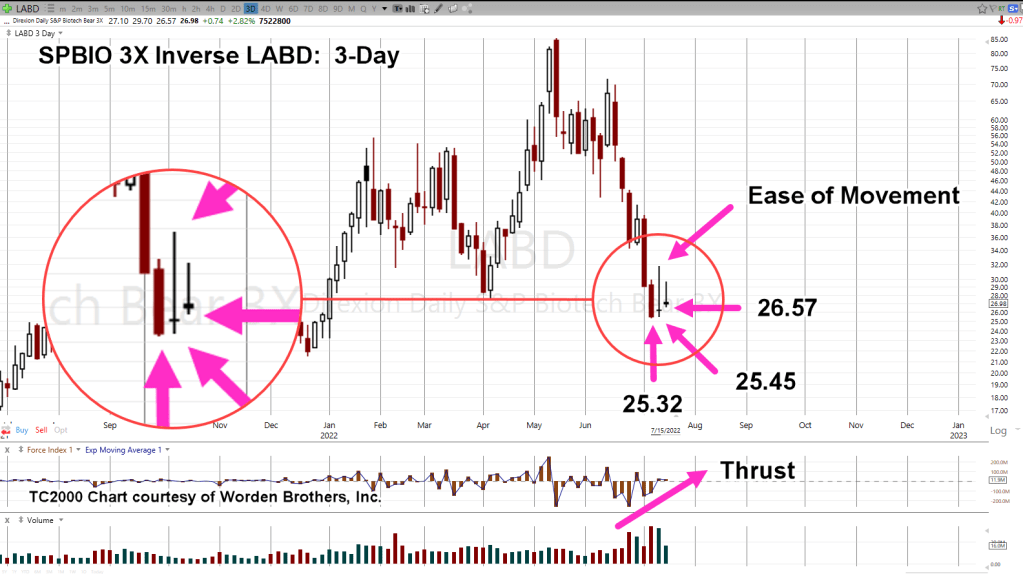
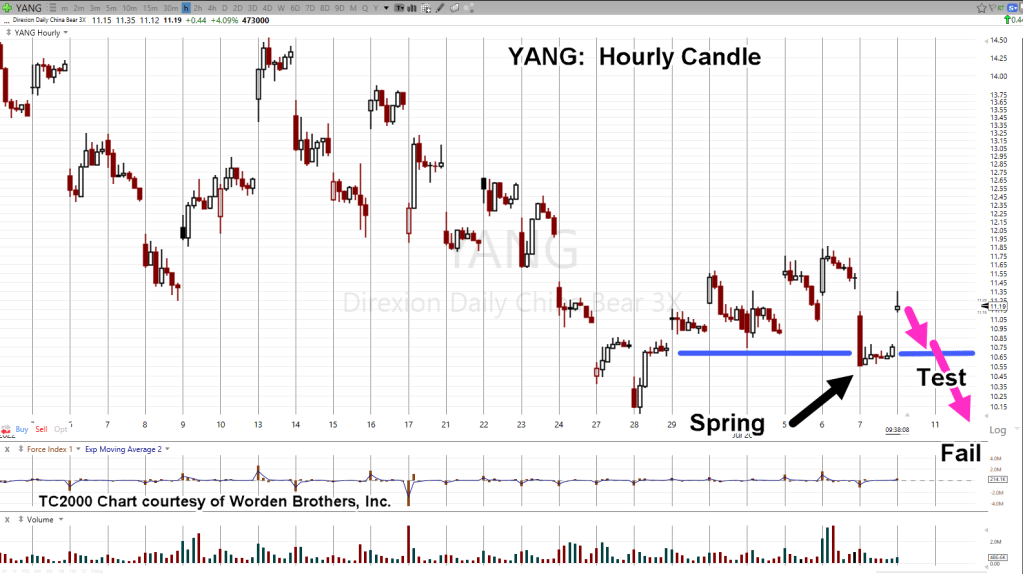
David Weis would typically start mentoring sessions with a question (after presenting a chart):
“What do you see?”
Forgetting all the factors that ‘should’ drive the price of nat-gas higher, we have the chart.
Natural Gas ETF, UNG: Daily
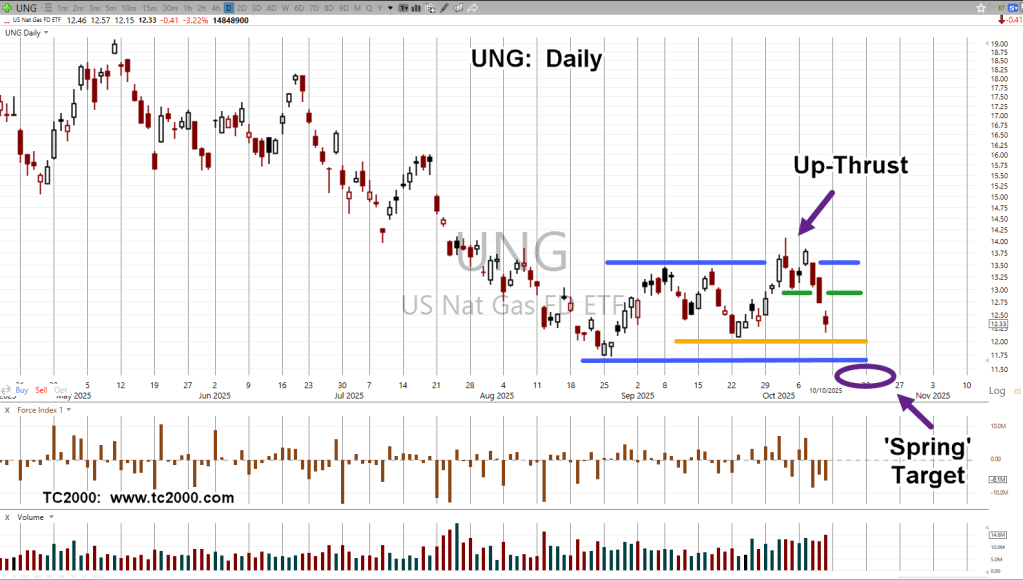
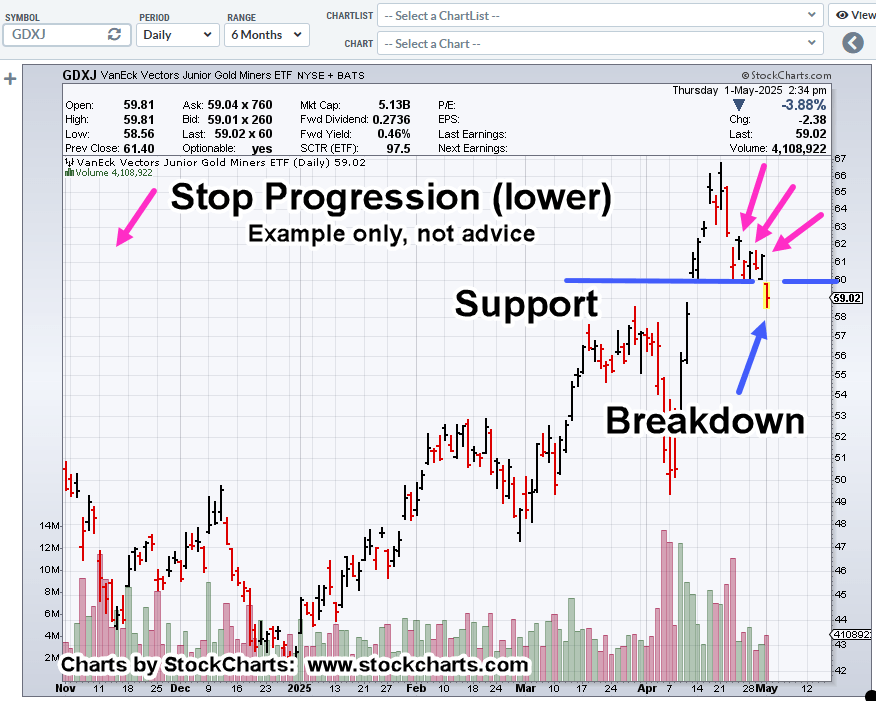
The upper blue line is resistance which price action ‘up-thrusted’ (reversed).
The green line is a minor support area.
This is where a long position was initiated (UNG-25-01). The expectation for the next day (last Friday), was for an immediate increase it price.
That didn’t happen. The long position, the only ‘long’ for this year, was exited (not advice, not a recommendation).
The orange line is another support area but the lower blue line, if UNG gets there, is the ‘spring’ set-up target.
U.S & China Nat-Gas
Last Friday’s chaos with China and tariffs, begs the question if Chinese nat-gas shipments would be used as a tit-for-tat pawn; meaning, China halts all purchases.
The short answer is no.
For all of 2025, there’ve been no shipments, link here.
With that said, if nat-gas is going to move lower to the target area shown, then something else would be the driving mechanism.
Stay Tuned
Charts by StockCharts
Note: Posts on this site are for education purposes only. They provide one firm’s insight on the markets. Not investment advice. See additional disclaimer here.
The Danger Point®, trade mark: No. 6,505,279