Recession First … Depression Next

The Last Place To Be … Real Estate
The most illiquid of all ‘assets’: Real Estate

Two quarters of negative GDP (even with cooked books) equals recession.

Next up, full-blown depression.

Some would argue (like J.B. and Dan) that we’re already in a depression … we skipped the recession part altogether.

Do not pass Go. Do not collect $200.

Anyone who thinks the Fed’s going to ‘pivot’ because the numbers are weak, does not understand (or won’t admit to) the real purpose of the entity; but I digress.

The Strategy

Way back in December of 2020, this post was released which discussed ‘Genesis 41’, specifically.

It was an intuitive assessment; we’re in a phase where corn and grain (i.e., the food supply) are potentially more important than ‘stacking‘ silver or gold.

Over the ensuing year and a half, how correct, that has proven to be.

Then, nine-months ago, was this post, presenting the ‘elephant’; a massive population decline whose repercussions would last the lifetimes of anyone reading.

Now, we have this. A report that confirms the elephant.

It’s all starting to hit the mainstream, although the language is still being couched to not cause undue panic. Good luck with that.

So, what’s next?

The Danger Point: Real Estate

While mainstream press and money managers alike struggle to figure out the obvious, we have price action itself telling us the next likely direction of the market.

During an economic downturn there are many places not to be such as semiconductors, airlines and other low margin businesses, restaurants and so on.

However, the most illiquid of all, is real estate. It does not matter how bad one wants to sell, if there is no buyer, there is no sale.

Real Estate IYR, Weekly Chart

Last week, real estate IYR, closed right at the Fibonacci 23.6% retrace as shown.

Getting closer in on the daily, it’s marked up to show the risk from a shorting perspective (not advice, not a recommendation).

Real Estate IYR, Daily Chart
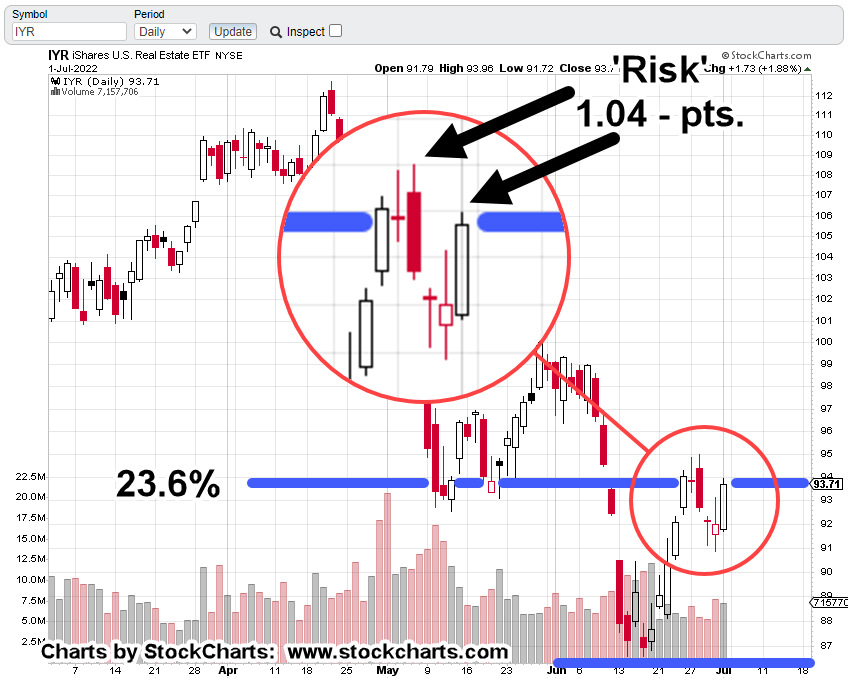
In this case, the risk on a short position is defined as the distance from last Friday’s high (IYR: 93.96) to that same week’s high of IYR: 95.0

Let’s add, Friday’s action saw IYR, retrace a Fibonacci 76.4% (the most available) of the entire move for the week.

The Summary

Amazon (AMZN), ProLogis (PLD), and Real Estate IYR, are joined at the hip.

Now the economy’s imploding, massive warehouse space is not needed.

Ditto that for employees as well.

ProLogis is already down – 31.2%, from its all-time highs set just this past April.

We’ve already shown PLD, has a nasty habit of going straight down during a market route.

Last time, PLD, crashed over – 84%, in just two months.

It’s likely to be worse, this time around.

Stay Tuned

Charts by StockCharts

Note:  Posts on this site are for education purposes only.  They provide one firm’s insight on the markets.  Not investment advice.  See additional disclaimer here.

The Danger Point®, trade mark: No. 6,505,279
Gold Miners … Downside Reversal

Wait … What?

A major gold (miner) reversal?

Is that possible?

The last update on the subject highlighted a multi-decade Fibonacci time correlation.

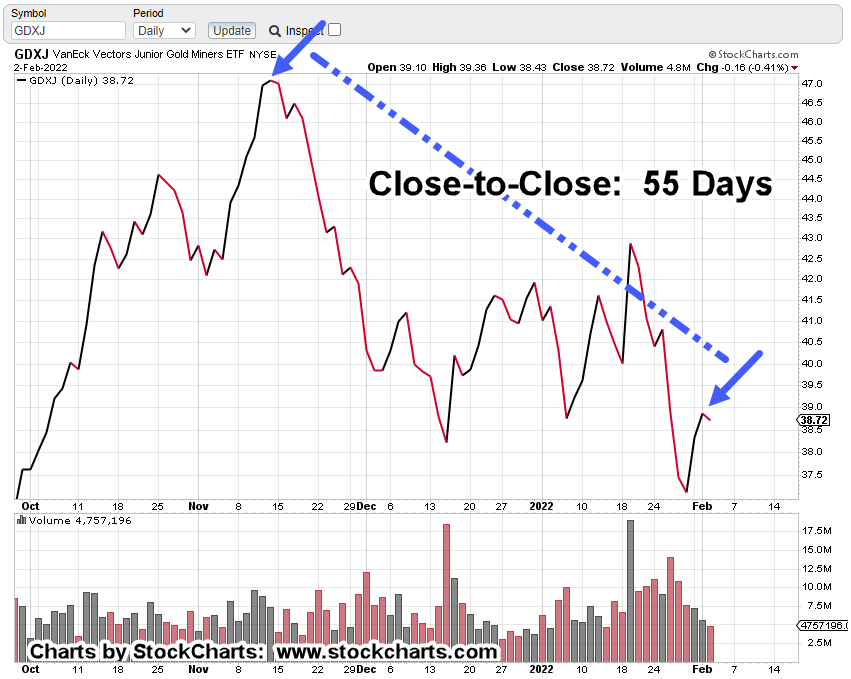
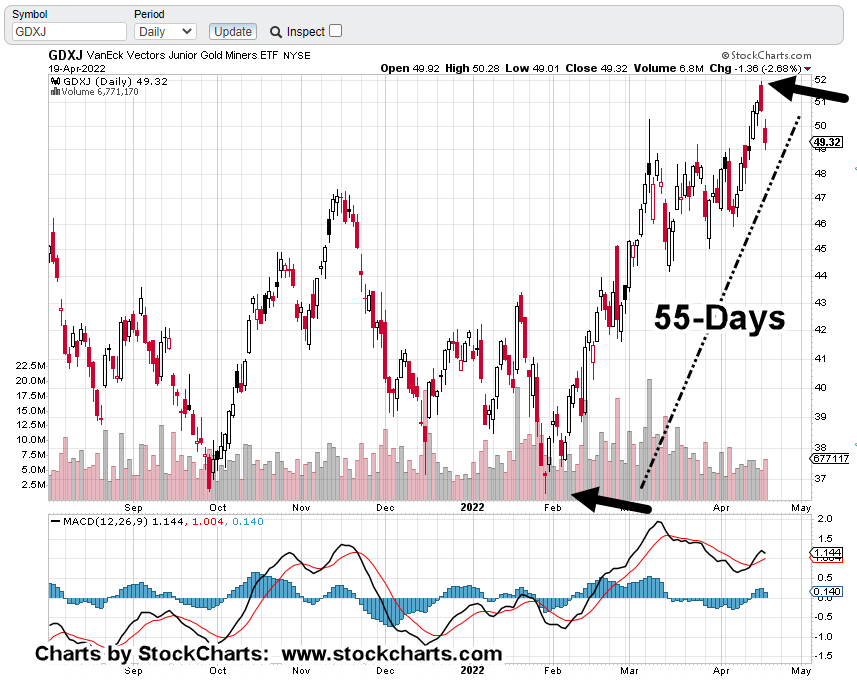
Going all the way back to the 2001 lows for gold, there’s a correlation of 21-years, 89-weeks and 55-days as it relates to the Junior Mining Index, GDXJ.

This past Monday, 55-Days from the January 28th, low, GDXJ, posted a reversal.

The chart below, is an updated version of the one presented on Thursday, the 14th.

Junior Miners, GDXJ, Daily

The bearish MACD has completed with a momentum tick to the downside. Price action reversed exactly at Fibonacci 55-Days.

Getting closer-in, the chart below shows we’re at minor support.

It’s early in today’s session about an hour after the open.

Price action’s already pushing down on the support level, posting a new daily low.

If GDXJ continues lower and decisively penetrates support, the expectation is for some kind of upward test in the next session(s).

For the Junior Gold Miners, GDXJ, we’re at the danger point.

Obvious stop levels for a short position would be yesterday’s high or Monday’s high (not advice not a recommendation).

Summary

With so many convinced gold and the miners must move higher as a result of ‘inflation’, a significant, sustained reversal would be completely unexpected.

Of course, what’s not being discussed (except in alternate media) is the intentional destruction of the food supply and the supply chain.

That’s at least a significant contributor to the rising prices.

Stay Tuned

Charts by StockCharts

Note:  Posts on this site are for education purposes only.  They provide one firm’s insight on the markets.  Not investment advice.  See additional disclaimer here.

The Danger Point®, trade mark: No. 6,505,279
Corn Train Wreck, Continues

One Way Or Another …

The food supply is, and is going to be destroyed; one way or another.

The latest in this ‘planned’ series of events, can be found here and here.

More information on the first link, is here. The initial paragraph says it all.

That second link calls the news a ‘Black Swan’ event.

Really?

It’s been known for years and reported by those who are brave (moving forward despite ridicule, threats, bank account closures), and who had insight, times like these were coming.

As a result, (i.e., since the Derecho) the commodities, specifically corn, have risen dramatically.

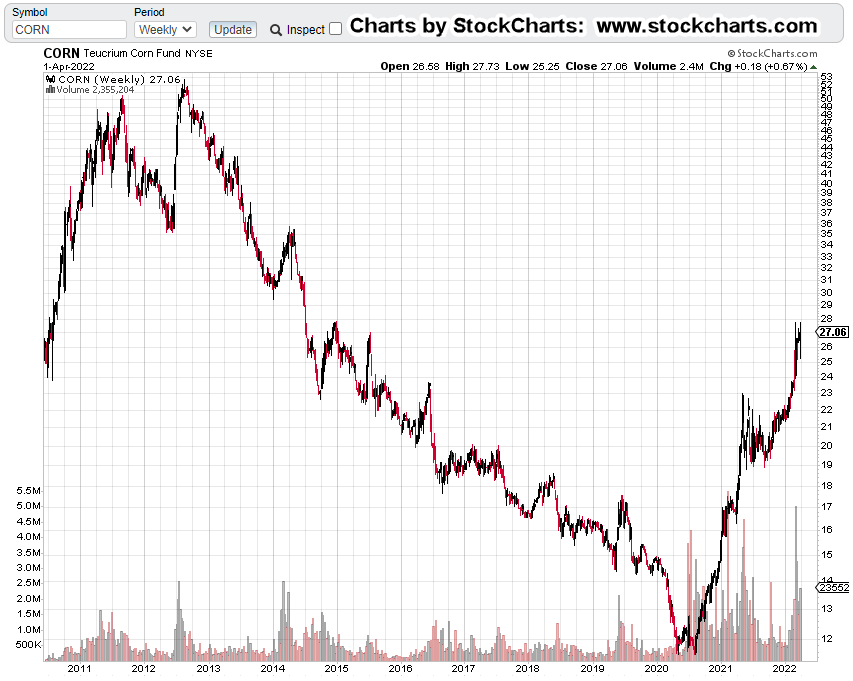
Teucrium tracking fund, CORN, Weekly

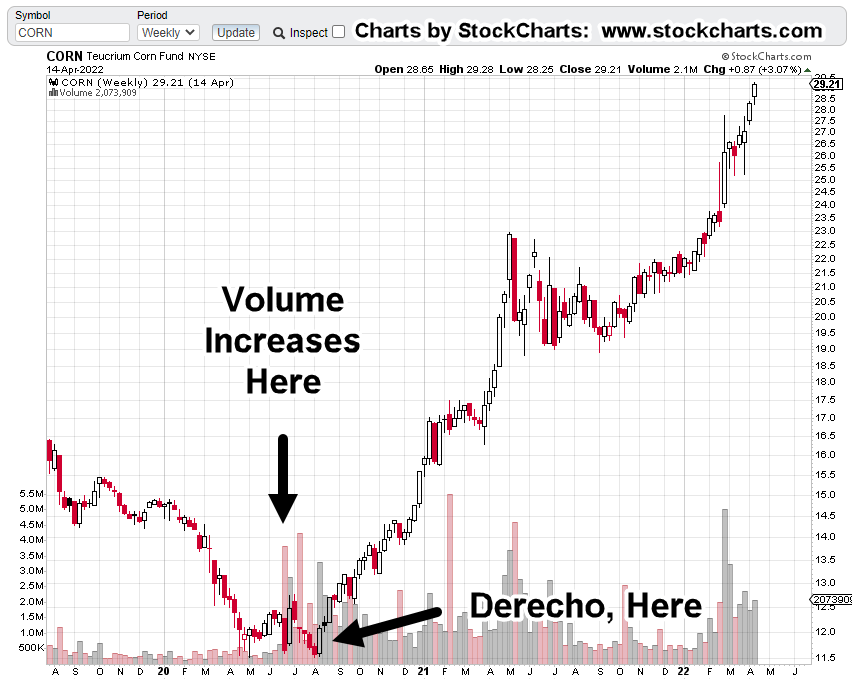
Looking and the chart, several items of note.

First: Volume picked up markedly in the fund, before the Derecho of 2020. Almost like someone knew something was about to happen … which it did.

Wyckoff said it best a century ago … those in the know, will have their actions show up on the tape.

Second: We’re currently in Fibonacci Month 21, since the Derecho. Does that mean we’ll have another market event?

Let’s see how the fertilizer news affects the futures market at the next open.

However, more specifically as posted in this update, we’re looking for some type of ‘administration’ announcement that temporally crashes the price of corn.

Third: Getting back to the chart of CORN, the right side is showing signs of potential distribution.

We’ve had the largest weekly volume, ever, during the week of March 4th.

After that, volume has remained elevated … a possible changing of hands and distribution.

Summary

Markets like to test wide high-volume print areas. There’s always a potential for that type of test in any market.

For CORN above, the high-volume area is around 23.00 – 23.50; an approximate drop of -21%, from current levels.

If we get some type of ‘export restriction’ announcement, a (temporary) 20-plus percent drop in CORN, is not unreasonable.

Stay Tuned

Charts by StockCharts

Note:  Posts on this site are for education purposes only.  They provide one firm’s insight on the markets.  Not investment advice.  See additional disclaimer here.

The Danger Point®, trade mark: No. 6,505,279

Putin’s Gold … Paradigm, Not

‘Nothing New Under The Sun’

Remember the ‘Silver Short-Squeeze‘?

How the little guy was finally going to ‘put it to the man’; forcing the SLV, ETF, to admit they don’t have enough physical silver to cover?

How did that work out?

Same as it always has … it was a non-event.

Now, we have a supposed paradigm shift the ‘world’ has yet to fully process.

Paradigm, Not

The ‘paradigm’ link above, promulgates the intended or mistaken notion, there are two sides to world events.

Sorry Charlie, operations at world government level(s) are working in how shall we say, ‘lockstep’?

Nothing is a surprise.

So it is with gold. At least it is at this juncture while always keeping in mind, anything can happen.

Gold, GLD, Weekly Close

The message of the weekly close, is straightforward.

We’re at the danger point. The location where it won’t take much to move price in either direction.

If we really are in a ‘new paradigm’, by definition, gold (GLD) must move to new highs.

If other governments world-wide are shifting to gold-backed currencies, by definition, demand will increase and move prices higher.

Higher by not just a one-day blip of 10 – 20 points or even a hundred … but thousands.

It could happen.

In the longer time frame, that may indeed be the case. However, at this point, we have something else afoot.

The Famine, Cometh

Gold has never been the same since the Derecho of 2020.

In fact, that was the pivot point for both gold and corn which are now, inversely correlated.

Here are just a few recent links concerning the food supply; here, here, here and here.

That last one … what a great way to cover the outcome of this link.

It’s a slow-motion train-wreck that’s obvious to anyone that can see.

Summary

Just like there was no ‘new economy’ during the Dot-Com bubble, there’s no ‘new paradigm’, now (not advice, not a recommendation).

The focus remains on what the price action, the market, is saying about itself.

At this juncture, GLD, is at the danger point.

The presence of huge volume during the week of March 11th, suggests a changing of hands from strong to weak.

That in turn, points probability to weak upside (if any) and more likely sideways, or down.

Stay Tuned

Charts by StockCharts

Note:  Posts on this site are for education purposes only.  They provide one firm’s insight on the markets.  Not investment advice.  See additional disclaimer here.

The Danger Point®, trade mark: No. 6,505,279

Will Corn Take A Hit ?

Oil First, Then Corn?

The ‘administration’, if you can call it that, is messing around in the food and financial markets as planned.

Well, almost.

Oil seems to be the focus at this point; virtue signaling using the SPR as the candidate du jour.

Could corn be the next target for ‘help’ such as halting all (or enough) exports to tank the price?

Remember the objective here, is to destroy production.

Anyone with two spike proteins rubbing together, should be able to see that plan (time stamp 5:35) hiding in plain sight.

We’re in full propaganda mode; hypnotizing the masses to think someone thousands of miles away is the bad guy.

Why not use that ruse to toy with the corn market as is being done with oil.

‘It’ll never happen’ … right, just like oil futures could never go negative.

If it does happen or something similar, that’s the opportunity.

CORN, Weekly Chart

The last update had the potential for a retrace and spring set-up, at the 17- 18, area on the chart.

Corn has moved higher with no major price hit, yet.

As said, it might never happen.

If it does, and soon, that support area (at this juncture) is near a Fibonacci 61.8%, retrace as shown below.

Looking at the chart, it’s also clear, CORN is at significant, long-term, resistance.

Two Ways To Trade

One is shown above, via CORN. The other is the futures market itself (not advice, not a recommendation).

CORN tracking fund provides ‘exposure’ as their documentation says. However, it does not provide ‘leverage’.

That’s what the futures market does.

Summary

If going the futures route, downside risk needs to be removed as much as possible.

One way for that to happen is an ‘announcement’, similar to the Carter grain embargo, likely to cause a huge (temporary) price collapse.

Until then … we wait.

Stay Tuned

Charts by StockCharts

Note:  Posts on this site are for education purposes only.  They provide one firm’s insight on the markets.  Not investment advice.  See additional disclaimer here.

The Danger Point®, trade mark: No. 6,505,279
Gold Reversal … Wait, What ?

Um, … Weren’t We Going To The Moon ?

One hour, and fifteen minutes after this post was released, gold and the miners topped-out.

Depending on the close for today, gold futures prices may post a weekly reversal bar.

If it happens, that’s an important nuance.

The prior reversal from all-time highs … back in early August of 2020, did not happen on weekly reversal bar or even a daily bar.

What does that mean or what could it mean?

Unlike last time where gold (GLD), hovered around its all-time highs for a couple of weeks, this time, it looks like it can’t even do that.

We’re at the danger point.

For the gold tracking fund GLD, the price to watch is Monday’s open at 184.45. Closing below that level, indicates trouble for the bulls.

Gold (GLD), Daily Chart

Twelve months of daily price action shows the build-up, to the blow-off.

Below, we have a ‘measured move’ target completed.

Then, we have a volume climax.

Changing of hands from strong to weak.

Such volume spikes typically indicate the potential for a long-term, sustained reversal.

Contrary View

This analysis isn’t contrary just to be contrary.

We’re looking for market truth. Meaning, ‘what’s the market saying about itself?’

Once that truth is found or at least probabilities identified, then it’s incorporated into a strategic plan.

Go-Forward Strategy

At this point, it’s more than obvious, food and the food supply, is literally going to be the choke-point.

As nations world-wide, scramble to secure reliable food sources, anything can happen. They can even resort to selling-off their gold reserves en-masse, to pay for the insane commodity prices.

Don’t think that can happen?

Well, oil futures couldn’t go negative either, right? Nickel couldn’t surge to record highs on the largest single-day jump ever, right?

London Metal Exchange (LME) would never cancel trades and fudge their numbers, right?

What couldn’t happen then, is likely to happen now.

There’s a chance gold will not post a weekly reversal at the end of this session (currently, 12:53 p.m., EST). If so, it holds open the probability for an upward test or series of tests in the coming week.

Stay Tuned

Charts by StockCharts

Note:  Posts on this site are for education purposes only.  They provide one firm’s insight on the markets.  Not investment advice.  See additional disclaimer here.

The Danger Point®, trade mark: No. 6,505,279

Gold, Plays Its Hand

What’s Left To Drive It Higher ?

It all lined up for gold in the form of international tensions, military on the move, then outright invasion.

The ‘safe haven’ metal of course, launched higher.

It’s what happened next that’s the important part.

Steadfast on this site, is the premise, It’s not inflation … at least not the kind in the form of credit creation with persistent rising wages and prices.

The charts themselves show the retrace from the lows of March 8th, 2021, to now (today), is a counter trend move.

Unless today’s reversal bar is penetrated to the up-side, the main trend is either sideways or down.

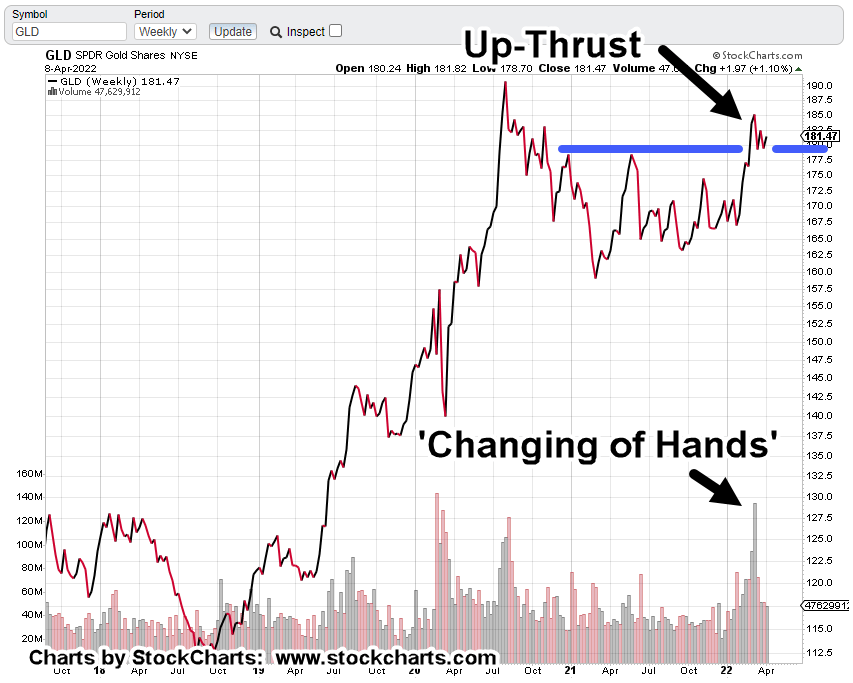
Gold (GLD) Weekly:

Re-stating again, Elliott Wave is not used as the main analysis tool.

However, it can’t be denied that GLD, looks as if it just completed an ‘a-b-c’ correction with both ‘a’ and ‘c’ waves of equal length (vertical blue lines are equal).

It’s a near textbook example.

Adding to the potential reversal case is the up-thrust position as shown.

For the bearish assessment to change to bullish … this resistance area will need to be penetrated and successfully tested.

Anything can happen … so we’ll see what happens next.

Enter, The Famine

Here is a link that only requires the first 50-seconds of one’s time. The presenter is an offensive character to say the least.

However, this site searches out as many sources as possible; sifting through the trash to find kernels of truth is a necessary requirement.

With that said, restricting the food supply results in a compliant population.

That’s most likely the next area(s) of focus for our benevolent controlling oligarchs.

Summary:

This is gold’s chance for a continued breakout to the upside if it’s really a bull market.

If it fails and reverses, we know the main trend is down and potentially leading to some kind of deflationary impulse.

Stay Tuned

Charts by StockCharts

Note:  Posts on this site are for education purposes only.  They provide one firm’s insight on the markets.  Not investment advice.  See additional disclaimer here.

The Danger Point®, trade mark: No. 6,505,279

Natural Gas First: Who’s Next ?

Is it Corn?

So, it begins.

This link to an article where lawmakers (using that term loosely) are attempting to limit the export of natural gas.

We’ve already discussed the likelihood of some type of corn or grain embargo as prices continue higher.

Now, we have a similar (limit export) event but in the energy sector.

Recall, the statement from that prior (corn) post:

“What we’re looking for here, is some kind of Jimmy Carter type stunt where corn exports are halted in the name of ‘national security’ or some such thing.”

And this, from the same post:

“Of course, if that happens, corn is likely to crash (like it did last time) if only temporarily.”

So, let’s take a look at what happened to natural gas (UNG), when our lawmaking geniuses proposed to limit exports.

Daily Chart Natural Gas, UNG:

So, when this type of announcement comes out, the market takes a major hit … just like it’s forecast to do if we get something similar in corn (not advice, not a recommendation).

Now, if the overall long-term objective, is to wipe-out the food supply, wouldn’t you want some kind of dry run to make sure markets are going to respond as expected?

So, let’s try natural gas first, shall we?

Remember that with corn, it will (if it happens) be different.

Because of the elevated fertilizer prices, a forced lowering of the corn market may be all that’s needed to make sure very little-to-no corn gets planted … and Voila!

For a reminder on just what exactly we’re dealing with here, please reference this link.

Moving on to other markets, we have some housekeeping in the gold mining sector.

Junior Miners, GDXJ:

As stated in the pre-market update yesterday, the finger was on the sell trigger.

After the first hour of trade, it was obvious higher prices were in the offing.

Not willing to wait through a correction to a higher retrace level, the short position was closed-out (not advice, not a recommendation).

The table below summarizes the entire round-trip. It should be somewhat self-explanatory.

A hypothetical $10,000 was used as the starting amount. Any additions to the position used margin.

The end result as shown, approximately, +21%, gain.

Stay Tuned

Charts by StockCharts

Note:  Posts on this site are for education purposes only.  They provide one firm’s insight on the markets.  Not investment advice.  See additional disclaimer here.

The Danger Point®, trade mark: No. 6,505,279
Junior Miners, Stall-Out

First To Reverse

For the evening/overnight session, both gold and the S&P futures have opened lower.

The S&P is down 50-pts, nearly 1.10% (at about 8:15 p.m. Eastern) and already penetrating the last session’s low.

The number of technical factors concerning gold, the miners and especially the Junior Miners GDXJ, is significant.

We’ll cover just a few in this update.

Junior Miners, GDXJ: Daily

The un-marked daily chart shows GDXJ oscillating but in a general downward trend:

The next chart shows price action posted a reversal bar right at Fibonacci 23.6%, for the entire move; from the breakout highs in mid-November ’21, to the lows on January 28th, this year.

A ‘Fib’ retrace of 23.6%, is rare and if it holds, indicates significant weakness.

The next two charts present a case for why this shallow retrace may indeed hold and thus, indicate the start of the next leg lower.

On a print basis, it’s been a Fibonacci 55 (+1) days from the GDXJ print high on November 12th, 2021, to the high posted today (2/2/22).

The next chart shows that November 12th, 2021 was also the closing high of the breakout set-up.

The Important Part:

Yesterday, was the closing high of GDXJ (so far) and that makes it a perfect Fibonacci 55-Days, from peak-to-peak.

The last update on the miners showed significant down-pressure at support levels, unlike previous visits to the area.

Looks like we’ve had the rally that was forecast; that rally may now be fading.

“It’s reasonable to expect an attempt to rally in the coming week … but with this much down force, a successful rally is not the high-probability outcome.”

Gold Could Hold

Already discussed, is the idea, the actual price of gold may hold steady or even go higher and yet the mining sector collapses.

As Dan from i-Allegedly posts in this report, Italian wine makers are having a hard time getting corks for their bottles. That’s right, corks !!!

Does anyone really think a massive mining outfit is going to be able to source all they need to continue operations without interruption?

Let’s not even get started with the ‘sustainability’ corporate failure already baked into the cake 🙂

‘Stackers’ … We’ve Got You Covered

That’s right, if the last report was not enough, we now have this: Fertilizer plant on fire … imagine that.

Right in time for spring planting.

But wait, there’s more; look at the fire chief’s comments. How many “33s” can you count?

For we wrestle not

“For we wrestle not against flesh and blood, but against principalities, against powers, against the rulers of the darkness of this world, against spiritual wickedness in high places.”

Sorry for those who think it’s all a ‘myth‘. I’m with Good Patriot on this one (time stamp 17:09); that we’re in a battle surpassing all that’s come, since 33 AD.

Gold & Silver

Hard assets: Good to have for sure (ammunition, seeds and egg-laying hens may be better) … but if we’re really in a similar event to Genesis 41, that means the corn and grain come first, then gold and silver.

Summary:

This post started with the S&P down about -0.80% and it’s now down -1.10%, posting a new daily low.

Gold is down slightly, holding steady but that’s already been discussed above.

Remaining short the sector via JDST-22-01 (not advice not a recommendation).

Position size on JDST-22-01, has been increased. More on that in the next report.

Stay Tuned

Charts by StockCharts

Note:  Posts on this site are for education purposes only.  They provide one firm’s insight on the markets.  Not investment advice.  See additional disclaimer here.

The Danger Point®, trade mark: No. 6,505,279

Corn … The Famine Set-Up

Waiting For Mr. Potato

It’s hitting the mainstream.

Famine ahead; more specifically, a crisis in corn.

This article just out from ZeroHedge, has the upcoming crop in an almost guaranteed rout before it even gets planted.

Ever since the ‘Derecho‘, corn has been thought (on this site) to be the potential catalyst for market and economic collapse.

The first time that idea was presented was on August 20th, 2020, in this post.

It’s important to note that way back, 17-months ago, it was already understood to be a ‘controlled demolition’.

Crazy conspiracy back then. Looks like a fact, now.

Which brings us to the charts.

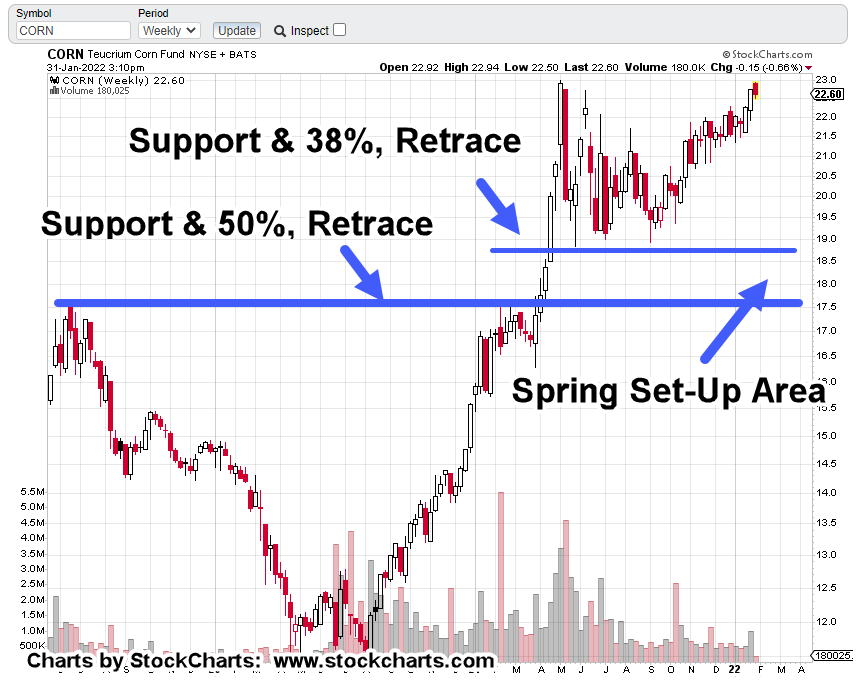
CORN: Weekly Chart

As usual, we’ll start with the unmarked chart: Teucrium tracking fund CORN:

It looks like price action is about to break to the upside.

The chart below is marked with some key levels: Support and 38%, and 50% retrace:

For long-time visitors to this site, you can almost write the script for what comes next.

What can make corn drop far enough to get itself below established support and into the ‘spring set-up’ area?

Doing so, may present a medium, to long-term, trade opportunity.

Enter, The Potato

It’s probably not “if”, but “when”.

What we’re looking for here, is some kind of Jimmy Carter type stunt where corn exports are halted in the name of ‘national security’ or some such thing.

More detail on the Carter grain embargo at this link … scroll down to No. 12

Of course, if that happens, corn is likely to crash (like it did last time) if only temporarily.

More Is Less

A corn embargo means more corn for us, right?

Probably, wrong.

Remember, fertilizer prices are sky-high.

Elevated corn prices (like now) might just cover the cost for the farmers … maybe.

A corn crash in the commodities would likely mean even less corn gets planted … maybe none at all.

Enter, The ‘Bought And Paid For’

It may be that easy (as above), or get complicated because a major consumer of U.S. exported corn, is China.

Exports to China over the last year have literally gone off the scale. Add to that, China is the number two holder of U.S. Debt.

So, one can already see where this may be going.

After the initial fake panic where the politicians realize there’s a crisis (that part being real), which they themselves created, they’ll likely pontificate about halting exports for just long enough, to have farmers throw in the towel with no spring planting.

After all of that, and let’s not forget special investigative news coverage about ‘how all this happened’; blame it on climate change and then keep everything the same.

Exports continue (to China) as much as possible and the U.S. citizens starve … literally.

By the way, go to time stamp 24:04, at this link and look at the clouds in the upper right. For those awake, it’s clear; right angle, cross-hatch pattern.

Right angles are not a natural phenomenon. Whatever climate change there is, is the one being created.

When Corn Takes The Dive

If or when corn takes a hit, price action itself will define the correct trade action.

So, let’s be ready and not surprised, if we see corn in chaos.

Stay Tuned

Charts by StockCharts

Note:  Posts on this site are for education purposes only.  They provide one firm’s insight on the markets.  Not investment advice.  See additional disclaimer here.

The Danger Point®, trade mark: No. 6,505,279