The Panic of 2023

Parallels To, The Panic of 1907

Pick up almost any trading book like Reminiscences of a Stock Operator, and you’ll find, the big money was made on the downside.

In Livermore’s case from ‘Reminiscences’, he saw a big crash coming, went short in a big way, and was then squeezed out of his positions during market rallies in 1906.

The short trades were too early; he blew up his account.

Undaunted, he took drastic measures to raise capital (hawked his car), got back in, shorted, and cleared over $1-milllion in profits near the bottom on October 24th, 1907.

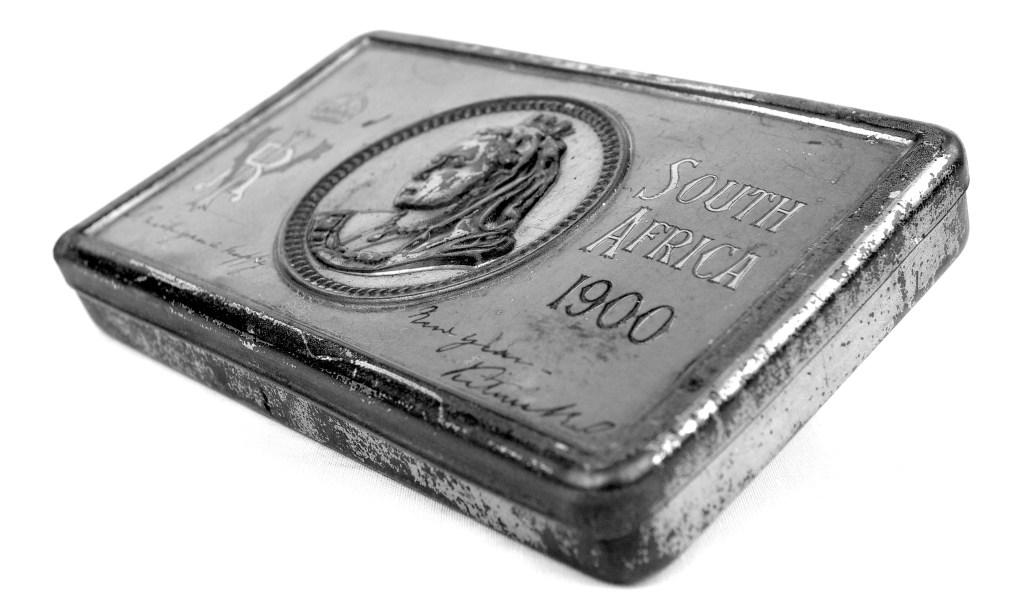
The Ukraine War & The Boer War

As spectacular as his profits were, for us that might not be the most important part.

Take a look at the list below, paraphrased from Livermore’s account of The Boer War and overall economic conditions; see if it doesn’t match up to today.

The British were just coming off the Boer war, having spent hundreds of billions (in today’s Pound-Sterling), and money was tight.

There was significant wealth destruction world-wide.

The San Fransico earthquake of 1906, was causing economic disruption and the need for even more cash.

Note: As reported here, seismic activity is picking up. We’ve just had a major quake (again) in California.

There were plenty of warnings of an impending collapse but as Livermore puts it, the masses paid no heed as they were more concerned with baseball.

Fabrication & Fact

There’s some scuttlebutt, The Panic of 1907, was a fabricated event, used to usher in fractional reserve banking.

Is this all starting to sound familiar?

Now, we have the potential of Neo Feudalism, going right along with Universal Basic Income and Digital Currency.

That should be enough intro to get us to the chart at hand, Real Estate IYR, but first, this just out, on MarketWatch:

Worst Year, Since 2008.

It’s already the worst since 2008, and as Jerimiah Babe puts it, ‘we haven’t even got started’.

Reference time stamp 12:07, in the link and see if it does not match exactly with Livermore’s observations.

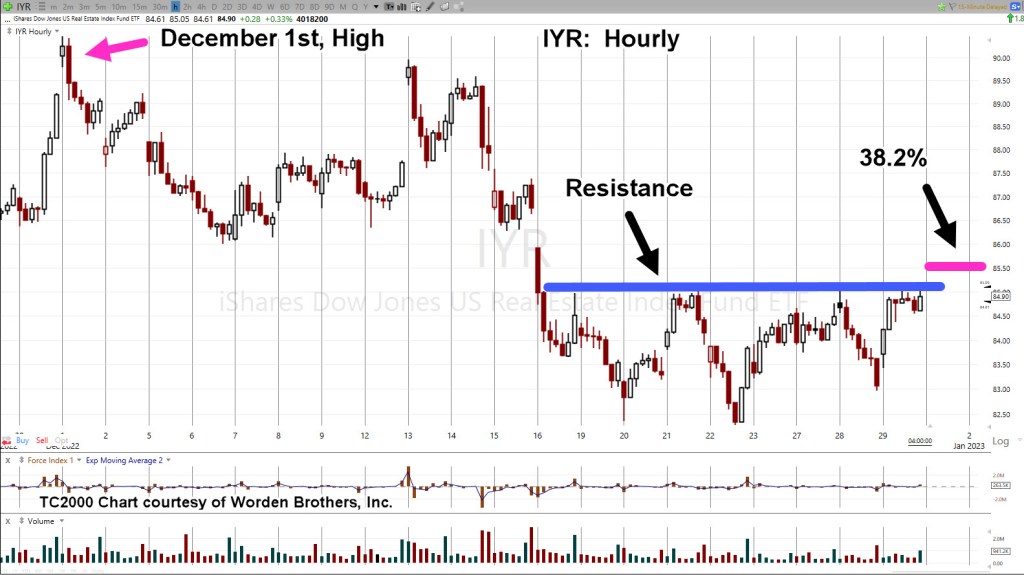
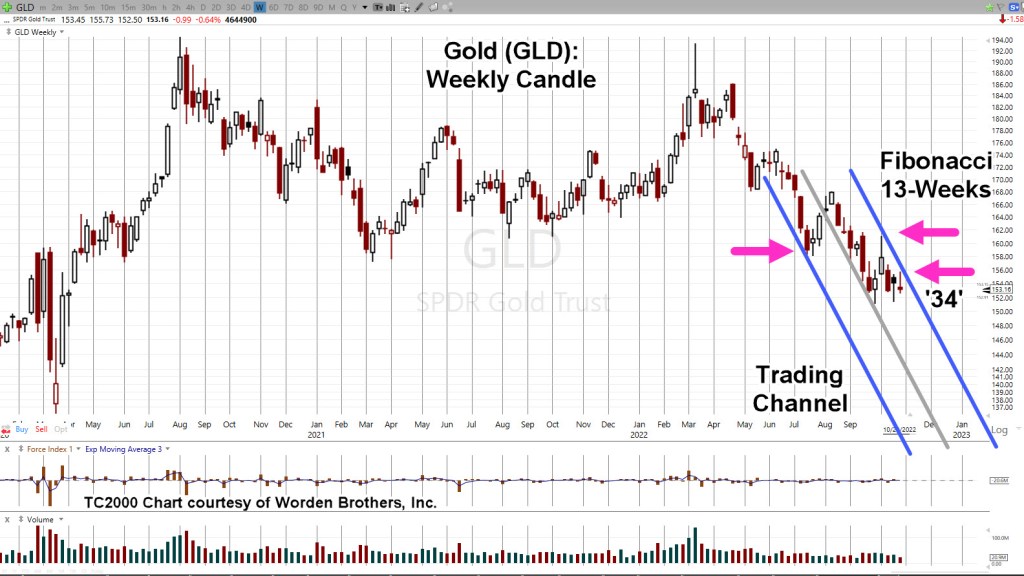
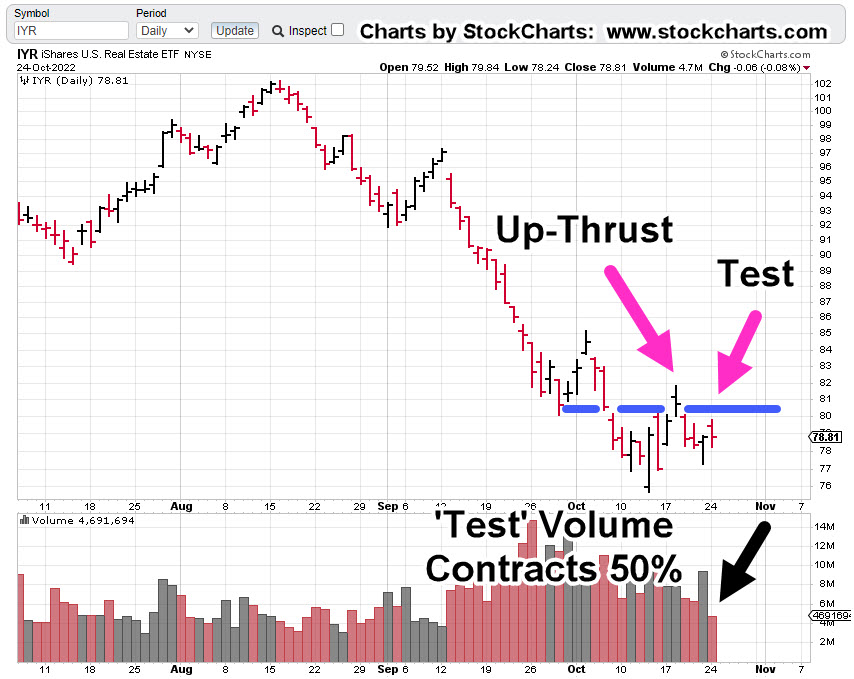
All of which brings us to real estate.

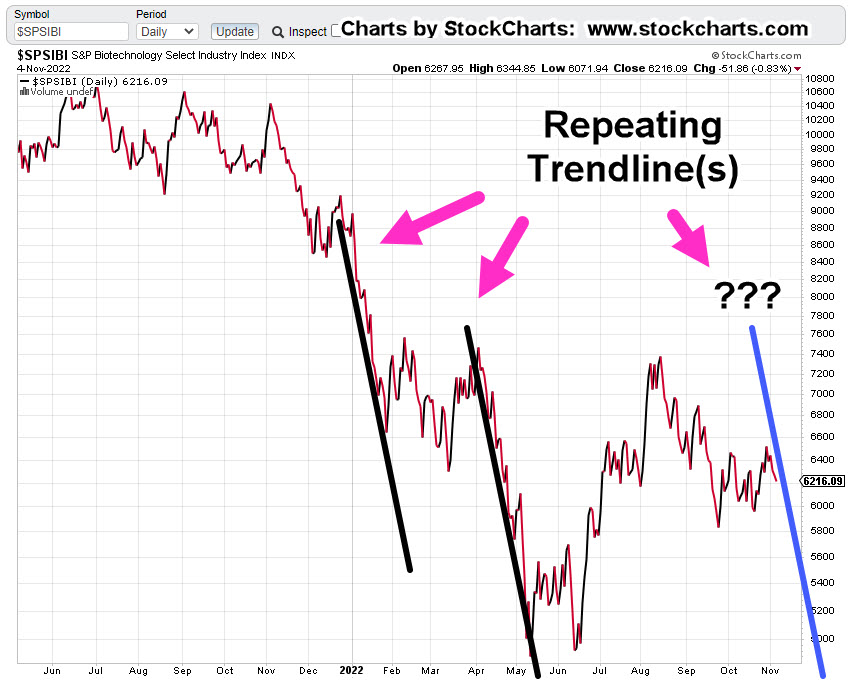
Real Estate IYR Weekly, Close

The chart shows the most conservative (modestly declining) trading channel

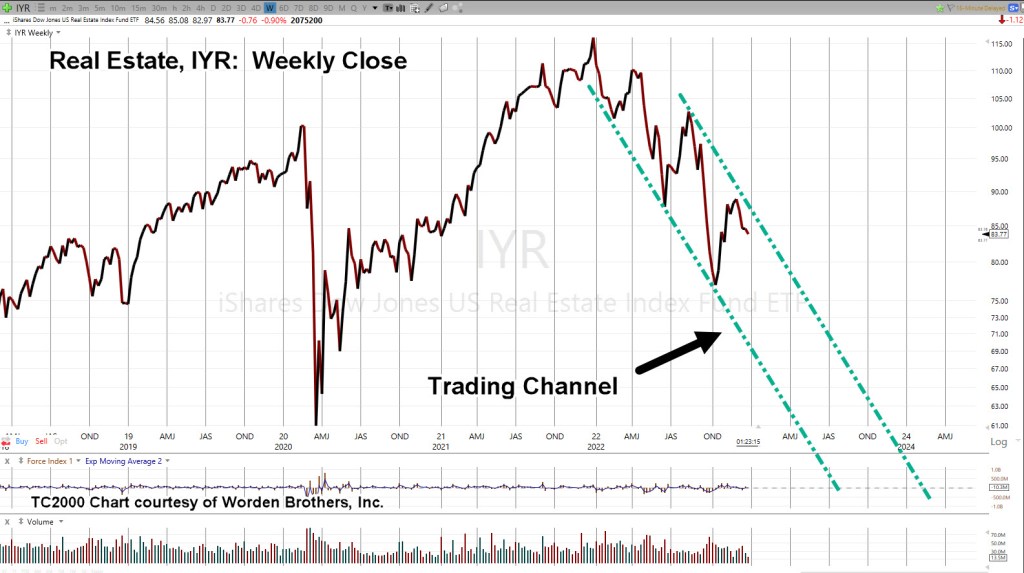
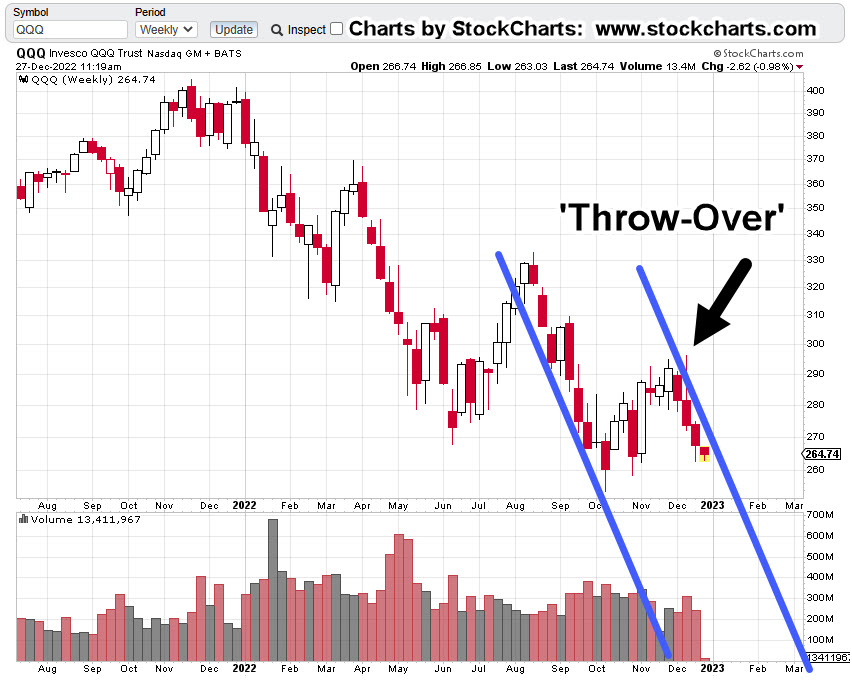
The next chart, is where it gets scary.

The second (potential) channel is declining at approximately -62%, on an annualized basis.

Weekly timeframes are presented here on purpose.

Doing so, gets us away from the everyday, every blip, analysis and looks at things strategically. It’s obvious, barring some kind of intervention, real estate’s in trouble.

The January of No Effect

It’s well known, stocks tend to rise in the first weeks of January. Tax loss selling is over and there’s typically some type of ‘relief’.

Don’t count on it this time (not advice, not a recommendation).

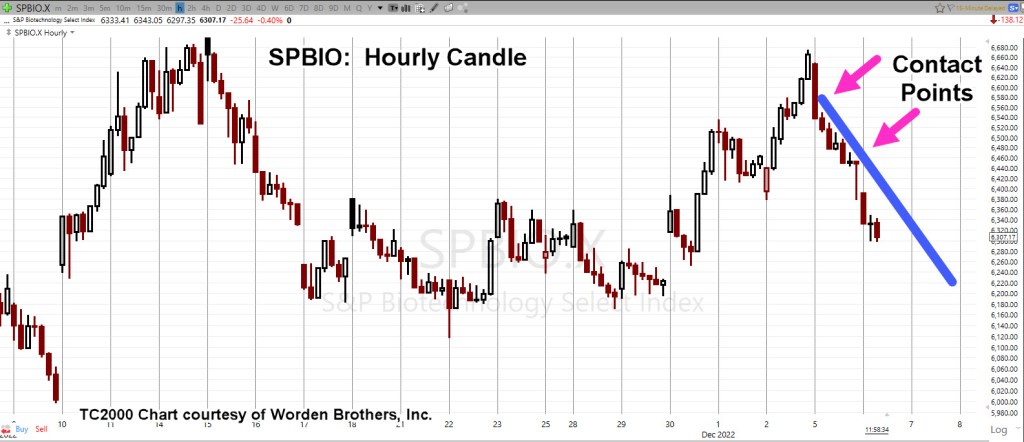
Even as this post is being created, IYR, is pivoting lower and possibly confirming the more aggressive right-side trendline (second chart, above).

Summary

We’ll end with more paraphrase from Livermore’s account of the panic.

He describes being in Ed Harding’s office (his broker), telling him that ‘now is the time’, ‘today is the day’. All the while, stocks were drifting, everything was quiet.

Livermore said to Harding:

‘The longer that stocks delayed, the bigger the break will be when it comes.’

Let’s see if that applies to us, exactly 100-years later (Reminiscences, published in 1923).

Stay Tuned

Charts by StockCharts

Note:  Posts on this site are for education purposes only.  They provide one firm’s insight on the markets.  Not investment advice.  See additional disclaimer here.

The Danger Point®, trade mark: No. 6,505,279

Real Estate … Day ’21’

Posts, Next Session

The next session will be a Fibonacci 21 days, from the IYR, intermediate high, printed on December 1st.

From that high, price action has declined, then bottomed, and is now in a retrace.

That retrace/test may have competed today with a weak attempt at new daily highs or we could see something more definitive tomorrow.

From a data release (i.e., ‘catalyst’) standpoint, the Chicago PMI, is scheduled for 9:45 a.m., EST.

Let’s go to the daily chart of IYR.

Real Estate IYR, Daily

The intermediate high is marked, and we see price action decline and now testing resistance underside.

If we go further down to the hourly chart … that’s where it gets interesting.

Real Estate IYR, Hourly

It’s clear we have a well-defined resistance that’s just below a 38.2%, retrace level.

Obviously, a push above this level and then reversal, is the definition of a Wyckoff ‘up-thrust’.

Summary

Fibonacci timeframes are somewhat approximate. If everybody’s waiting for it, it’s not likely to happen.

That’s why some Fibonacci reversal dates are either a day early or a day late … just to keep everyone guessing.

With that in mind, the test may have completed today, or it could tomorrow (Day 21), or the first trading day of 2023.

In an ideal scenario, we get a blip higher (above resistance) at the open tomorrow that’s quickly retraced (not advice, not a recommendation).

Stay Tuned

Charts by StockCharts

Note:  Posts on this site are for education purposes only.  They provide one firm’s insight on the markets.  Not investment advice.  See additional disclaimer here.

The Danger Point®, trade mark: No. 6,505,279

Trend & Channel

Get In … Get Out

There tends to be a period of consolidation and organized chaos, before price action enters and exhibits channel behavior.

Of course, the problem from a trading perspective, be able to wait through the chaos getting to the set-up and that’s no small feat.

Several of the major indices are in a channel right now. Those are (ETF symbol) SPY, QQQ, IYR and IWM.

We’ll discuss the Q’s farther down but first, this just out, on ZeroHedge, concerning the overall economic conditions.

That is, we’re already in full scale economic collapse and they have the data to prove it.

As incredible as it may be, there are still sectors of the population that believe, ‘the consumer is strong’.

A big wake-up call is coming for them. Oh wait, is that a telephone ringing off in the distance 🙂

The media lies appear to be crumbling at an exponential rate; there’s no guarantee it’ll all hold together into late January, or mid-February as presented only yesterday.

From a Nasdaq (QQQ), technology sector perspective, we have the following.

NASDAQ QQQ, Weekly

The Q’s began the week with a lower open and within the range of the prior week.

It’s a subtle clue the direction remains down and the market’s not volatile … just yet.

Next up, is the channel

It has the right ‘look’.

Moving in closer; the right-side trend line verification (hits).

There are no fewer than four weekly hits (including today) that verify the right side. The attempted push out of the channel is identified as the ‘Throw-Over’.

Attempted breakouts (and failures) are common market behaviors. We see that price action quickly got itself back into the channel.

Get In … Get Out

At this juncture, price action remains in the channel.

A short position (via QID, or equivalent) is a viable choice for the trader/speculator (not advice, not a recommendation).

For the reasons described above (the collapse), we appear to still be in the early stages of the down channel.

Obvious discretionary exit points for a short trade would be left side contact of the channel i.e., the ‘demand’ side or a decisive right-side breakout i.e., the ‘supply’ side (not advice, not a recommendation).

Summary

In a separate market, Netflix (NFLX), may have hit the right side of its own tend line as well.

It seems to be all happening very quietly.

Stay Tuned

Charts by StockCharts

Note:  Posts on this site are for education purposes only.  They provide one firm’s insight on the markets.  Not investment advice.  See additional disclaimer here.

The Danger Point®, trade mark: No. 6,505,279

Biotech … Bear Flag, Break ?

The Character Has Changed

It’s been more than frustrating attempting to short biotech.

So far this year there’ve been thirteen attempts; some successful, but most were not.

None of the attempts have captured the ‘big move’ that’s overdue for this market.

The last post essentially gave up on biotech, but it seems like the potential just won’t go away.

This time, over the past two days, the character of price action has changed.

Re-capping briefly, biotech SPBIO, has been in a bear flag for over two months.

During that time, it’s been oscillating and coiling; looking for a breakout to the downside.

As of this post, there’s no breakout yet but we’re heading to the bottom of the flag, with a change of character.

SPBIO, Weekly

It’s important to note, the pattern below, is unique.

The sector data goes way back to April of 2009. During its trading history SPBIO, has never posted a bear flag with a two-plus month duration.

An expanded version of the chart is below:

Now, comes the interesting part.

Going to the hourly, we have a trend line and a breakdown of intermediate support in the SPBIO 6,390-area.

This is the change of character.

SPBIO, Hourly

Note that we’re deep within the bear flag and at the right edge of price action.

We’ve got the trendline as shown.

Price action during yesterday’s session, contacted that line six consecutive times.

As of this post (12:50 p.m., EST), price continues lower.

Summary

So, is this ‘the big one’?

The correct answer is that it’s unknown.

What we do know however, just by looking at what the market is saying about itself; there’s been a change, at least in the past two days.

Price action’s breaking through support levels and heading for the bear flag lows in the vicinity of SPBIO 6,125.

A reasonable expectation is for some kind of a bounce if or when it hits this area.

Positioning

Not advice, not a recommendation.

DRV-22-06: Closed***

Gain + 5.61%

Re-opened biotech SPBIO Short (not advice, not a recommendation)

LABD-22-14***

Entry@ 18.905*** Stop @ 18.39***

Note: Positions may be increased, decreased, entered, or exited at any time.

***, Indicates change

Stay Tuned

Charts by StockCharts

Note:  Posts on this site are for education purposes only.  They provide one firm’s insight on the markets.  Not investment advice.  See additional disclaimer here.

The Danger Point®, trade mark: No. 6,505,279

The Dominos Fall …

Cash Crunch, Layoffs & Bankruptcy

So, here we are.

Crypto FTX implodes, Amazon to lay-off 10,000, Health system(s) in cash crunch, solar farm Toucan Energy, goes bankrupt.

But wait, it gets better; Pfizer and Moderna, are going to investigate themselves.

All of this, just within the past few days.

At this point, it should be clear to all paying attention, we’re accelerating to the downside … at least in economic terms.

Market Disconnect

Yet, the markets appear to never-mind … going about their (manipulated) business as if nothing’s happening.

Walmart has even announced they are going to buy-back their own stock to the tune of $20-Billion.

Maybe, they’ll do it. Maybe, they won’t.

They fully admit (in the press release), the buy-back announcement, was to make sure the earnings report was ‘well received’.

The Next ‘Shoe’

Those of us ‘awake’, are collectively attempting to plan and position for the next shoe to drop.

We’ve got the usual suspects such as real estate and biotech; however, this link to The Burning Platform, could provide more potential catalysts.

Either way, disconnected market or not, one has the feeling it’s just a matter of time.

Life After The ‘Short Squeeze’

‘The shorts were carried out on stretchers’.

Well, yes and no.

As said in this update, the historic short-squeeze, while damaging to account P/L, was a huge public service.

This chart confirms the majority of short-positions have evaporated. Meaning, the potential fuel for relentless upside (from those shorts), is no longer there.

That fact is being mirrored in price action as we speak.

As covered above, two markets are hanging by a thread: biotech and real estate.

Both are bubbles on a world-wide scale, but biotech is the one that may affect all others.

Biotech SPBIO, Inverse LABD

As this post was being created, biotech leveraged inverse fund LABD, has just printed (as of 12:40 p.m., EST) outside-up; also known as a ‘key reversal’.

The daily chart is below.

LABD, Daily

To make it an official outside up, price action will need to close above yesterday’s close (LABD: 17.87).

We’ve already shown that SPBIO, price action has formed a huge bear flag lasting more than eight weeks.

Action from the past three days can be considered a Wyckoff up-thrust as well.

Now, we have a potential key reversal.

If so, this market may be in serious downside trouble.

Positions: (courtesy only, not advice).

Yesterday, JDST-22-05, was exited at 9.0341, with a loss of – 1.45%, so that focus (and capital) could be directed to biotech, SPBIO and inverse LABD (not advice, not a recommendation).

LABD-22-10:

Entry @ 18.1398, 17.565***, 17.65***: Stop @ 16.29***

***, Indicates change

Stay Tuned

Charts by StockCharts

Note:  Posts on this site are for education purposes only.  They provide one firm’s insight on the markets.  Not investment advice.  See additional disclaimer here.

The Danger Point®, trade mark: No. 6,505,279

The Market Set-Up … This Week

What To Watch … Biotech, Gold, Real Estate, Tesla

Biotech:

There’re a lot of moving parts to biotech and it’s like a game of chicken.

Is there going to be another ‘planned’ event pulled out of the bag that requires ‘protection’ or will this side (and this one) win-out before that happens?

Price action’s always the final arbiter and right now, it’s positing lower.

Gold:

Gold (GLD) ‘blipped’ higher on Friday and the usual suspects are out touting the hyperinflation narrative.

Owning (some) precious metals seems to be a good thing.

However, the public constantly knee-jerks into this sector and is absolutely rabid in their behavior (i.e., silver stockpiles are running out!!!).

It suggests at least, there’s something else afoot.

Prechter published in the early 2000’s, Central Banks, are followers, not leaders. The fact they are buying gold at this point, may be a contrary indicator.

Talk about going against the herd. 🙂

Over and again, it’s the boring (does not generate ‘clicks’) food supply first, then gold and silver (not advice, not a recommendation).

Real Estate:

What can be said?

It’s the largest manufactured bubble in world history and it has already popped.

Thinking it’s all going to sort itself out in a year or two is delusional. We’ve probably got decades of bear market.

Tesla:

Anyone with an anode of research capability, knows the whole EV premise, is based on a falsehood.

However, that fact is probably not what’s going to bring Tesla (and the rest of the market) down.

Let’s stop for a moment and consider the above link which has been available for nearly four-years.

How many views? Just 9,824 (as of this post)

That equates to only 0.003% of the U.S. population.

As the global supply chains implode, getting parts and having stable infrastructure (i.e., electricity) will probably be the defining factor.

Now, on to the charts.

Biotech SPBIO, Daily Close

The following sessions will let us know if we’re at the right edge of the downtrend line.

We’ve already had an up-thrust reversal and a test of that reversal. last Friday was lower … probabilities point down.

Gold GLD, Daily

Looking at the chart on the strategic, longer term, Friday’s blip is hardly noticeable. We’ve already presented how this could be a minor up-thrust (reversal) in itself.

To keep the upside intact, price action must remain and continue above current levels.

Real Estate IYR, Daily

Real estate may be working its way into an up-thrust condition. As shown, Fibonacci Day 21 from the October 13th, low is this coming Thursday, the 10th.

According to the Economic Calendar there are several potential catalysts that may push the price above resistance (temporarily).

Tesla TSLA, Weekly

The short-term look has been presented here.

Longer term downside potential is disconcerting.

Major support near the 25-level.

Summary

When we look at last Friday’s action (table below), it’s clear SPBIO, was not part of the upside party.

Of course, we won’t know if it’s’ the downside leader until subsequent sessions.

In the meantime, the market positioning remains unchanged.

Positions, Market Stance (courtesy only, not advice).

LABD-22-09:

Special Note:

This sector and leveraged inverse LABD are highly volatile. Character of the market can change at any time.

LABD may be exited without notice.

Entry @ 19.88, 19.71, 21.23, 21.65 Stop @ 19.41

Note: Positions may be increased, decreased, entered, or exited at any time.

***, Indicates change

Stay Tuned

Charts by StockCharts

Note:  Posts on this site are for education purposes only.  They provide one firm’s insight on the markets.  Not investment advice.  See additional disclaimer here.

The Danger Point®, trade mark: No. 6,505,279

The Market Set-Up … This Week

What To Watch … Bonds, Gold, Real Estate, Tesla

Bonds:

Last Friday, the bond reversal posted a shallow retrace.

We’re looking for upside follow-through at the next session.

Gold:

If gold (GLD) closes below 154.67, on Monday, it will be seven consecutive down months.

Momentum has slowed to a potential inflection point.

Real Estate:

If bonds move higher, real estate may follow. We have potential targets and Fibonacci timeframes.

Tesla:

This update, said to watch if/when TLSA, broke below support.

It did just that during the following week but now, it’s hesitating.

As a result, we have a Wyckoff ‘spring’ set-up.

Now, on to the charts.

Long Bond TLT, 30-minute

We’re drilling down to the 30-minute.

The blue line is Fibonacci 23.6%. Price action (at this point) shows the beginning of a move higher from that level.

Moving decisively higher at the next session, puts the terminating wedge into play, shown here.

If we get a wedge breakout, then we have a measured move target in the vicinity of TLT, 115.00.

Gold (GLD) Weekly Chart

A close below 154.67, on Monday, would put GLD, at seven consecutive down months.

GLD, has never closed lower seven consecutive months; not since inception, on 11/18/04.

Gold remains in a down-channel that’s a Fibonacci 13-Weeks wide.

Last week’s move helped to re-confirm the channel.

That action is itself, a Fibonacci 34-Weeks from the ‘changing of hands‘ high, during week-ending, 3/11/22.

However, momentum of price action has slowed.

If there’s going to be a break to the upside, this would be the place; otherwise, watch for continued GLD downside.

Real Estate IYR, Weekly

If bonds continue their upside reversal with rates lower, we can expect real estate IYR, to have some type of ‘dead cat’ bounce.

If so, how long and how high.

An infinite number of scenarios are possible. However, the chart of IYR, shows what to expect for two of those possibilities.

Real Estate IYR, Weekly

The uptrend (blue line) has been decisively broken. What has not yet happened, is a ‘test’ of that break.

Shown are potential tests; Week 8 (from 10/14/22, lows), at Fibonacci 38%, and Week 13, at 50%.

Between ‘Week 8’ and ‘Week 13’, is the December Fed meeting … a possible catalyst.

Tesla (TSLA) Weekly

This one seems a bit far-fetched but here it is, anyway.

If bonds rally, the rest of the market may also rally; that could include our chief cook and bottle washer, Tesla.

Price action bounced at support and penetrated it several times before printing outside-up on the weekly (twice).

By definition, it’s a Wyckoff spring set-up.

A spring tends to go straight into an up-thrust; a repeating pattern, shown on the chart at around TSLA, 315.

Set-ups can also fail … so, we’ll be watching this one closely.

Stay Tuned

Charts by StockCharts

Note:  Posts on this site are for education purposes only.  They provide one firm’s insight on the markets.  Not investment advice.  See additional disclaimer here.

The Danger Point®, trade mark: No. 6,505,279

Bond Reversal Targets

Trade or Strategic

It’s either a short-term trade or a strategic reversal.

On the strategic reversal side is this just out from ZeroHedge.

‘Inflation’ may have peaked; where have we heard that before.

However, the charts presented in that link, do show we’re at an extreme.

If we look at the TLT, price action itself, which is impulsive down, we’ll go with the short-term first (not advice, not a recommendation).

With that, Friday may have been the ‘test’ from our capitulation model.

The weekly chart of bonds TLT, shows the anticipated up-tick in MACD, as well as the measured move target from the terminating wedge.

Long Bond, TLT, Weekly

Note, the wedge has not (yet) broken to the upside … we’re still at The Danger Point®, where the trade could fail.

If we look at the daily chart, probabilities point higher.

Long Bond, TLT, Daily

If this past Friday was the ‘test’ of the move, the retrace was a very weak Fibonacci 23.6%.

A new daily high in the next session(s), will help to confirm we’re headed higher.

Positions, Market Stance (courtesy only, not advice).

TMF-22-01:

Entry @ 6.705, 7.166***, Stop @ 6.68

***, Indicates change

Note: Positions may be increased, decreased, entered, or exited at any time.

Summary

If bonds continue to move higher, with rates heading lower, what’s going to happen to real estate, IYR ?

The wheels of the real estate crash have already been set in motion. If bonds rise, rates fall and IYR moves higher, there are specific targets to watch for short opportunities.

We’ll discuss those targets and more, in the next ‘The Market Set-Up … This Week’

Stay Tuned

Charts by StockCharts

Note:  Posts on this site are for education purposes only.  They provide one firm’s insight on the markets.  Not investment advice.  See additional disclaimer here.

The Danger Point®, trade mark: No. 6,505,279

Early Session Update

The Market Is Always Right

If the market says no, the answer is no.

As of 9:55 a.m., EST that’s what it’s saying with the real estate short via DRV (DRV-22-05).

Today’s early rally stops out the position (not advice, not a recommendation), and the trade is closed.

Loss was approximately – 4.87%.

Not good but manageable.

On the flip side is the bond market.

Looks like we have the ‘island gap’ reversal discussed in prior updates.

A trade has been opened in leveraged bond fund TMF as TMF-22-01 (not advice, not a recommendation).

Charts to follow

Stay Tuned

Charts by StockCharts

Note:  Posts on this site are for education purposes only.  They provide one firm’s insight on the markets.  Not investment advice.  See additional disclaimer here.

The Danger Point®, trade mark: No. 6,505,279

After The Close …

Inflection Point

This time, it’s the volume that’s important.

Most of the major indices finished higher today except for the miners, real estate and biotech.

The early session update said IYR, price action may be in a test of its up-thrust (reversal) from October 18th.

If that’s a valid assessment and it was a test, the volume is important.

Whether it’s an up-thrust or a spring, when the set-up gets tested, the volume gives additional clues.

What we’re looking for is when price action comes back to test, volume contracts.

If that happens, it means (with good probability) there’s no commitment to sustain prices at the test level.

Real Estate IYR, Daily

The real estate situation may be about to get interesting.

Volume contraction is near-textbook.

This is one of the rare times, there’s a high probability expectation; that is, IYR price action resumes its downtrend (not advice, not a recommendation).

Stay Tuned

Charts by StockCharts

Note:  Posts on this site are for education purposes only.  They provide one firm’s insight on the markets.  Not investment advice.  See additional disclaimer here.

The Danger Point®, trade mark: No. 6,505,279