Note: Posts on this site are for education purposes only. They provide one firm’s insight on the markets. Not investment advice. See additional disclaimer here.
Note: Posts on this site are for education purposes only. They provide one firm’s insight on the markets. Not investment advice. See additional disclaimer here.
Sales down, earnings down, car prices down, demand collapsing and yet, KMX, goes higher.
Frist off, let’s address the ‘clown show’ that bandies about ‘crash’ this, and ‘crash’ that … ad infinitum.
After you’ve said crash fifteen, thirty times or more on your YouTube channel, nobody’s listening when it really happens.
How about we all (myself included) take a cue from the late Dr. Martin Zweig as seen here, (time stamp 6:40) where he’s reluctant to say ‘crash’ even when it’s on the eve of Black Monday 1987.
Now, back to our update.
CarMax … Strategy
So, let’s review the CarMax situation from a calm but focused perspective.
Strategically, KMX has met the price target identified last October (link here), and has apparently reversed.
The ‘Dead Cat’ Has Bounced
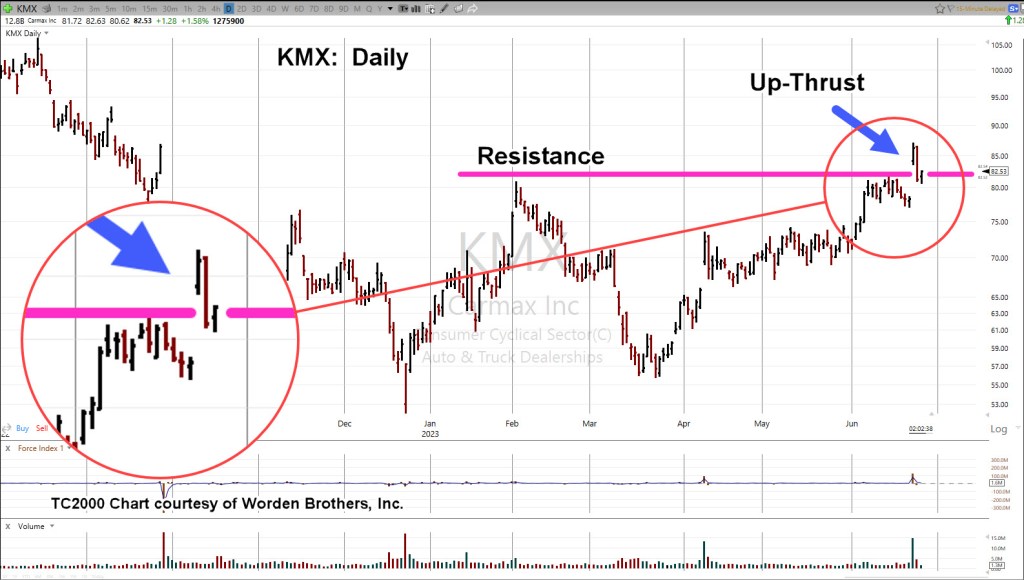
So, was last Friday’s earnings release high of 87.06, close enough to the ’85-area’ as forecasted?
“As the magenta arrow shows, there could be small blip up to resistance in the 85-area before potentially rolling over into a descent that projects to the 4.00, level.”
It took over eight months to get back to the ’85-level’.
What happens next?
Fundamental Forces
It’s been the premise of this site, we’re at the beginning stages of the largest financial, social, and population collapse ever seen (not advice, not a recommendation).
From a CarMax perspective, we have this just out yesterday.
Car lots are overflowing and we’re playing musical chairs with inventory to make it look like something’s happening.
Next, we have a Ford employee writing in, to Jeremiah Babe, saying the Electrical Vehicle Plant is a “ghost town”.
What does that ‘clean energy’ ghost town mean for silver demand? Ah, but I digress. 🙂
We’re most likely just getting started. For a snapshot into what may come our way, take a look at this.
Now, on to the chart
CarMax (KMX) Quarterly Bar
The original chart from October 2022, is repeated below.
Now, the update.
CarMax, KMX, Daily Bar
When looking at the daily, we see we’re in Wyckoff Up-Thrust (reversal) condition.
We’re at The Danger Point®
Just so we’re not one-sided, here’s a bullish forecast for KMX (not advice, not a recommendation).
At this juncture, there’re no plans to go short (not advice, not a recommendation) … although it may not be a bad spot considering all the forces lining up.
An obvious stop level (for a short) would be last Friday’s high of KMX 87.06 (not advice, not a recommendation).
Note: Posts on this site are for education purposes only. They provide one firm’s insight on the markets. Not investment advice. See additional disclaimer here.
Gold’s reversal or potential for reversal, has already been covered here, here and here.
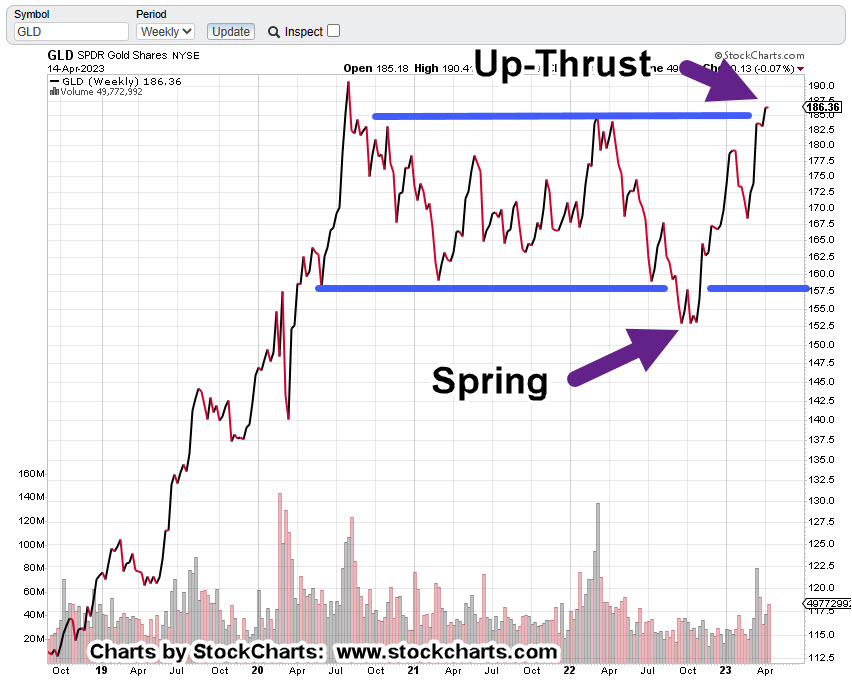
We’re going to focus on the Junior Miners GDXJ but start first, with an updated chart of gold (GLD).
Gold GLD, Weekly Close
This is how it looked back on April 15th.
As of the close yesterday, we have this:
It’s arguable GLD, is now below the resistance line (completing the Spring-to-Up-Thrust) but that’s not the most important part from a trading standpoint.
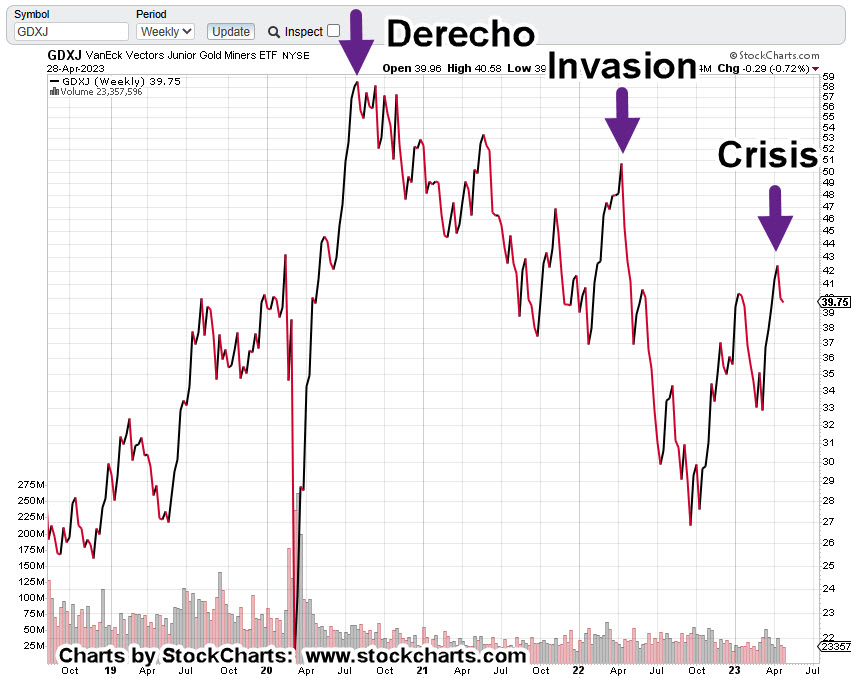
When looking at the Junior Mining Index GDXJ, there’s an ominous pattern.
Junior Miners GDXJ, Weekly Close
Each extreme peak over the last three-years has been labeled; the Derecho of 2020, the so-called Ukraine ‘invasion’, and now, the banking crisis.
Note: The SVB bank failure was on March 10th. There was a ‘knee-jerk’ reaction by the public into gold and related components … that peak appears to have stalled at the location shown.
What’s going on is obvious; it’s a bear market.
Each major peak, lower than the last.
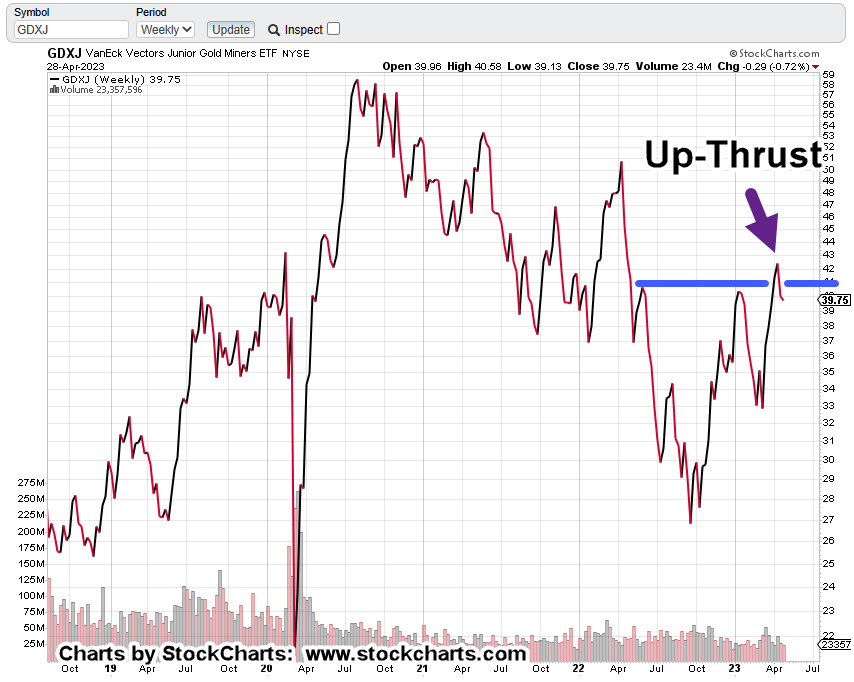
Now, the interesting part.
The Junior Miners are in Wycoff Up-Thrust condition.
In this case, price action’s solidly below the resistance line.
Looking at the daily (not shown), there may have been a ‘test’ of resistance this past week for a move higher; if so, it failed and GDXJ closed slightly lower.
Summary & Positioning
So, here we are: The market (SPY) has rallied over the past week, giving the illusion that all is well.
However, it too is now in up-thrust (reversal) position.
For my business accounts, it looks like being short the miners at this juncture is lower risk than being short biotech (not advice, not a recommendation).
Typical short vehicles that could be used (not a recommendation) are DUST and JDST.
As always, anything can happen. If the markets ‘implode’, they might be closed for any number of days or weeks.
Note: Posts on this site are for education purposes only. They provide one firm’s insight on the markets. Not investment advice. See additional disclaimer here.
Note: Posts on this site are for education purposes only. They provide one firm’s insight on the markets. Not investment advice. See additional disclaimer here.
There are nine other supplemental data points for the economic mayhem, collapse, collapse-in-progress scenario; they are listed at the end of this post.
For now, we’re talking about real estate and specifically the proxy for the sector, IYR.
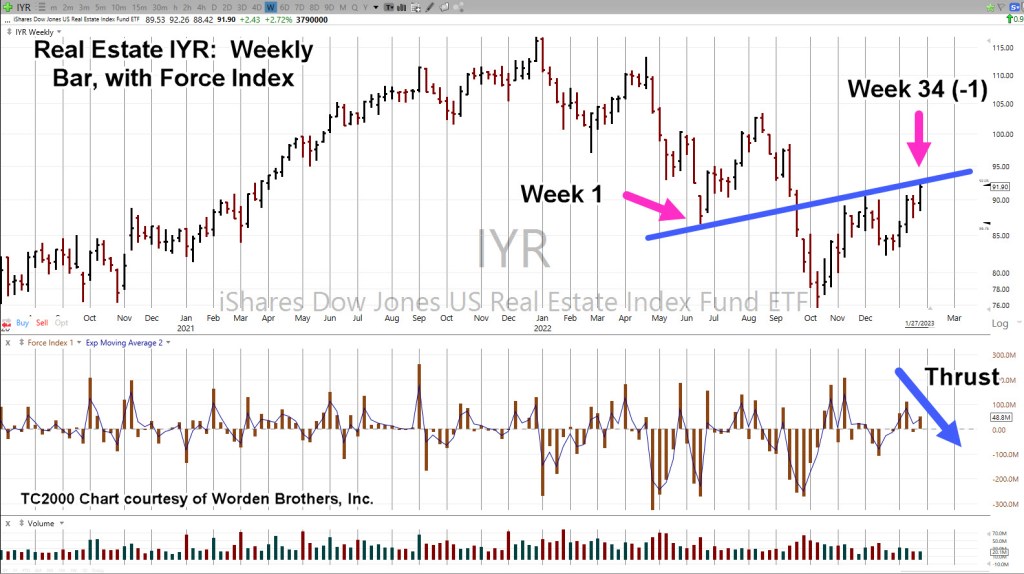
Real Estate IYR, Weekly
As stated in the last post, we’re going to follow-up with a potential IYR, downside reversal by covering three more technical points; Fibonacci time correlation, thrust energy and trading channel.
First up: Last week completed a Fibonacci 34 (-1 week) time frame that may result in a reversal into a trading channel (shown on second chart).
Upward force (Thrust Index) declined significantly over the prior upward push during the week of 1/13/23.
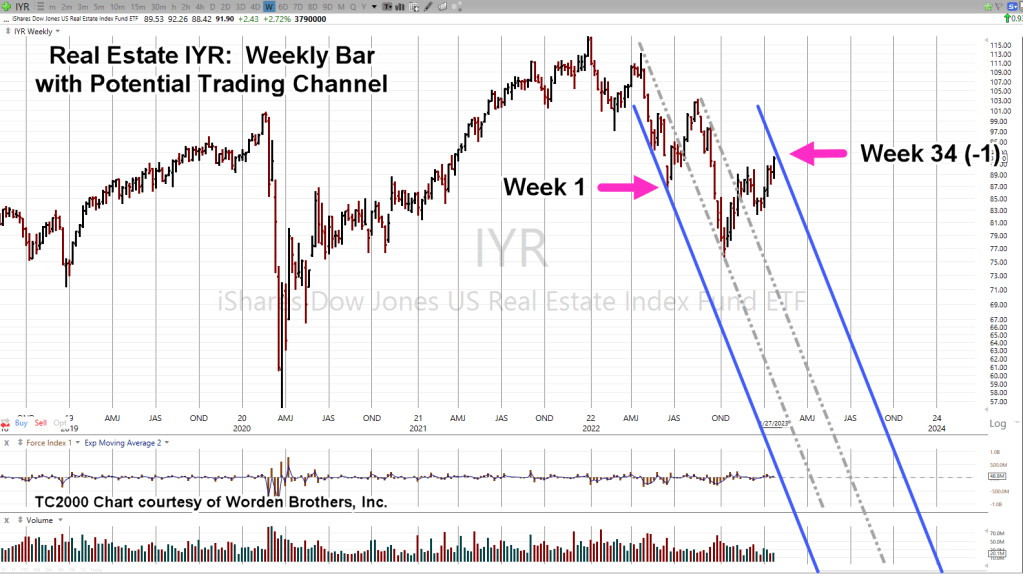
The weekly chart has been compressed and trading channel lines added.
Internal trendlines are printed as grey dashed lines.
As shown, we’re at ‘Week 34 (-1)’.
If this market’s in reversal and adhering to a Fibonacci time sequence, we could see an immediate reversal or another minor high next week to make it an even 34 or go one additional week to make it 34 (+1) weeks.
Either way, we’re at The Danger Point®
The 1929 – 1932 Trading Channel(s)
Here’s a bit of insight you’ll not find anywhere else.
Research and data gathered by my firm, has shown markets tend toreverse just before, during, or just after a Holiday Week.
In our case below, The 1929, all time high was 379.61, posted on September 4th; the Tuesday following the Labor Day Weekend.
The final low and subsequent reversal was 41.81, posted on July7th 1932; the Thursday following the July 4th Holiday:
There are at least three main trading channels in effect for the entire (nearly) three year down move.
Trading channels are an old and repeating characteristic of the markets.
Real Estate Re-Cap
The all-time high in real estate IYR, was 116.89, posted on December 31, 2021, the Friday before the New Year’s Weekend.
Since then, there have been several trading channels in effect; at this juncture, we may have yet another.
With the data links provided at the beginning and the links at the end of this post, sustained price action to the downside is more probable (not advice, not a recommendation).
This coming week is likely to be quite interesting as the Fed continues on its path of price and demand destruction.
Note: Posts on this site are for education purposes only. They provide one firm’s insight on the markets. Not investment advice. See additional disclaimer here.
The Danger Point®, trade mark: No. 6,505,279
Addendum
Congratulations on reading this far. You must be serious about your work. Supporting data for the bearish case is below.
First, we’ll review oil; tomorrow, we’ll look at gold.
From an intuitive standpoint, you can almost feel it.
The oil and gas sector has launched to unsustainable highs.
Behemoths like Exxon (XOM) with its 63,000 employees have gone from below $30/share to above $110/share, an increase over 280%, in just two years.
In the history of the equity, going all the way back to 1984, that’s never happened.
Even in 1987, before the crash, XOM was up for the two-year period, a paltry 108%, by comparison.
Now, data is coming in nearly by the day about collapsing demand, layoffs accelerating, and inventories piling up.
The latest from Steven Van Metre, at time stamp 4:25, discusses just how fast the downdraft is, and will be.
Important Note:
Before we leave the Van Metre link above, at time stamp 8:50, the assertion is made of what the Fed will do when slower growth data comes in. i.e., interest rates will be halted or lowered.
Nassim Talib called this kind of thinking “Normalcy Bias”.
The opinion of this site is, it’s a trap. Thinking what happened last time, will happen this time.
Let’s mentally bookmark this post and come back six-months from now to see what happened.
We’re in uncharted territory and other agendas are at work.
Like ‘bread and circuses’, the ‘pivot’ discussion is a distraction … keeping the proletariat placated.
Demand Collapse
We’ve got demand collapsing on a daily basis right in front of our faces and yet, it’s a big mystery (to some).
What’s not known, is how the general population will react to undeniable truth when it finally hits, en masse.
We have a good hint of what’s in store as reported by Jerimiah Babe during the first minute of this report.
Moving on to the Oil & Gas Sector.
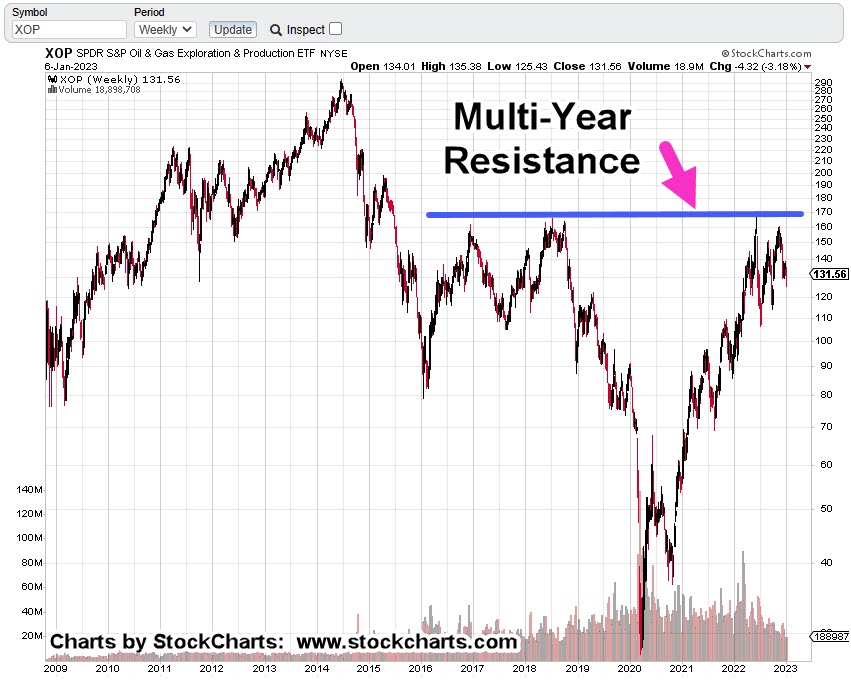
Oil & Gas XOP, Weekly
The weekly chart shows the multi-year resistance area that was tested (and rejected) back in mid-June, last year.
The next chart shows we also have a terminating wedge.
Price action has come back to the lower boundary; suggesting a breakdown is a probability.
If we get a breakdown, measured move support is identified at approximately -47%, below current levels.
Strategy & Trading
Obviously, the charts paint a bearish picture.
Over the past week, XOP was covered here and here.
The first link discussed how price action was very close to making a new daily high. That happened the next session (Friday) and indeed, it had Wyckoff ‘spring’ characteristics.
Price action moved higher and closed higher for the day, but it did not post a new weekly high … keeping the bearish case on the table.
A popular leveraged inverse fund is DRIP (not advice, not a recommendation).
At The Close
As this post comes to a close, a quick check on ZeroHedge turns up this: ‘Tipping Point‘
We’ve jumped over ‘recession’ and have gone straight into crisis and depression.
Note: Posts on this site are for education purposes only. They provide one firm’s insight on the markets. Not investment advice. See additional disclaimer here.
According to this link, it’s not only higher taxes, but retirement accounts being hi-jacked through rule changes.
‘The bulk of the wealth of the American people.’
Not to be outdone, the IRS will increase penalties for under and overpayment of taxes as reported by Fox Business via Jerimiah Babe (time stamp 22:16).
At least it’s nice to know, implementation of the ‘$600’ rule will be saved until next year. 🙂
So, we have the context for the year 2023; i.e., wealth destruction, asset confiscation, fines and fees.
It’s a straightforward plan on ‘their’ part.
What’s also straightforward as reported by Babe, a large number of Americans don’t even know what’s going on let alone be willing to take action.
Then, The Elephant
Let’s not forget the ‘elephant’ that’s likely to be the biggest driver for 2023.
We see that elephant every day now and sometimes multiple times a day. It’s starting to reach the fringes of the mainstream with articles like this one.
Scroll down to The List … It’s No. 2
That elephant and its subsequent lack of demand (less population, fewer buyers) as a result, will likely affect real estate in a big way … for decades to come (not advice, not a recommendation).
The last update showed the weekly trading channels in IYR. The next chart goes further out to the monthly and identifies a Fibonacci sequence.
Real Estate IYR, Monthly
So far, we’ve had IYR on the daily (link here), the weekly (link here), and now the monthly, below.
Major inflection points on the monthly have occurred at Fibonacci timeframes.
Original Forecast, October
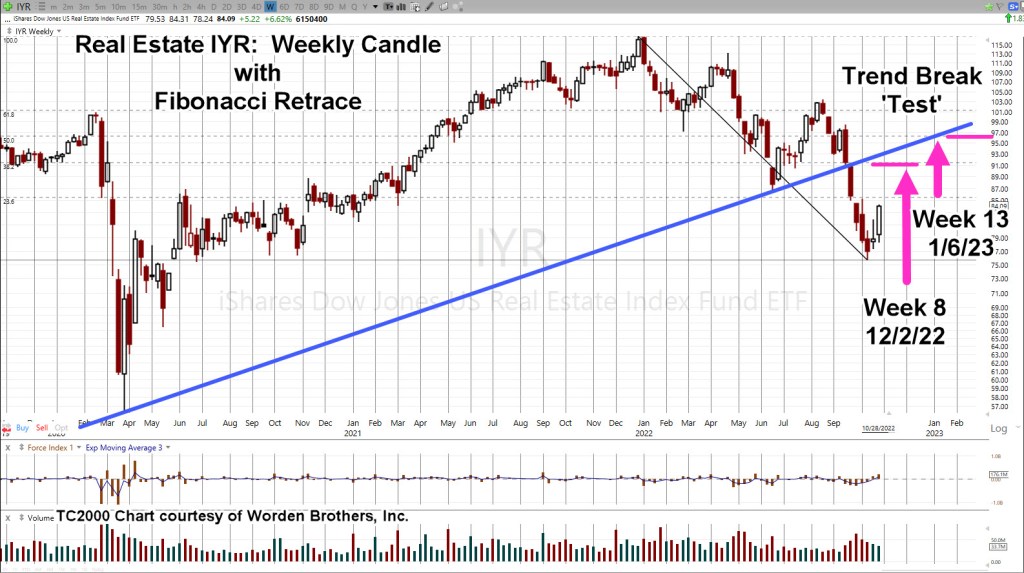
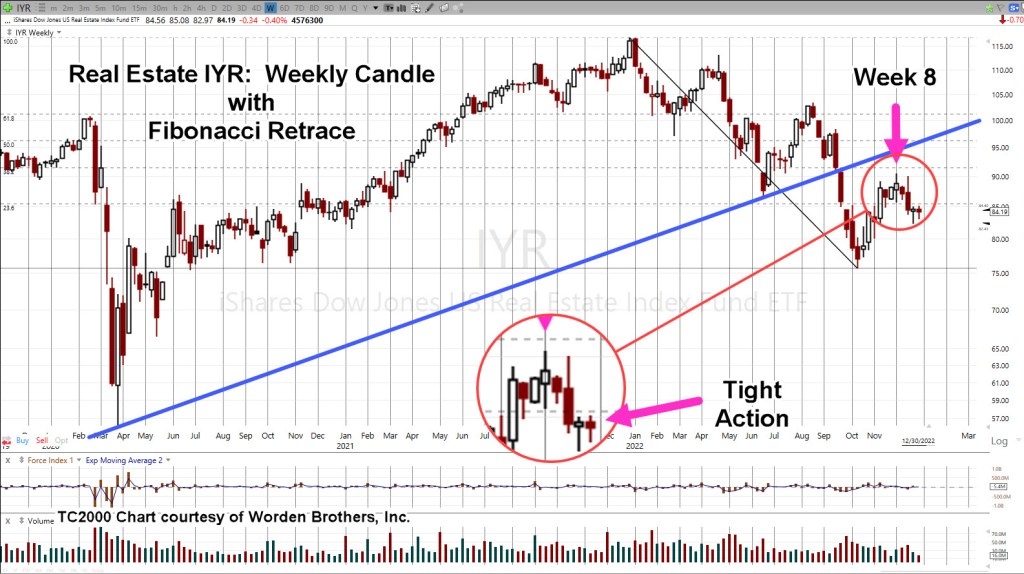
The analysis of the current set-up started way back in late October. Using a weekly chart, a potential Fibonacci sequence was identified that ultimately proved correct.
Real estate IYR, had its print high during Fibonacci Week 8, as shown below in the original forecast.
The next chart shows where we are now, again on the weekly timeframe.
Real Estate IYR, Weekly
Original Analysis & Forecast
The updated chart shows the subsequent price action.
Real estate IYR, has pivoted lower and posted tight price action over the past two weeks. Tight action typically precedes a breakout or directional move.
Summary
Anything can happen in the markets.
Even though a good analysis has been presented to indicate further downside for IYR, this Tuesday’s action will let us know for sure.
Typical vehicles to go short the sector are leveraged inverse funds DRV (-3X) and SRS (-2X) or to short the IYR directly (not advice, not a recommendation).
Note: Posts on this site are for education purposes only. They provide one firm’s insight on the markets. Not investment advice. See additional disclaimer here.
Pick up almost any trading book like Reminiscences of a Stock Operator, and you’ll find, the big money was made on the downside.
In Livermore’s case from ‘Reminiscences’, he saw a big crash coming, went short in a big way, and was then squeezed out of his positions during market rallies in 1906.
The short trades were too early; he blew up his account.
Undaunted, he took drastic measures to raise capital (hawked his car), got back in, shorted, and cleared over $1-milllion in profits near the bottom on October 24th, 1907.
The Ukraine War & The Boer War
As spectacular as his profits were, for us that might not be the most important part.
Take a look at the list below, paraphrased from Livermore’s account of The Boer War and overall economic conditions; see if it doesn’t match up to today.
The British were just coming off the Boer war, having spent hundreds of billions (in today’s Pound-Sterling), and money was tight.
There was significant wealth destruction world-wide.
The San Fransico earthquake of 1906, was causing economic disruption and the need for even more cash.
Note: As reported here, seismic activity is picking up. We’ve just had a major quake (again) in California.
There were plenty of warnings of an impending collapse but as Livermore puts it, the masses paid no heed as they were more concerned with baseball.
Fabrication & Fact
There’s some scuttlebutt, The Panic of 1907, was a fabricated event, used to usher in fractional reserve banking.
Is this all starting to sound familiar?
Now, we have the potential of Neo Feudalism, going right along with Universal Basic Income and Digital Currency.
That should be enough intro to get us to the chart at hand, Real Estate IYR, but first, this just out, on MarketWatch:
Worst Year, Since 2008.
It’s already the worst since 2008, and as Jerimiah Babe puts it, ‘we haven’t even got started’.
Reference time stamp 12:07, in the link and see if it does not match exactly with Livermore’s observations.
All of which brings us to real estate.
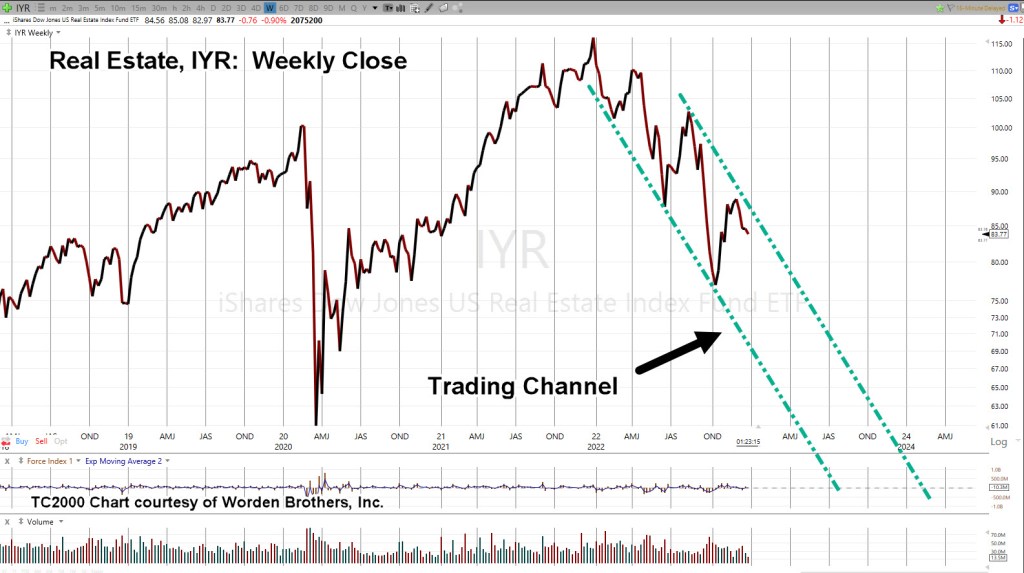
Real Estate IYR Weekly, Close
The chart shows the most conservative (modestly declining) trading channel
The next chart, is where it gets scary.
The second (potential) channel is declining at approximately -62%, on an annualized basis.
Weekly timeframes are presented here on purpose.
Doing so, gets us away from the everyday, every blip, analysis and looks at things strategically. It’s obvious, barring some kind of intervention, real estate’s in trouble.
The January of No Effect
It’s well known, stocks tend to rise in the first weeks of January. Tax loss selling is over and there’s typically some type of ‘relief’.
Don’t count on it this time (not advice, not a recommendation).
Even as this post is being created, IYR, is pivoting lower and possibly confirming the more aggressive right-side trendline (second chart, above).
Summary
We’ll end with more paraphrase from Livermore’s account of the panic.
He describes being in Ed Harding’s office (his broker), telling him that ‘now is the time’, ‘today is the day’. All the while, stocks were drifting, everything was quiet.
Livermore said to Harding:
‘The longer that stocks delayed, the bigger the break will be when it comes.’
Let’s see if that applies to us, exactly 100-years later (Reminiscences, published in 1923).
Note: Posts on this site are for education purposes only. They provide one firm’s insight on the markets. Not investment advice. See additional disclaimer here.
During 2022, we’ve had one short squeeze after another.
For 2023, it could be forced liquidation in the relentless squeeze for cash.
One corporate example of the squeeze is the announcement from CarMax; they’ve suspended their stock buybacks.
This ‘buy-back halt’, theme, needs to be added to the market strategy for the coming year.
We can put that on the list right along with skipped dividends, power outages, market outages, internet cyber-attack and supply chain disruptions.
A comment below, posted in yesterday’s update from Jerrimiah Babe, opines the typical consumer’s going to carry on unabated, until the very last minute.
“I don’t believe most people will stop spending until all access to credit is exhausted. Whether it be cards, after-pay, family, theft most will continue to keep up appearances. I honestly think most could be 2 months behind on their mortgage or rent and still be spending on crap. There’s no financial responsibility or discipline anymore.”
How that may translate to the mainstream is, they continue to report ‘the consumer is strong’ until instantly, overnight, they’re not.
Possible timing for that event may be late January, or mid-February (not advice, not a recommendation).
With all that in mind, the last post identified Netflix and Target, as potential candidates for significant downside opportunity.
‘Significant’, meaning a 50% to 90% decline from current levels (not advice, not a recommendation).
Target TGT, Yearly
The year is just about over so let’s start with a very long-term view.
Two things have happened over the past three-years.
Price action has met a measured move out of the wedge as shown; then, a massive downward thrust.
It’s important to note, this year’s down-thrust, dwarfs the previous one during the -64.7%, decline of ’07 – ’09.
There’s a band of support that’s at least nine-years wide, in the vicinity of 50 – 75.
We’ll discuss that in another update.
Netflix NFLX, Yearly
Technically, Netflix is worse than target. That is, it has the potential to decline farther and faster.
NFLX, has support as well but comparatively minor in the area of 50.
It does not become significant until the wedge (blue lines) in the vicinity of 5 – 10.
With Netflix’s ‘product’ being completely discretionary, it’s ultimate downside potential, from a fundamental standpoint, surpasses that of Target.
Summary
Time permitting, shorter timeframes will be presented.
However, since the primary focus of this site, is first on ‘strategy’ (think dollar rally), we’re interested in the larger timeframes.
That in turn, provides background to drill down further for any trade decisions (not advice, not a recommendation).
Note: Posts on this site are for education purposes only. They provide one firm’s insight on the markets. Not investment advice. See additional disclaimer here.