A Market Of Extremes

So, this is how it’s going to be.
The market itself is telling us it’s not going to be ‘well behaved’, possibly for years to come.
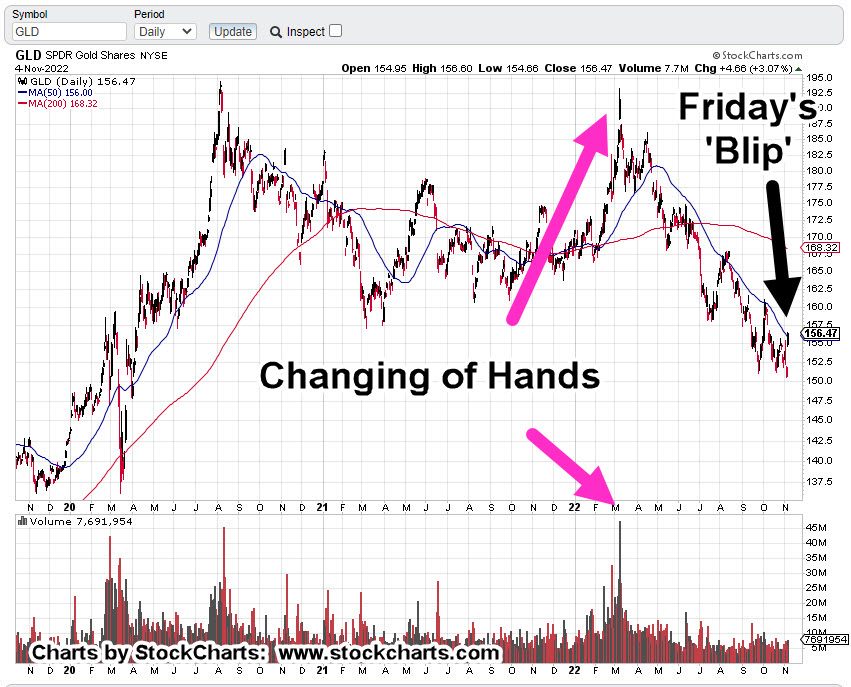
According to Goldman, link here, we’ve just had the largest short squeeze on record.
Friday, must have pushed it over the edge from the previously reported, ‘third largest‘.
The ‘Pontificators’
Everybody think’s they’ve got it figured out; We’re going to have stagflation, no wait, hyperinflation, no wait, inflation/deflation simultaneously, no wait, dollar collapse, no wait, gold to the moon, no wait, and on it goes.
What we really have, which is obvious to those ‘awake‘, is something that’s never happened before.
That ‘something‘ is here every day, multiple times a day.
Flash Crash, 2010
Every so often just as a reminder, this event is posted as an example; until that day, it never happened before either.
“Paper comes in, a big seller!!!”
‘Paper’ is essentially anyone (banks, hedge-funds, institutions, and/or retail) outside the pit. Those in the pit are called ‘locals’.
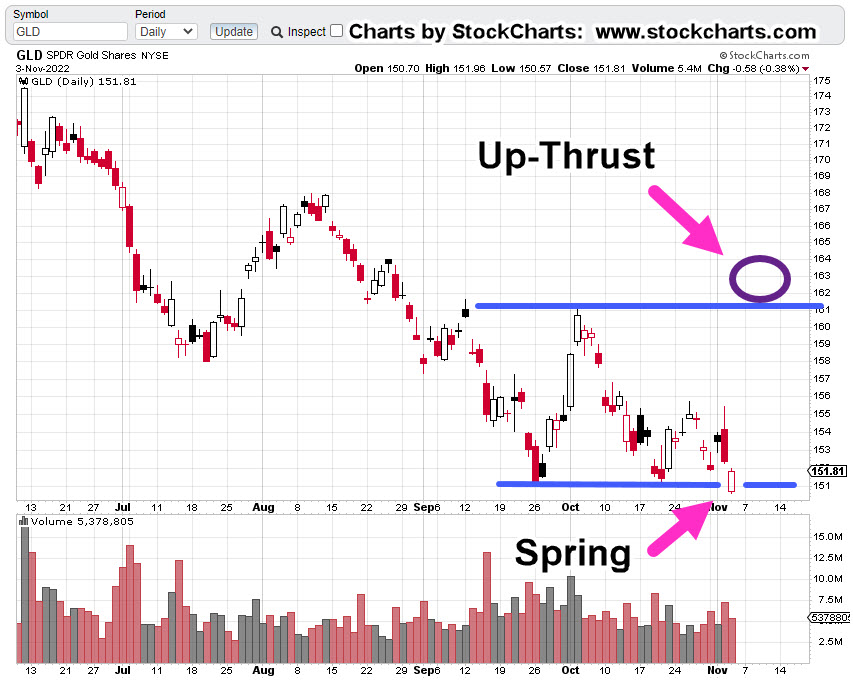
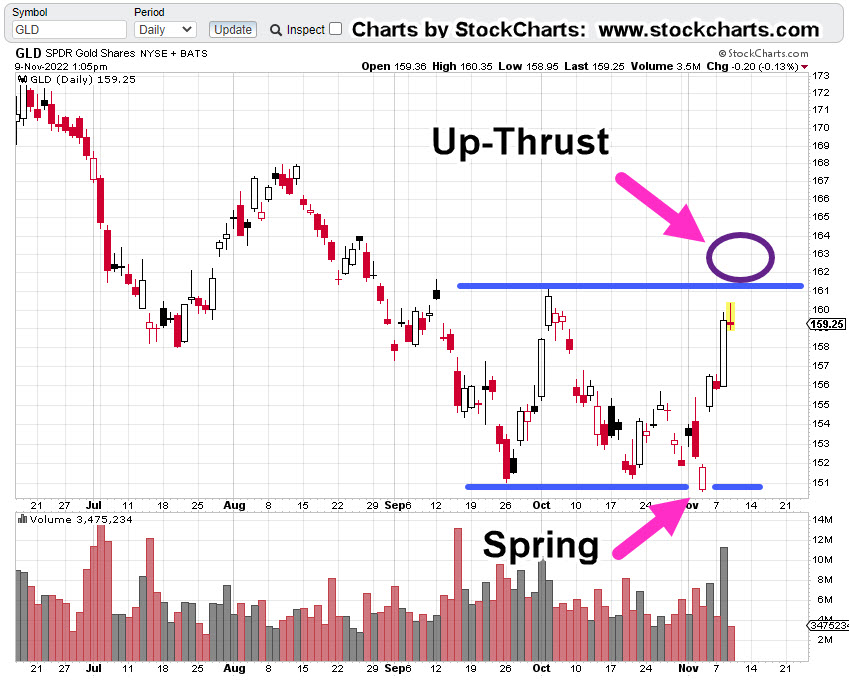
Positioned At The Extreme
The largest short squeeze in history has actually performed a public service; the markets are at extremes.
With that, the short position in Junior Miners GDXJ, has already been discussed, link here.
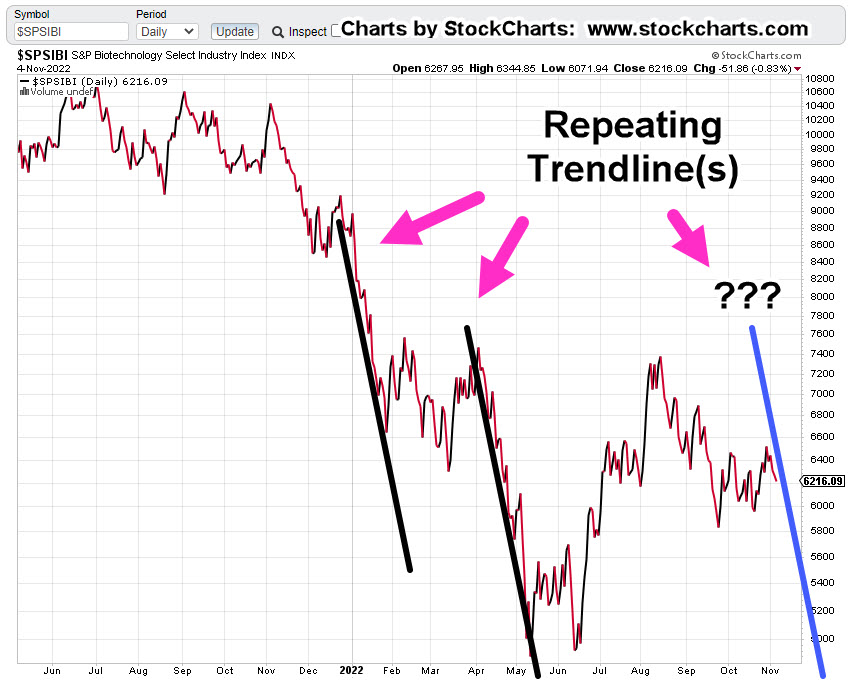
We’re going to move on and talk about the elephant; more specifically, biotech SPBIO.
Biotech SPBIO
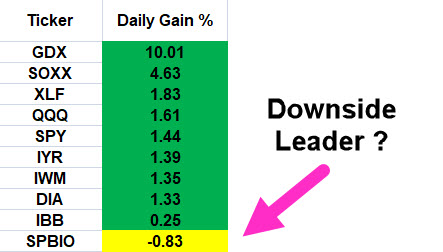
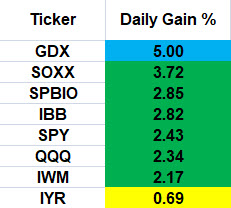
The table shows last week’s action when compared to the week prior. All major sectors had solid gains but it’s the right-most column that’s of interest.
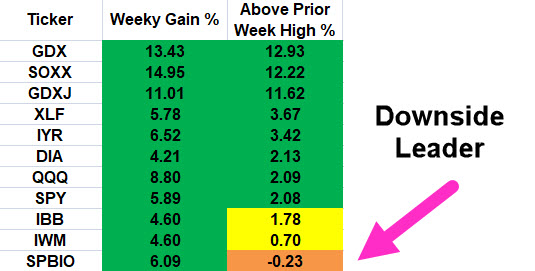
The right-side column shows how far price action closed above the prior week’s high.
Once again, biotech shows overall weakness. It gets more interesting when looking at the weekly chart.
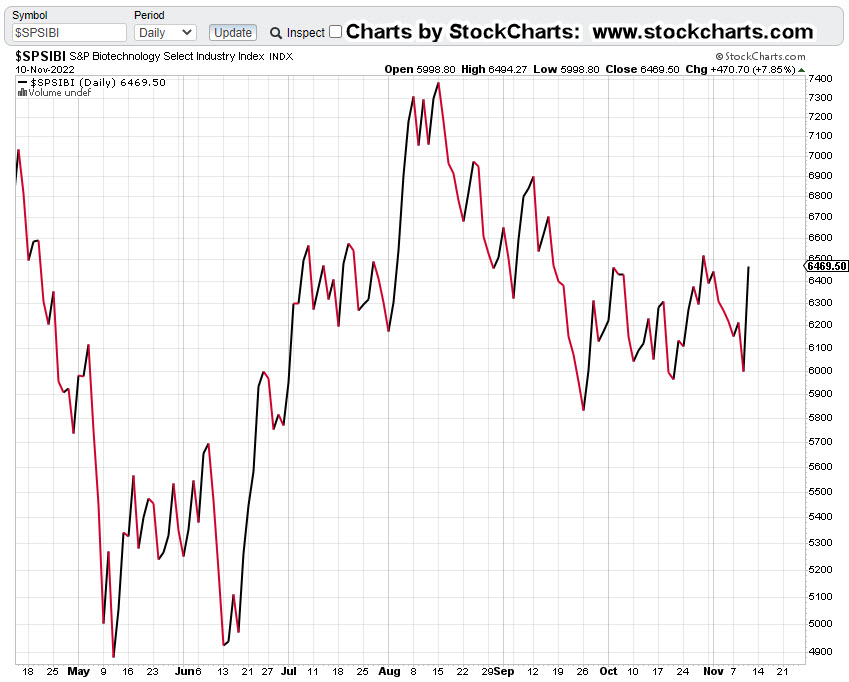
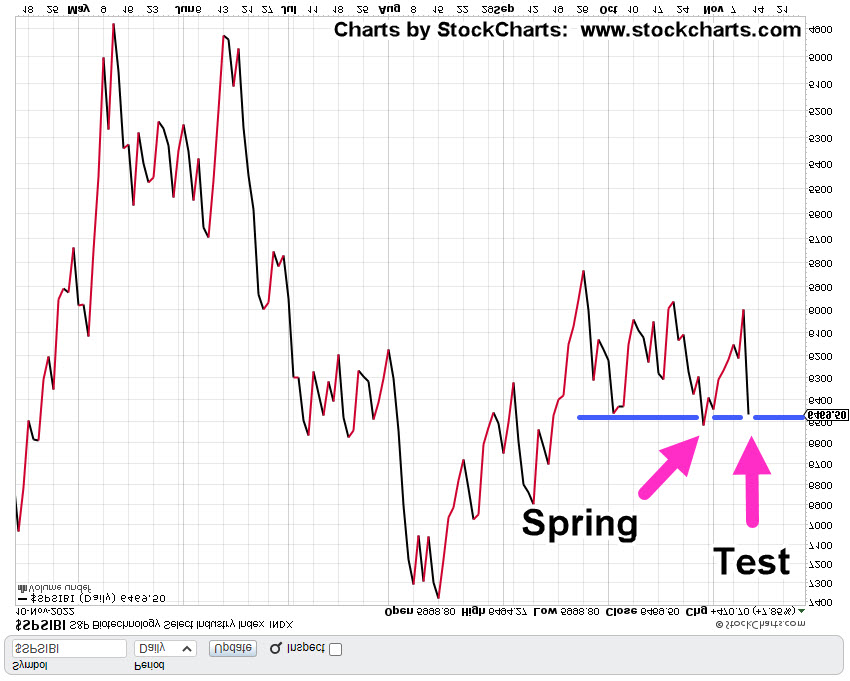
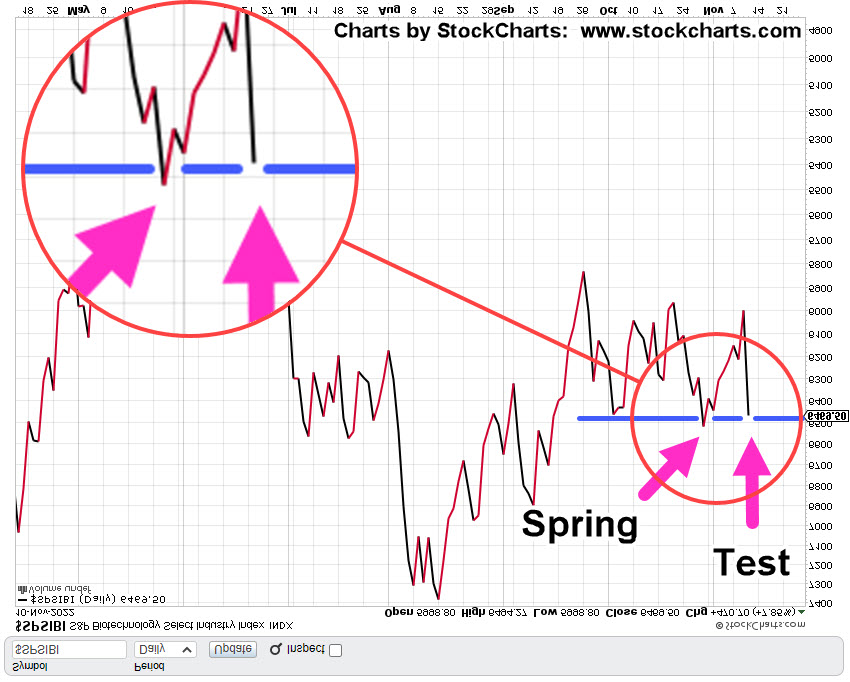
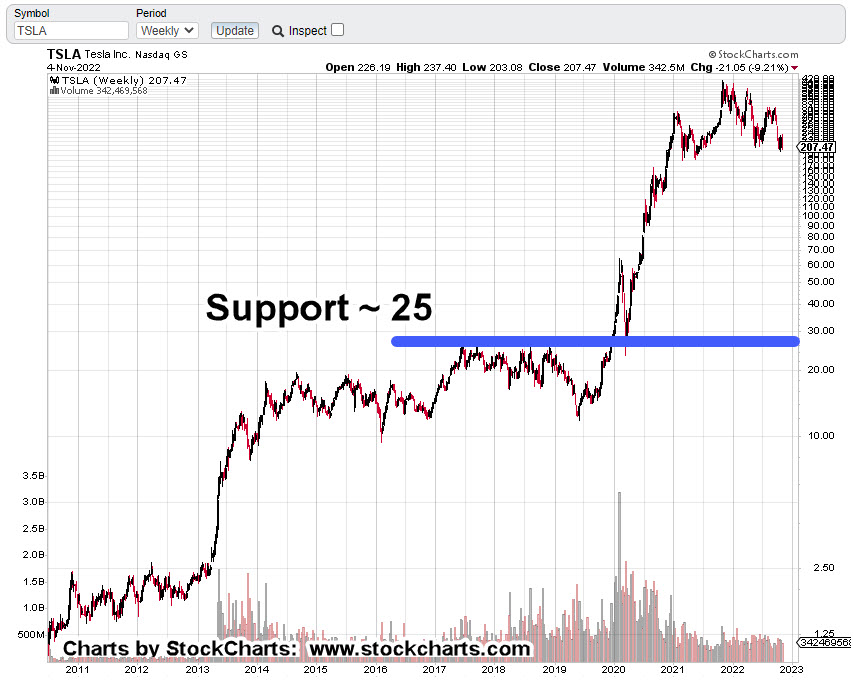
Biotech SPBIO, Weekly
It’s been three successive weeks of apparent up-thrust reversals that were negated each time.
Looking at the weekly below, what we have, is a huge bear flag that just so happens to be, Fibonacci 8-Weeks wide.
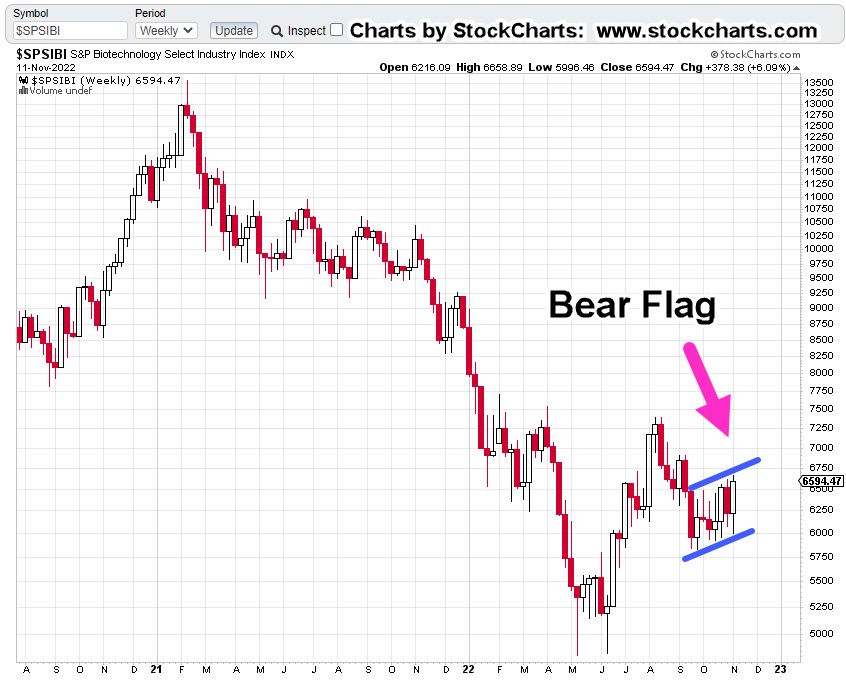
It’s possible, this congestion area is the mid-point of the overall move from the highs set during the week of February, 2021.
Compressing the chart and putting in a measured move target gives us the following.
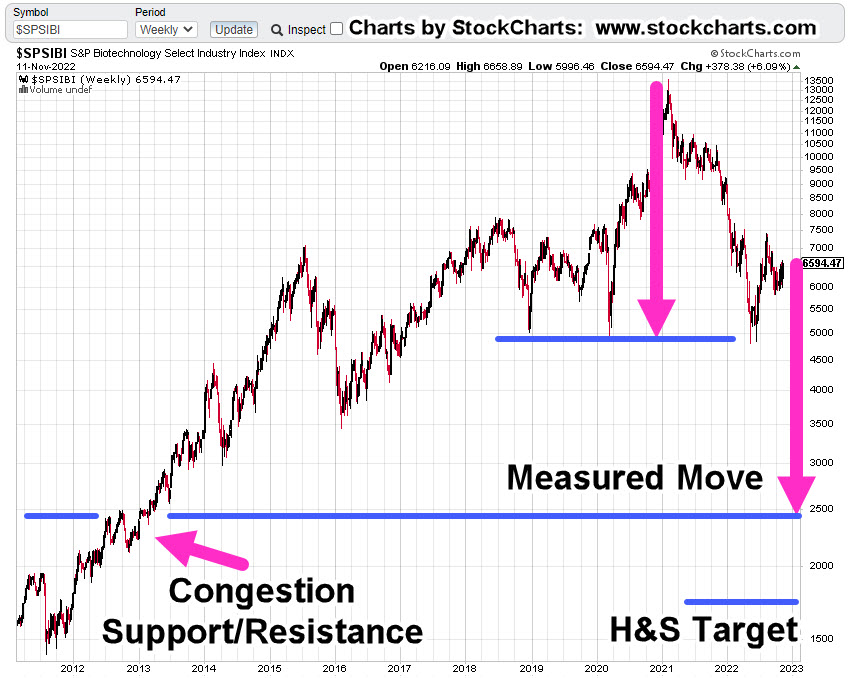
If we have an actual Head & Shoulders top, that target is shown as well.
Either way, the downside potential is enormous; thus, requiring intense focus from a Wyckoff standpoint, i.e., during a bear market, identify the weakest sector for short opportunities (not advice, not a recommendation).
All of which brings us to positioning.
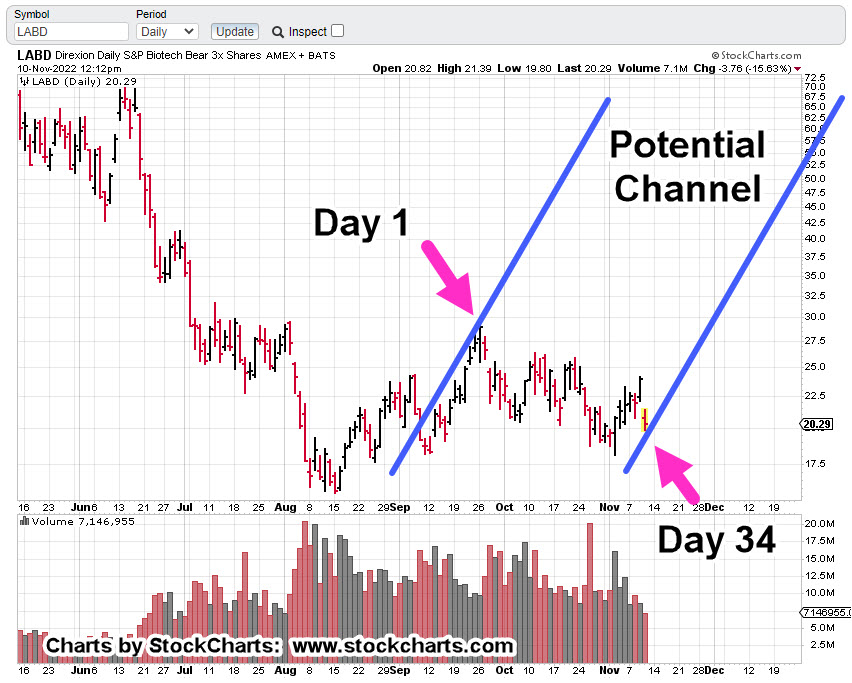
Positioning
On Friday, a discretionary exit was made from the entire LABD-22-09 position as (LABD) price action continued to decline with no end in sight.
Loss on the LABD-22-09, series was a drubbing of -12.2%
Then again, last week was the largest squeeze in history; taking that into account, the loss wasn’t -30% or -50%.
As the trading day progressed, LABD price action continued lower until low-and-behold, it reversed.
Once again, a position was entered (not advice, not a recommendation) but this time was different. Frist off, initial position size is smaller; about 60% smaller.
Secondly, the stop is an actual order that’s in the market (shown below).
Sounds obvious but we’re dealing with unprecedented times and market disruptions. Recall during the Flash-Crash of 2010, Kimberly Clark, or Colgate (if memory serves) went ‘no-bid’ and printed i.e., sold for 0.01.
That low print remained on the charts for years until it was ultimately removed.
If it can happen on the downside (i.e. when long), it can happen on the upside as well (when short).
Positions: (courtesy only, not advice).
LABD-22-10***:
Entry @ 18.1398***: Stop @ 16.83***
JDST-22-05***
Entry @ 9.1666***: Stop @ 8.79***
Note: Positions may be increased, decreased, entered, or exited at any time.
***, Indicates change
Stay Tuned
Charts by StockCharts
Note: Posts on this site are for education purposes only. They provide one firm’s insight on the markets. Not investment advice. See additional disclaimer here.
The Danger Point®, trade mark: No. 6,505,279