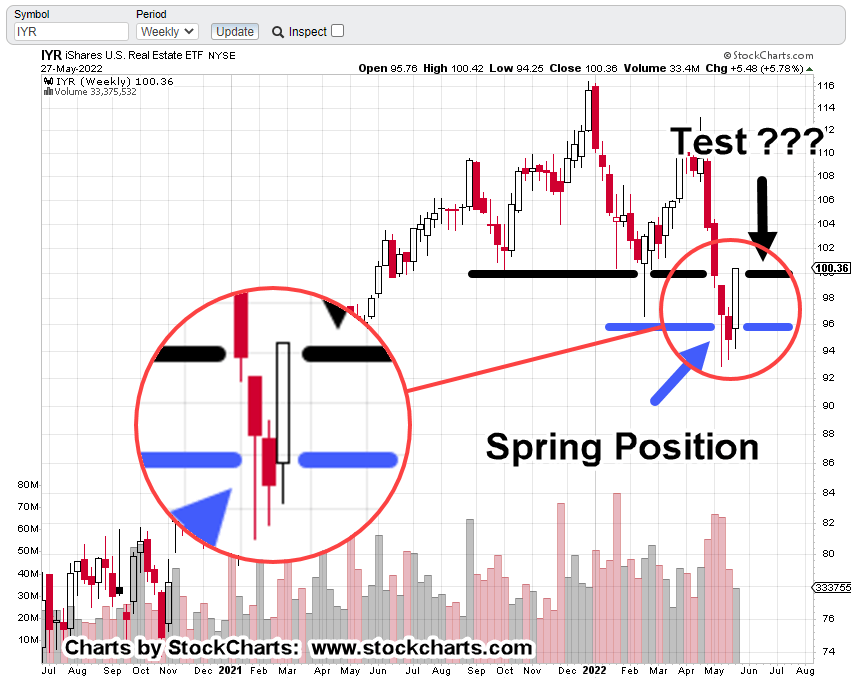
SPBIO, Correction Complete

This morning’s action in biotech SPBIO, indicates we’re done with the upward corrective move.
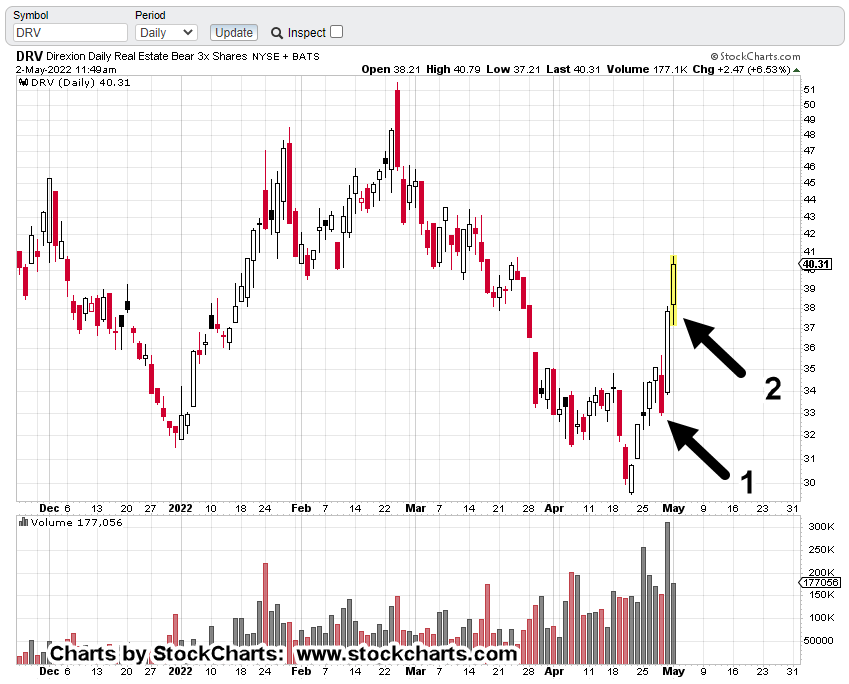
The prior short position LABD-22-02, was reduced throughout the downward push over the past week and then exited completely in this morning’s pre-market session.
Within minutes after the open, as LABD pushed lower (SPBIO higher), it became obvious, a significant reversal was at hand.
It took LABD, just a little over two minutes to clear out stops and then begin an upside reversal.
Amateur vs. Professional
Dr. Alexander Elder covers the amateur/professional difference in his book Come Into My Trading Room.
That is, if an amateur gets stopped out or exits with a loss, they never come back.
Even if the trade reverses to go their direction, they refuse to re-position … having been ‘spanked’ by the market.
Breaking free of the (engineering) perfectionist mindset, is just one challenge during the journey to professional.
It must be overcome to achieve sucess in the markets.
Re-Positioned, Short
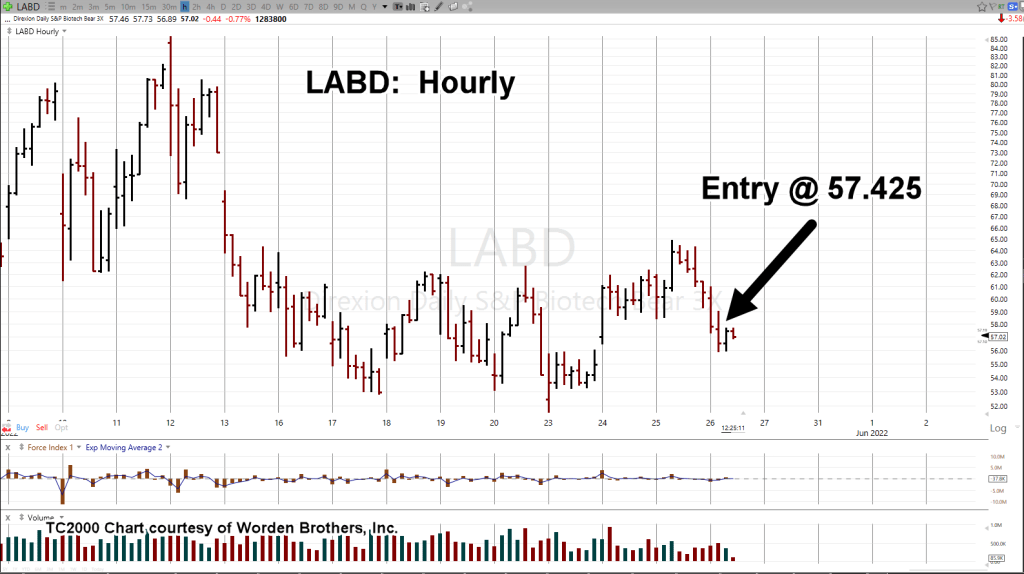
All of the above to say, the short in biotech has been re-established: LABD-22-03 (not advice, not a recommendation).
The difference at this point is, there’s a high level of expectation on what’s likely to happen next.
As Wyckoff put it a century ago, the reversal and re-position, enables us to be ‘in tune’ with price action.
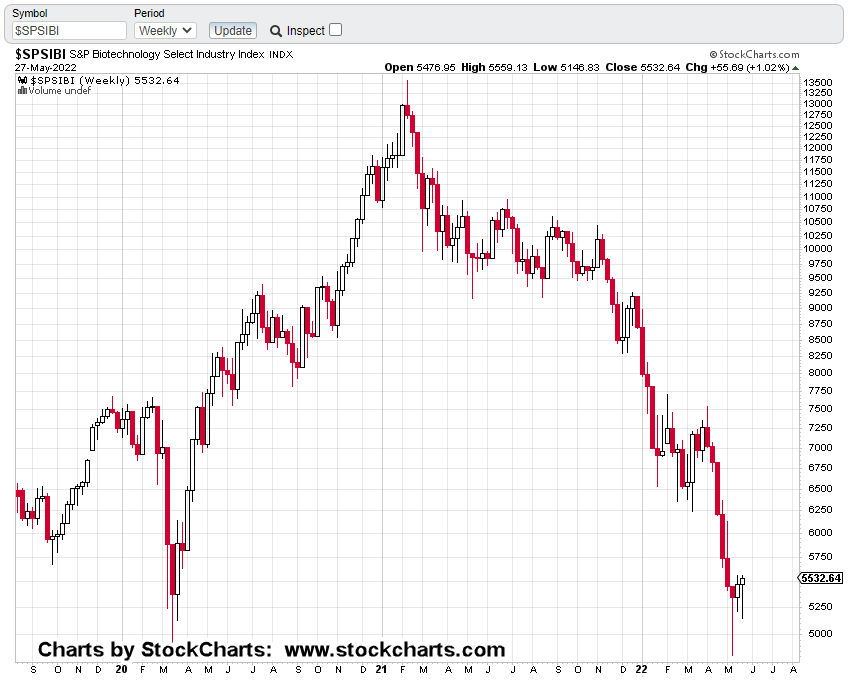
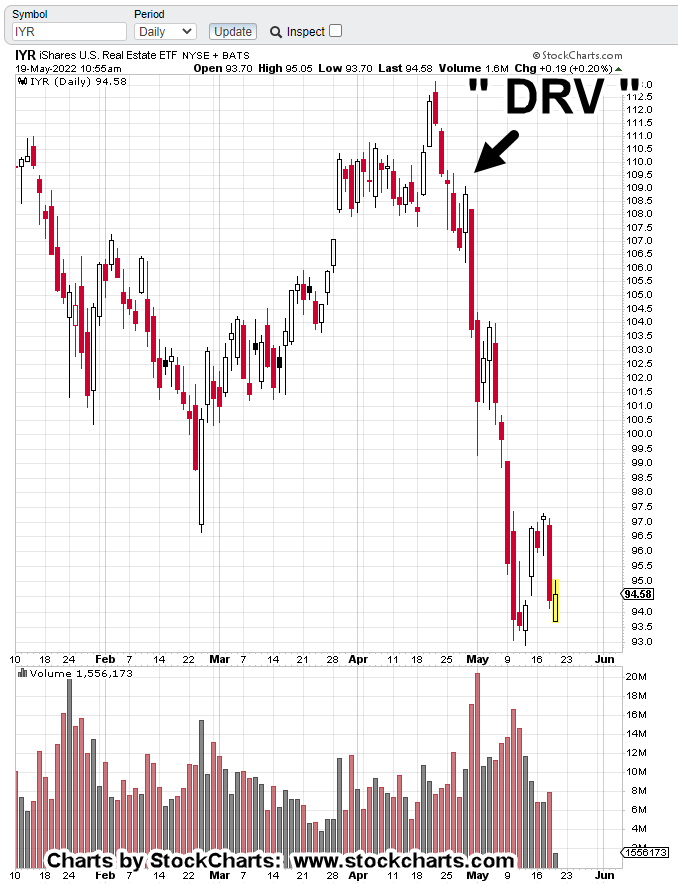
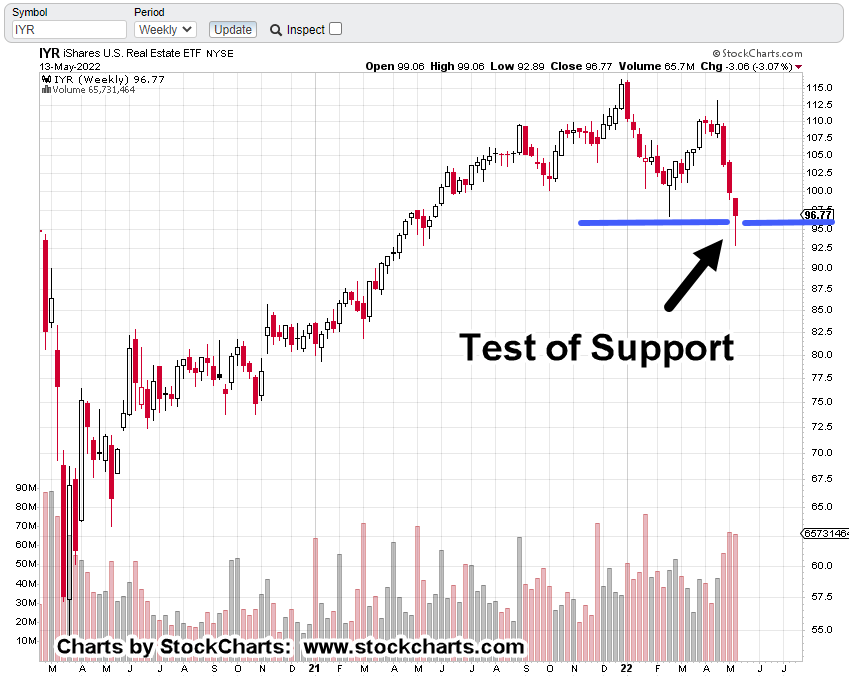
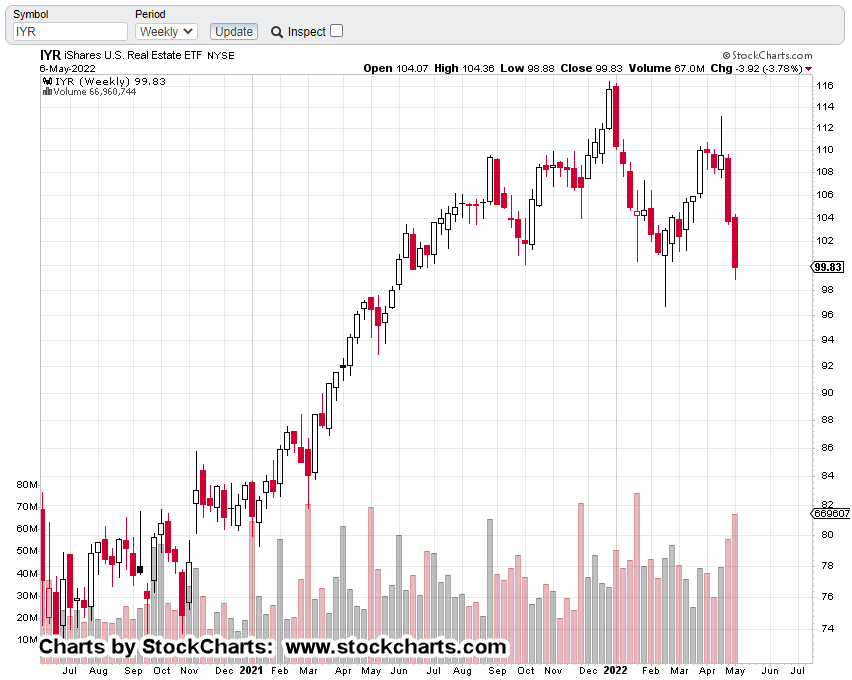
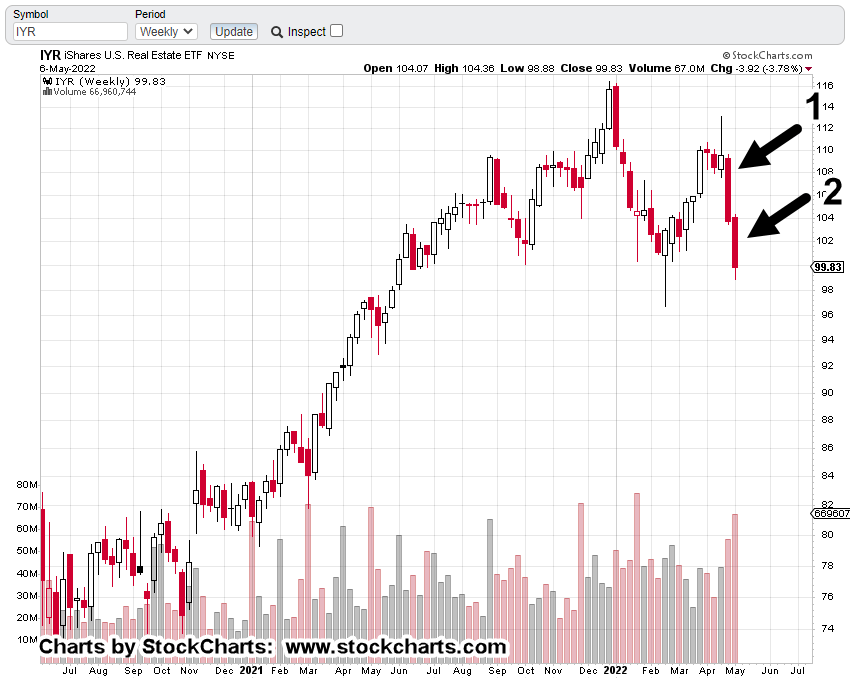
Biotech SPBIO, Weekly

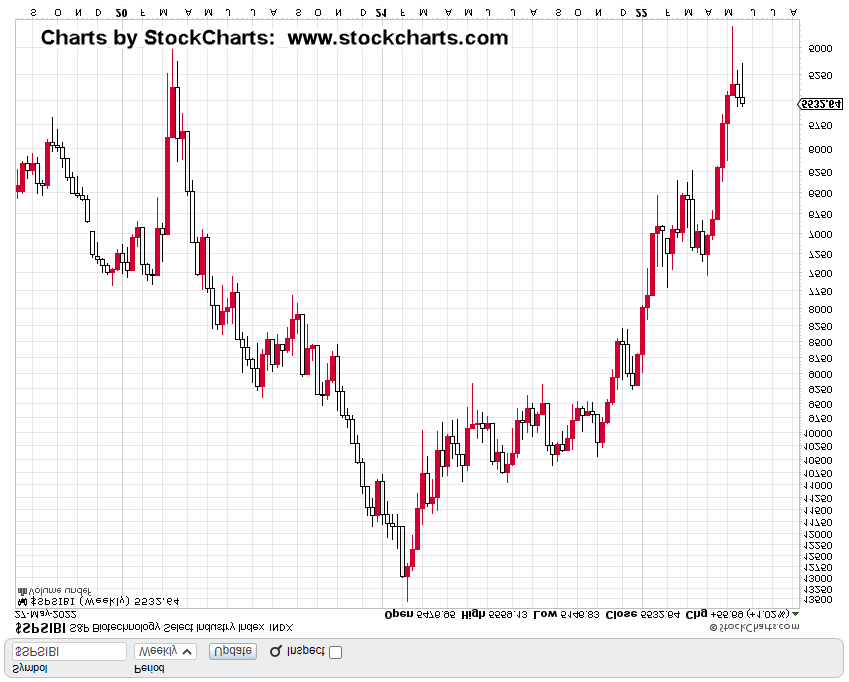
We’re going to invert the chart and mark it up.
First off, we can see the rule of alternation at work.

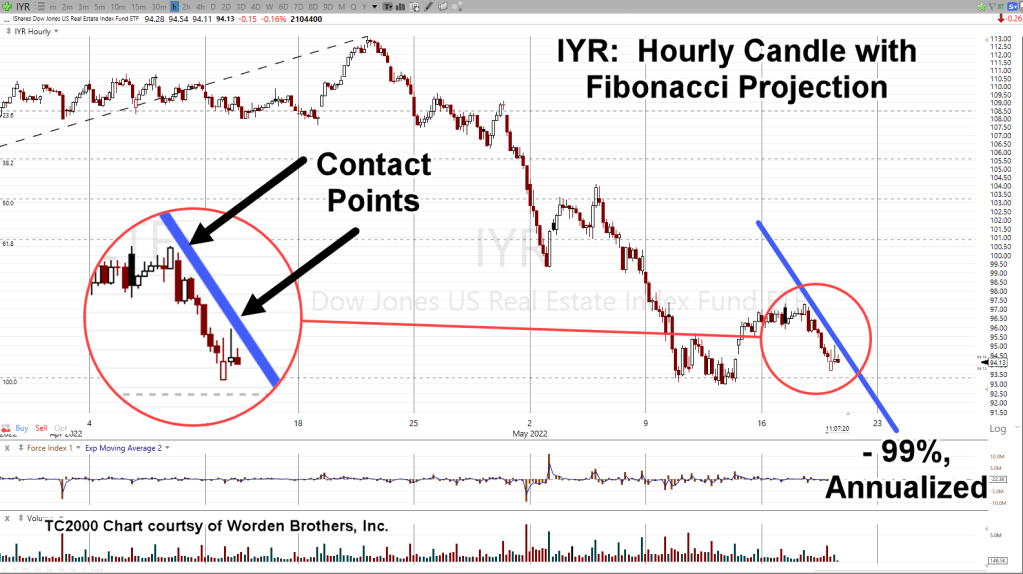
Next, we have at least two potential trading channels.
This one …
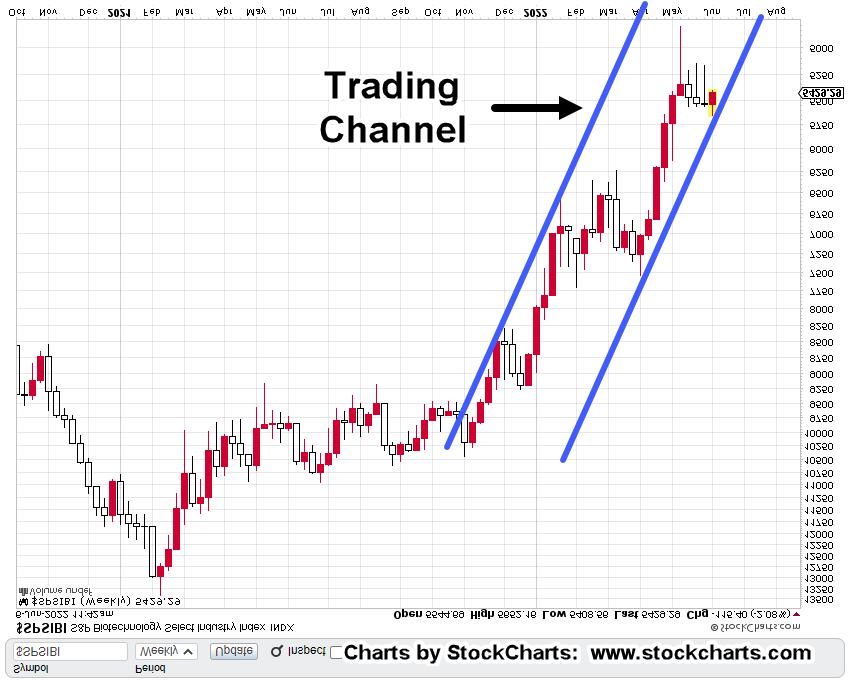
And this one …
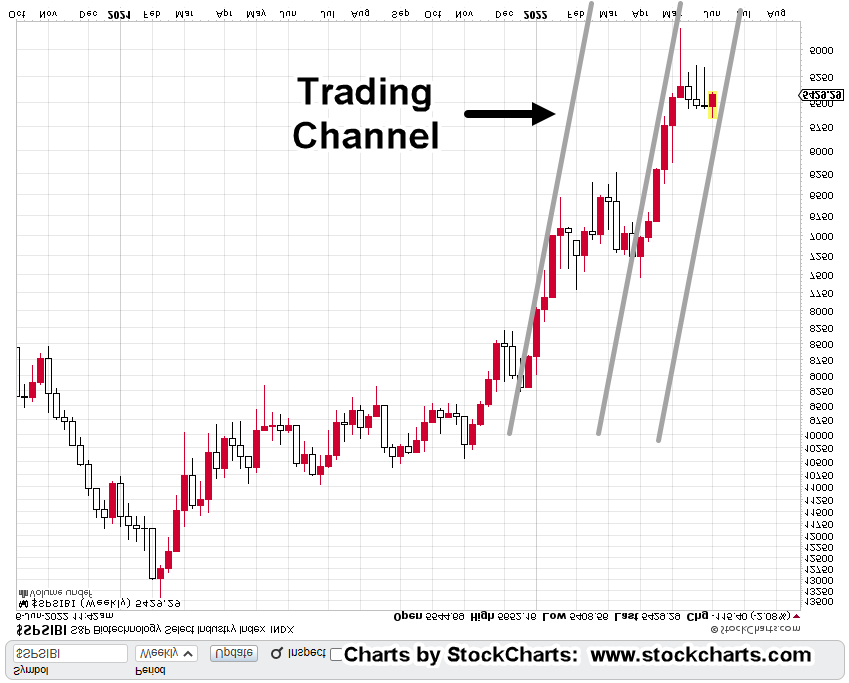
We’ll let price action itself define which one (or none) is in-effect.
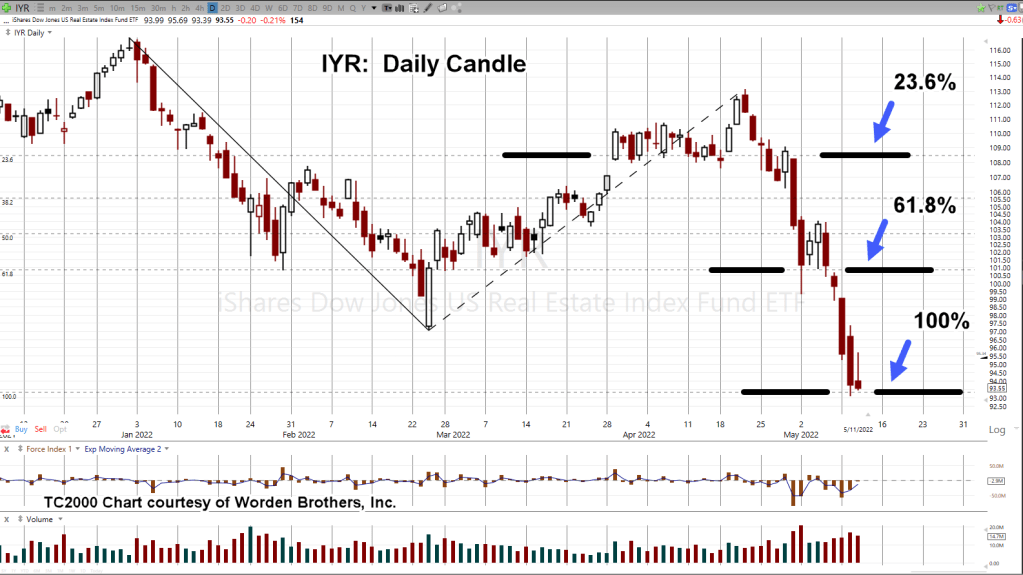
When we get a corrective move that resolves itself, at times, it creates a pivot point with a different rate of advance or decline.
That means, there’s more than a good possibility, the second (more aggressive) channel, is now dominant.
Summary
As this trade progresses, we’ll cover potential areas where the existing position can be increased with as low risk as possible.
As this juncture, LABD is trading in the area of 55.25.
The early (pre-market) loss has been more than recovered and we’re now well in the green for the day.
Stay Tuned
Charts by StockCharts
Note: Posts on this site are for education purposes only. They provide one firm’s insight on the markets. Not investment advice. See additional disclaimer here.
The Danger Point®, trade mark: No. 6,505,279