The 15-minute, ‘January Effect’

That’s All There Was

If we use the S&P as the proxy, it hardly even lasted that long.

Going back to just four days ago, we had this (emphasis added):

“It’s well known, stocks tend to rise in the first weeks of January. Tax loss selling is over and there’s typically some type of ‘relief’.

Don’t count on it this time (not advice, not a recommendation).”

Market Meets Expectations

It was expected on the first trading day of the year, the market would continue its downtrend.

After this morning’s 15-minute blip, that’s exactly what’s happening.

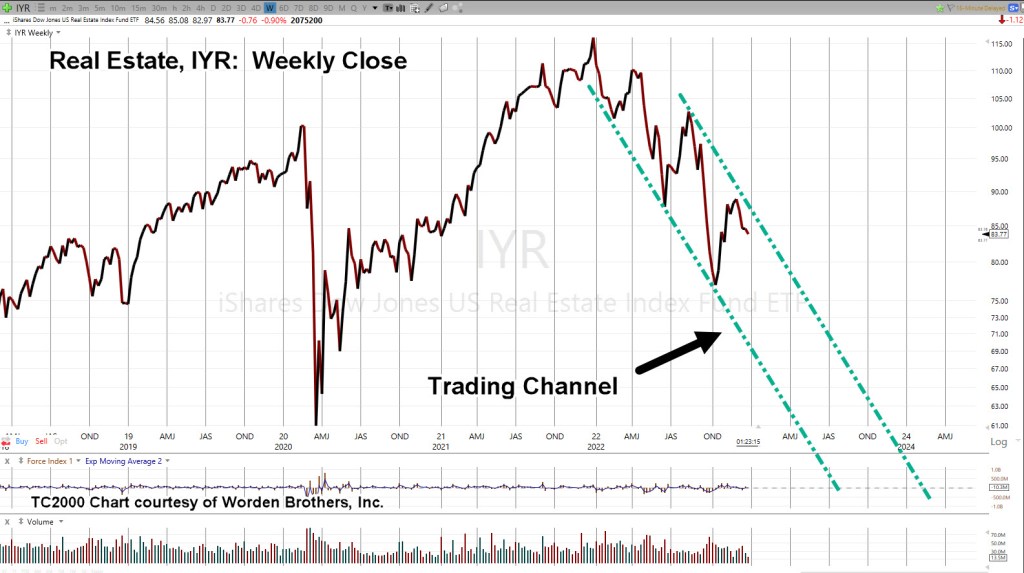
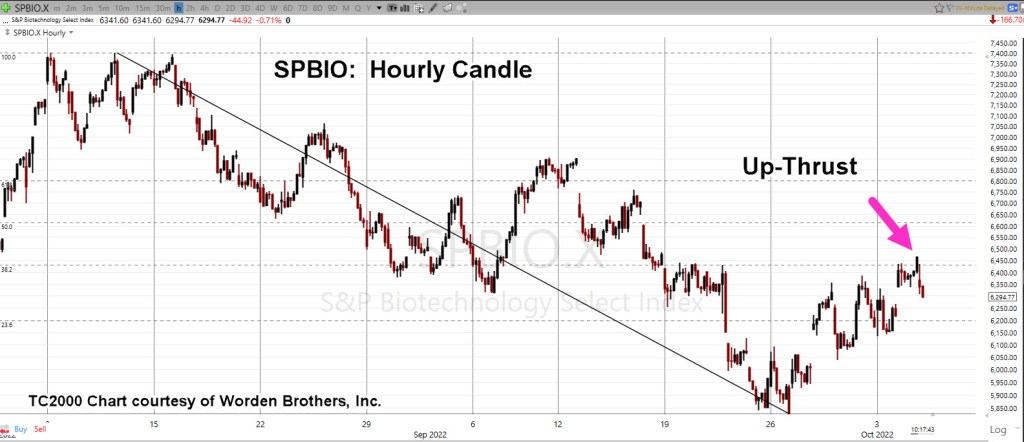
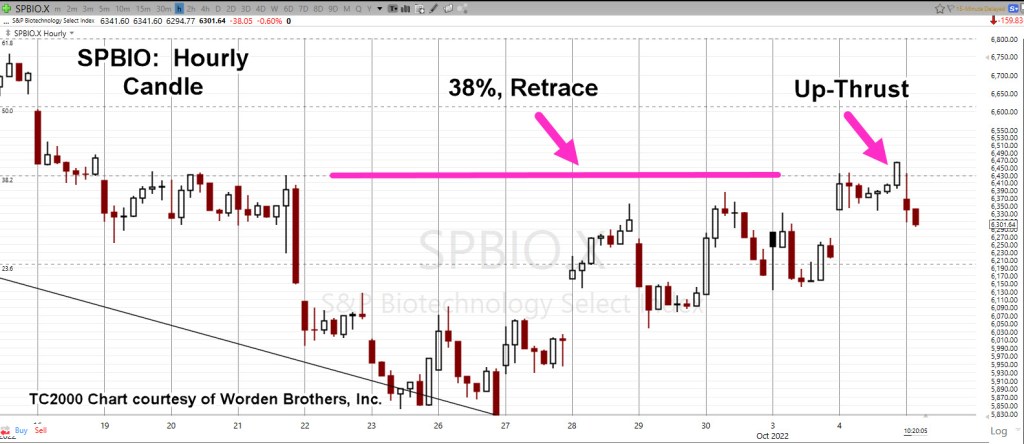
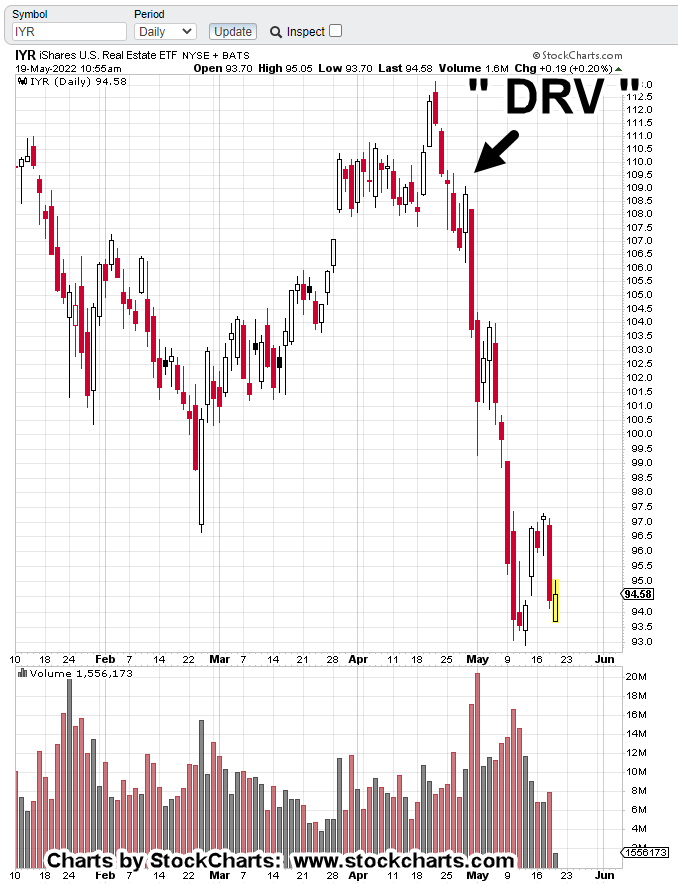
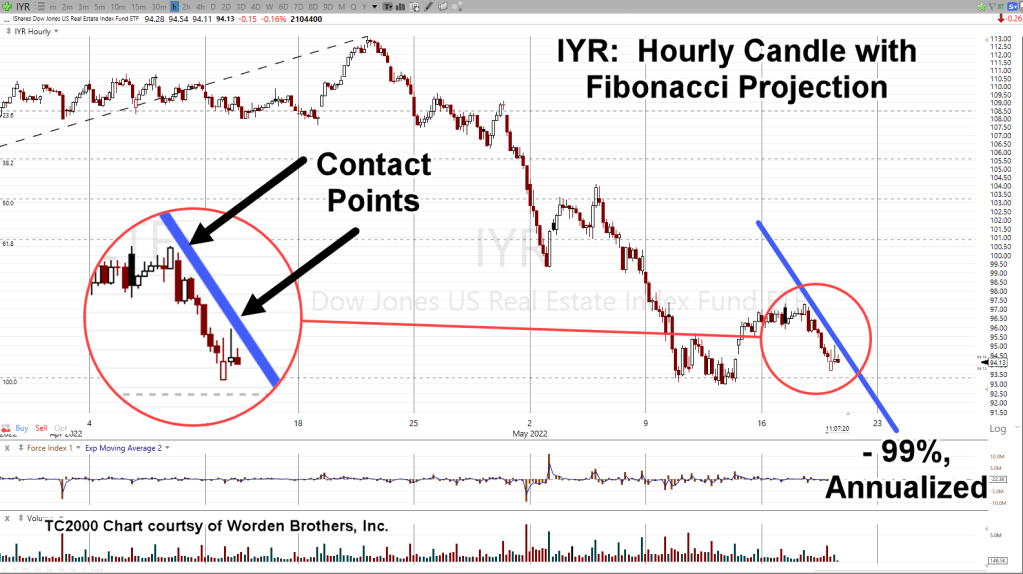
We’ve already discussed real estate IYR, (here, here and here) as well as the Q’s (here).

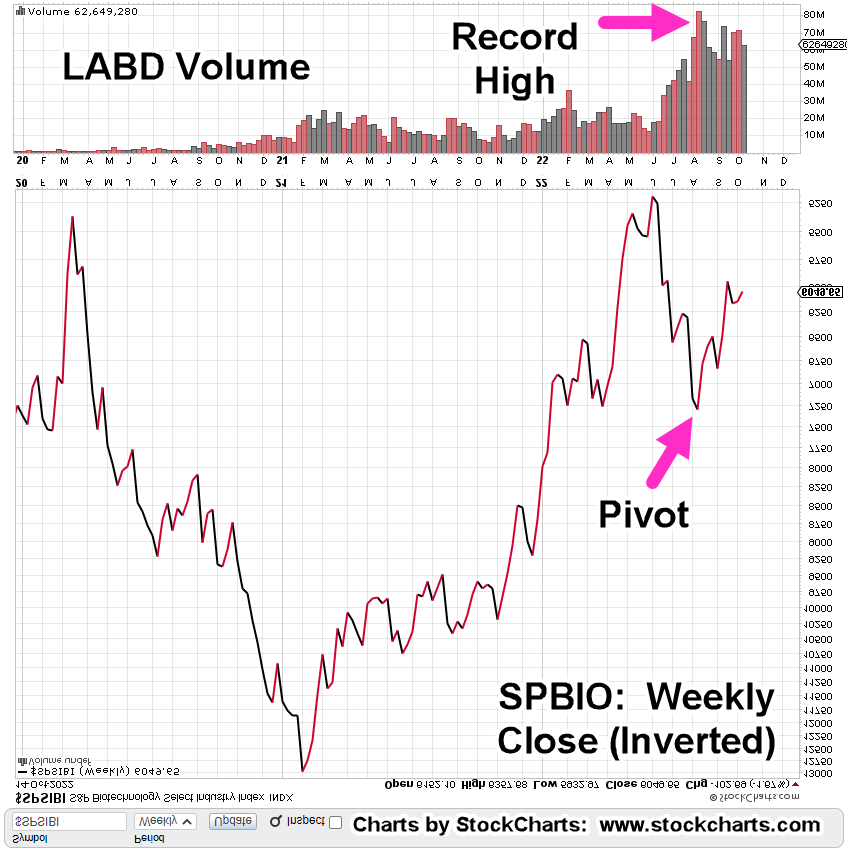
Now, there appears to be another sign of impending price collapse … the oil sector; specifically, Oil & Gas Index XOP.

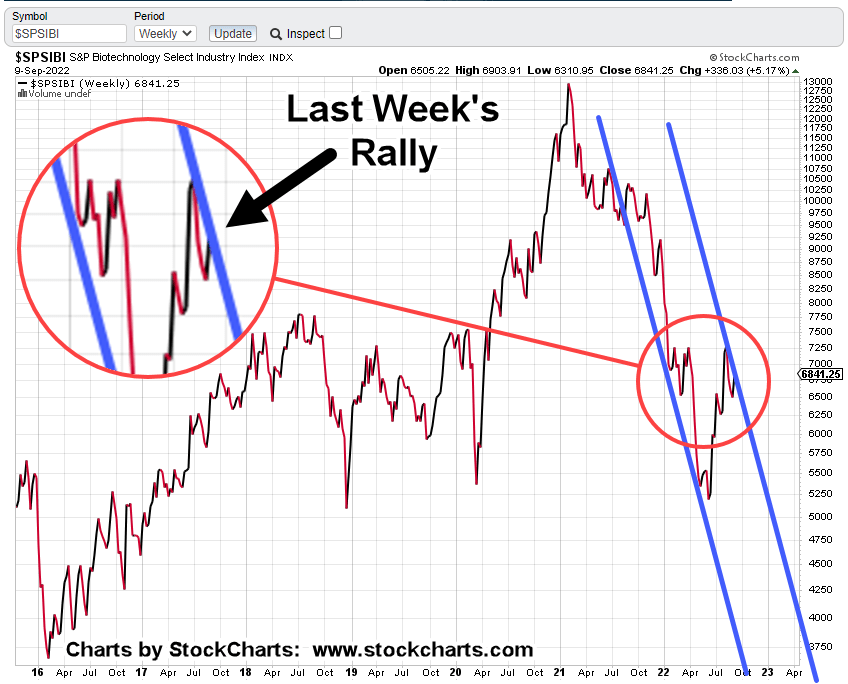
As is typical, we’ll begin the analysis with the longer time frame, the weekly.

Oil & Gas Sector XOP, Weekly

There’s no secret to the chart below other than Livermore’s admonition for going short; that is, he finds a market that ‘goes down and stays down’ (not advice, not a recommendation).

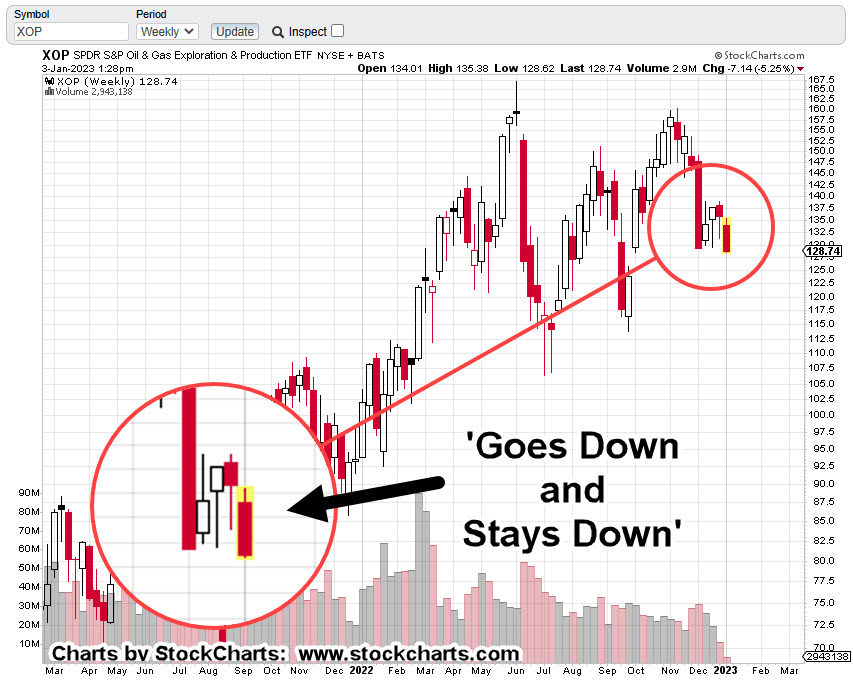
The prior two down-drafts were quickly retraced; one in mid-July last year and one in September.

Not so, this time.

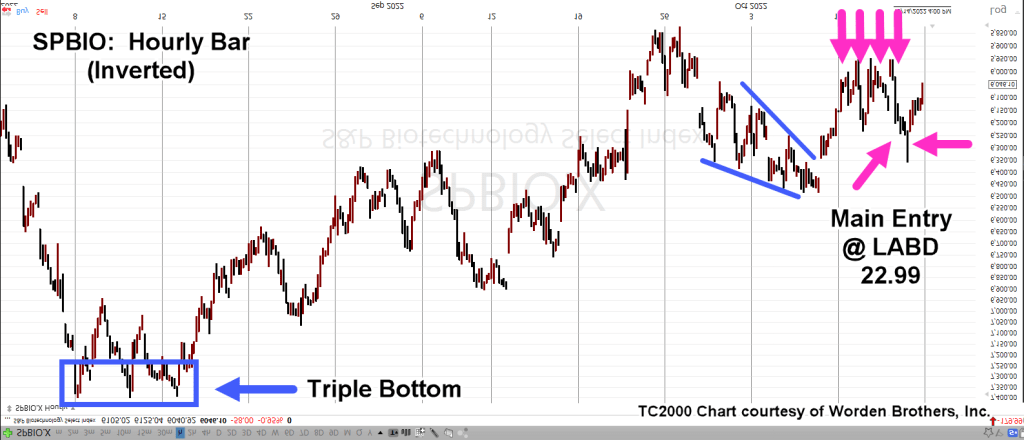
If we go to the daily, we have an ominous look where a downtrend could be validated.

Oil & Gas Sector XOP, Daily

The right-side trend is drawn as a dashed line, revealing the attempted breakout on the last two sessions in December.

Attempted trend line and channel breakouts are normal market behavior.

It’s clear in the case above, price action has quickly got itself back into the trading channel.

Summary

Of course, oil prices are not supposed to go down, right?

At this juncture, look at all the conflict and potential supply disruptions that are possible.

However, the price of oil and the price of the exploration/production equities are two separate things.

The price of oil could skyrocket further, and yet, the equites still collapse. Bear markets are all about price, wealth, and credit destruction.

Typical short positioning trade vehicles for this sector are DRIP (-2X) and DUG (-2X), or to short the XOP directly (not advice, not a recommendation).

Stay Tuned

Charts by StockCharts

Note:  Posts on this site are for education purposes only.  They provide one firm’s insight on the markets.  Not investment advice.  See additional disclaimer here.

The Danger Point®, trade mark: No. 6,505,279

The Panic of 2023

Parallels To, The Panic of 1907

Pick up almost any trading book like Reminiscences of a Stock Operator, and you’ll find, the big money was made on the downside.

In Livermore’s case from ‘Reminiscences’, he saw a big crash coming, went short in a big way, and was then squeezed out of his positions during market rallies in 1906.

The short trades were too early; he blew up his account.

Undaunted, he took drastic measures to raise capital (hawked his car), got back in, shorted, and cleared over $1-milllion in profits near the bottom on October 24th, 1907.

The Ukraine War & The Boer War

As spectacular as his profits were, for us that might not be the most important part.

Take a look at the list below, paraphrased from Livermore’s account of The Boer War and overall economic conditions; see if it doesn’t match up to today.

The British were just coming off the Boer war, having spent hundreds of billions (in today’s Pound-Sterling), and money was tight.

There was significant wealth destruction world-wide.

The San Fransico earthquake of 1906, was causing economic disruption and the need for even more cash.

Note: As reported here, seismic activity is picking up. We’ve just had a major quake (again) in California.

There were plenty of warnings of an impending collapse but as Livermore puts it, the masses paid no heed as they were more concerned with baseball.

Fabrication & Fact

There’s some scuttlebutt, The Panic of 1907, was a fabricated event, used to usher in fractional reserve banking.

Is this all starting to sound familiar?

Now, we have the potential of Neo Feudalism, going right along with Universal Basic Income and Digital Currency.

That should be enough intro to get us to the chart at hand, Real Estate IYR, but first, this just out, on MarketWatch:

Worst Year, Since 2008.

It’s already the worst since 2008, and as Jerimiah Babe puts it, ‘we haven’t even got started’.

Reference time stamp 12:07, in the link and see if it does not match exactly with Livermore’s observations.

All of which brings us to real estate.

Real Estate IYR Weekly, Close

The chart shows the most conservative (modestly declining) trading channel

The next chart, is where it gets scary.

The second (potential) channel is declining at approximately -62%, on an annualized basis.

Weekly timeframes are presented here on purpose.

Doing so, gets us away from the everyday, every blip, analysis and looks at things strategically. It’s obvious, barring some kind of intervention, real estate’s in trouble.

The January of No Effect

It’s well known, stocks tend to rise in the first weeks of January. Tax loss selling is over and there’s typically some type of ‘relief’.

Don’t count on it this time (not advice, not a recommendation).

Even as this post is being created, IYR, is pivoting lower and possibly confirming the more aggressive right-side trendline (second chart, above).

Summary

We’ll end with more paraphrase from Livermore’s account of the panic.

He describes being in Ed Harding’s office (his broker), telling him that ‘now is the time’, ‘today is the day’. All the while, stocks were drifting, everything was quiet.

Livermore said to Harding:

‘The longer that stocks delayed, the bigger the break will be when it comes.’

Let’s see if that applies to us, exactly 100-years later (Reminiscences, published in 1923).

Stay Tuned

Charts by StockCharts

Note:  Posts on this site are for education purposes only.  They provide one firm’s insight on the markets.  Not investment advice.  See additional disclaimer here.

The Danger Point®, trade mark: No. 6,505,279

The Usual Suspects

Special Biotech Edition

Bogart

An immense flood of data; research reports, lawsuits, expose articles and anecdotal evidence; every day, multiple times a day, something new.

Has the biotech technical (finally) lined up with the fundamental?

Those fundamentals are farther down but first, we’ll discuss the technical.

As a reminder, sometimes charts are inverted during analysis. This ‘trick’ was discovered years ago and is based on techniques used by Dr. Alexander Elder.

Biotech SPBIO, Weekly Close (Inverted)

We’ve taken the weekly closing chart of SPBIO ($SPSIBI, on StockCharts) and inverted it to mimic the action of inverse fund LABD.

The index has no volume; so LABD is used instead.

The magenta arrow shows the pivot point for the index, corresponds will all-time record volume on leveraged inverse LABD.

Next, we’ll get closer-in and look at the ‘pivot’ on the hourly chart (inverted).

SPBIO, Hourly (Inverted).

The magenta arrows show successive positions (Livermore ‘probes’) entered (via LABD) before the main entry @ LABD 22.99, which was 90% of position size up to that point.

The next day (Friday) had a gap-lower open that was quickly reversed. Position size was increased by another 5%, at LABD 22.29 (not advice, not a recommendation).

Effective position equates to LABD 23.17

Price action pulled away steadily from the early morning levels, suggesting a sustainable reversal.

The Fundamentals

Some of this stuff, you just can’t make up.

Listed in somewhat chronological order, here they are (not an exhaustive list).

No. 1

Pfizer hires 600 to help document adverse events. Wasn’t it supposed to be ‘safe and effective’?

No. 2

Pilot Shortage

Fired/quit because they refuse to get ‘protection’.

A possible corollary to what’s happened, via injection, we have this.

No. 3

Pfizer, nobody wants their product … after the rollout.

No. 4

Who could it be?

Previously unknown (or rare) problems and illness now starting to accelerate.

No. 5

We’re here to help.

No. 6

You mean, it was all a lie?

No. 7

The real reason for getting ‘tested’?

No. 8

What did the media know and when did they know it?

No. 9

It’s still a ‘suggestion‘ but the payouts to family members are real.

No. 10

It’s over … and then it’s not.

No. 11

We’ll keep it quiet, so no feelings get hurt.

No. 12

How bad is your batch? Let’s see.

No. 13

You mean, it was never tested? I’m shocked.

No. 14

After all that, maybe we can give it another shot.

No. 15

A potential infinite number of complications … nothing to see here.

No. 16

Getting away with it? Not so fast.

No. 17

Just had a heart attack? We can help.

No. 18

Limited Hangout? You decide.

No. 19

Lastly, this is what it’s really all about.

Recorded years ago. Did her ‘prophecy’ come true?

Stay Tuned

Charts by StockCharts

Note:  Posts on this site are for education purposes only.  They provide one firm’s insight on the markets.  Not investment advice.  See additional disclaimer here.

The Danger Point®, trade mark: No. 6,505,279

Biotech Reversal … The Big One ?

Seventh Time A Charm

‘Get right and sit tight’ … Livermore

Well, it’s the ‘get right’ part that’s the challenge.

As for Biotech SPBIO, it’s no secret it’s been on again, off again, then back on again.

So, it is. Based on current price acton, yesterday was a head-fake into the 38% retrace.

This morning’s session attempted to move higher but was rejected within the first 3-minutes.

Once again, the short trade via LABD, has been re-established (not advice, not a recommendation).

We have LABD-22-07; entered at 21.88, with a stop at the session low of 20.88.

At this juncture (10:50 a.m., EST), Inverse Fund LABD, is pushing higher.

The hourly chart of SPBIO, shows the 38% retrace and reversal.

Biotech SPBIO, Hourly

Expanded version.

As of this post (10:50 a.m., EST) price action has just filled the gap from yesterday’s session. Some amount of SPBIO, retrace higher (below this morning’s highs) is reasonable.

Summary

The groundwork has already been laid over the past few months and even as far back as one year, why this sector may be set for a stupendous decline.

Of course, we don’t know if ‘this is it’, until it’s all over.

For now, the LABD position is in the green with a hard stop at the session low of 20.88 (not advice, not a recommendation).

Stay Tuned

Charts by StockCharts

Note:  Posts on this site are for education purposes only.  They provide one firm’s insight on the markets.  Not investment advice.  See additional disclaimer here.

The Danger Point®, trade mark: No. 6,505,279

There is no ‘Spoon’

Paradigm Shifts

We’re living in the surreal.

Only those who can ‘see’, understand it’s like something out of The Matrix.

The old paradigms no longer apply.

There is no ‘Pivot’

There never was a ‘pivot’; just like there never was a goal of 2% inflation, or full employment.

Way back in 1921, Jesse Livermore pegged it when he told Wyckoff, the whole premise of Wall Street, was to spread “deception”.

Deception is the key.

Attempting to figure out the next earnings release, the CPI or employment numbers, inflation, or what the Fed is likely to do, is to buy into the deception.

Following that deception, is the path of the amateur.

Meanwhile, back on the professional side; as early as 1909, Wyckoff discovered market prices move based on an energy and objective or their own … completely removed from any fundamentals.

A few days ago, this update, discussed how biotech SPBIO, was potentially at a pivot point and ready to reverse lower.

Well, downside reversal is what we have.

Biotech SPBIO, Weekly Close

Even though we still have three trading days left, SPBIO, appears to be confirming the right-side trading channel.

Last Week.

And … this week

With the overall markets down sharply, events appear to be set in motion to continue downside action.

Summary:

As stated in prior updates, the current trade; LABD-22-05, was initiated in anticipation of a significant break lower (not advice, not a recommendation).

On the biotech fundamentals side (not that it matters), the wheels have come off.

The top weighted equities have no P/E … a decent conclusion may be the lower weightings don’t either.

Nobody’s making any money; rates are rising and we’re heading straight into an economic depression.

Stay Tuned

Charts by StockCharts

Note:  Posts on this site are for education purposes only.  They provide one firm’s insight on the markets.  Not investment advice.  See additional disclaimer here.

The Danger Point®, trade mark: No. 6,505,279

The ‘Santa Claus’ Rally

That Was it!

It’s going to be a very different place come December.

This won’t be like ’08 -’09, where all the stops are being pulled to ‘rescue’ the market.

No, this time really is different.

We can all see by now; the plan is controlled demolition.

Paraphrasing Jerimiah Babe, and Pinball Preparedness, we haven’t even got started (with the collapse) and the public’s already folding up.

What’s it going to be like when it really hits?

This past week, all the major indices have gone through some type of relief rally. Call it a Santa Claus rally because there probably won’t be one this December.

Trading Consistency

Throughout this upward correction, the case has been made over and again, only biotech SPBIO’s in a technical (and fundamental) condition that would allow it to decline farthest and fastest (not advice, not a recommendation).

Wyckoff analysis along with Livermore’s strategic approach that’s coupled with Loeb’s ‘focus’, has led us to (shorting) this sector exclusively.

Strategy, Tactics, Focus

Biotech SPBIO, Weekly Close

Looking at the far-right side of the chart, SPBIO rallied this past week. It looks like it may head higher … that is, until we put in the trend-lines.

Now, let’s put in the trendlines.

Extended trendlines show the downside potential.

We’re about to see how this works out.

Friday’s upward action in SPBIO slowed with inverse LABD, posting narrow (downside) action as well.

Ready to reverse.

Summary

Trading action in the past week amounted to reducing the position size in LABD-22-05, by about 4.6% (not advice, not a recommendation).

If and when SPBIO continues is downward trajectory, that position (shorting via LABD) will again be increased as the market allows.

Stay Tuned

Charts by StockCharts

Note:  Posts on this site are for education purposes only.  They provide one firm’s insight on the markets.  Not investment advice.  See additional disclaimer here.

The Danger Point®, trade mark: No. 6,505,279

No P/E ? … No Problem … Yet

Biotech SPBIO, Has No P/E

Is this like Carvana on steroids?

Looking at the top ten components of the SPBIO sector, making up over 14%, of the weighting, none have a P/E ratio.

The three largest weightings are listed below along with hyperlinks to their corporate summaries or research.

Beam Therapeutics Inc.: BEAM

Twist Biosciences Corp.: TWST

Fate Therapeutics Inc.: FATE

The Return on Equity for the list is Negative – 31.9%

With returns like that, it’s unlikely a positive P/E, is showing up anytime soon.

The Market Itself

Livermore worked to prefect his technique, searching for what’s going to happen in a ‘big way’.

Wyckoff discovered the market itself, decides on its next likely course.

Loeb presented the power of ‘focus’; Concentrated positions that eschewed the mediocre mantra of ‘a well-diversified portfolio’.

It’s important to note, Loeb was the former Vice Chairman of E.F. Hutton. The old commercials from the 70s, like the one linked here, were talking about him: ‘When Loeb talks, people listen’.

The Biotech Short

The vultures are circling this sector.

We’ve already shown in the last update, speculative volume on the 3X Inverse fund LABD, is literally off the chart.

The corporate links above, give us a potential ‘why’ for their short positioning.

All three of those companies have a common theme.

Stay Tuned

Charts by StockCharts

Note:  Posts on this site are for education purposes only.  They provide one firm’s insight on the markets.  Not investment advice.  See additional disclaimer here.

The Danger Point®, trade mark: No. 6,505,279

‘Follow The Money’

Well, Almost … Now, It’s ‘Follow The Volume’

‘Follow the money’ was the clue back in the days of the Watergate scandal.

To unravel the secrets of the break-in, you had to follow the money trail.

Not much has changed since then; except this time around it’s important to look at the volume as well.

The 3X Inverse List

Compiled below, is a list of triple-leveraged inverse funds.

Only one (in bold) has recently posted record breaking volume day after day and week after week.

BNKD, DRV, EDZ, FAZ, LABD, SMDD, SOXS, SPXS, TMV, TZA, WEBS, YANG

From a Wyckoff analysis standpoint and from the volume itself, LABD is clamoring for attention.

The daily chart shows us volume is off the scale.

Biotech SPBIO, 3X Leveraged Inverse LABD, Daily

No other leveraged inverse fund’s chart (in the above list) has this look.

Somebody, Always Knows ‘Something

Wyckoff wrote back in the day, ‘insiders’ can’t leave well enough alone; their greed is too great to keep under control.

They take their information and act accordingly.

Our job is to look for those actions, decipher them, and then ourselves, act accordingly.

Who Could It Be Now?

So, what could it be that would cause ‘insiders’ (and professional speculators) to focus nearly exclusively on biotech and go short the sector.

Hmmm, just what could it be?

Well, the mainstream media doesn’t seem to have a clue either. It’s all a big ‘mystery’ to them (although cracks are appearing).

It’s The ‘What’ … Not The ‘Why’

Both Livermore and Wyckoff admonished us not to focus on the why of market movements. The ‘why’ will always come out later, after the fact.

They were concerned with ‘what’ is happening; is price moving up, down, or going sideways in accumulation.

Summary

There’s no mistake based on the chart of LABD above, something major, potentially long-term, is setting-up in the biotech (SPBIO) sector.

The chart itself tells us to focus specifically on this area (not advice not a recommendation).

With that, we’re about mid-way through today’s session.

Price action appears to be going through a test of yesterday’s reversal.

Stay Tuned

Charts by StockCharts

Note:  Posts on this site are for education purposes only.  They provide one firm’s insight on the markets.  Not investment advice.  See additional disclaimer here.

The Danger Point®, trade mark: No. 6,505,279

The Big Move & The Big Money

Common Characteristics

Everyone talks a big game, wanting to trade like the next Jesse Livermore or James R. Keene.

To aspire and reach the performance level of the legendary, few know, it’s almost a requirement that several fortunes must be won and lost along the way.

That’s why Prechter said it years ago (paraphrasing), ‘It’s best to lose your first fortunes early; that way, you have time to recover.’

One very public and famous ‘recovery’ from a blown account, was Livermore’s trade during The Panic of 1907.

He was flat broke but sensed a big down move about to happen in the markets.

Legend has it, he pawned his car for $5,000; then, using that capital, shorted the market during the panic and profited over $1 million, covering shorts near the bottom.

That was then. Is there a now?

The short answer is yes. Huge moves (especially down) are still a potential.

Let’s take a look at how one opportunity presented itself.

Big Move Characteristics

There are at least three characteristics for a major move:

Price Extreme

Sentiment

Catalyst

To demonstrate how that criteria can be used, we’re going to use one very recent example:

The Carvana Crash

From the all-time CVNA, high of 376.83, set on August 10th, 2021, to the most recent lows (thus far) posted July 14th, this year, was a collapse over -94.8%.

Price Extreme

Carvana Has No P/E and maybe, never had one.

“If your biggest claim to fame is that you ‘invented’ a vending machine … you’ve got real problems.”

With that, and hovering at nearly $380/share, it’s reasonable to say CVNA, had reached an extreme.

Sentiment

To go along with the price and no earnings was the sentiment … literally off the charts.

Used cars, years old, selling above the original MSRP. It was a never-before-seen event.

From a trading standpoint, it does not matter the ‘reason’ for the sentiment; only that the extreme was there.

Catalyst

Now, the hard part. The ‘catalyst’.

Just what was it that pricked the bubble for CVNA?

For our example, it looks like it was one sub-par earnings release too many. At the time of release, there was a subtle change in the character of price action.

About one week after the earnings release in August 2021, CVNA, broke a long-term trendline and never looked back.

Summary

The above example has been highly simplified for brevity.

Even so, we can still use these criteria to look at other market conditions … other sectors.

As you may have guessed, one sector that meets at least two of the above conditions, is biotech, SPBIO.

The third (Catalyst) condition may have been met this past week on August 3rd, with this report. Another link is here.

The take-over candidate GBT, releases earnings on Monday (tomorrow).

Let’s see what happens next.

Stay Tuned

Charts by StockCharts

Note:  Posts on this site are for education purposes only.  They provide one firm’s insight on the markets.  Not investment advice.  See additional disclaimer here.

The Danger Point®, trade mark: No. 6,505,279

Real Estate … Critical Mass

Struggling to Break Out of Wipeout

It’s still early in the session and it looks like real estate’s in serious trouble.

A change of events putting IYR declining at – 99%, annualized.

Several charts of real estate IYR, are presented below; not the least of which is the location of the first ‘DRV’ (3X inverse, IYR), entry.

Strategy, Tactics and Focus are the three tenets laid out by Livermore, Wyckoff and Loeb respectively.

Strategy: The real estate sector is ‘finished’ for this bubble go-round. Look for significant medium to long term trading (position) opportunities.

Tactics: Use Wyckoff analysis to identify the exact location where risk is least; The Danger Point

Focus: Significant trading opportunities are rare. When one is found, it must be used to its fullest extent.

This site presents the method above, in real-time.

The first chart of IYR shows the location of the initial DRV entry (not advice, not a recommendation).

Real Estate IYR, Daily

Positioning short this sector has been fully documented here and here.

As a result of yesterday’s action, also anticipated and documented here, the sector may have pivoted into a sharper trend; a trend declining at – 99%, annualized.

Is that a hyperbolic statement? Not if it happens.

As this post is being created, we’re going to look at the hourly chart of IYR (below) and show that price action is struggling to stay away from that -99%, trendline.

IYR: Hourly Chart

We’re at the top of the hour (11:00 a.m., EST) and the hourly candle may have just confirmed the new trend.

Summary

As said many times on this site, when or if, a major break occurs, there will be no getting in or out (not advice, not a recommendation).

At this juncture, now fifteen minutes past the top of the hour, price action is still struggling.

If it continues lower, does not break the trendline and prints below last week’s low of 92.89, it’s a serious event; more confirmation of the new down-trend.

Stay Tuned

Charts by StockCharts

Note:  Posts on this site are for education purposes only.  They provide one firm’s insight on the markets.  Not investment advice.  See additional disclaimer here.

The Danger Point®, trade mark: No. 6,505,279