Trading A Silver Collapse: Part 2

No One Expects The Bulls To Fail

How can the bulls fail with all the ‘money printing’ and rampant fiscal irresponsibility?

It’s a sure thing … a slam dunk.

That is, until it’s not.

The day for silver and gold to start a sustained rally, was yesterday.

Yesterday, both GLD and SLV closed slightly higher and left the window open for a follow-on move upward.

It didn’t happen.

However, neither index has posted a new weekly low; that leaves an ever so miniscule chance, price action could mount a rally.

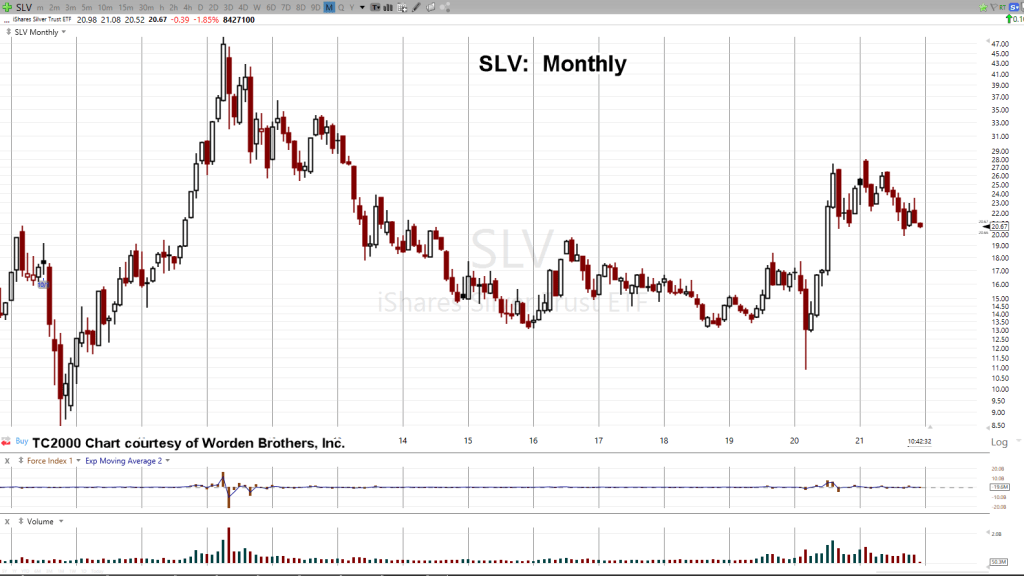
At this juncture, it’s still possible we’re in a move up to the SLV 19.50-area; that appears to be low probability based on the monthly chart of SLV, below.

Trading Vehicles

Other than owning the physical metal (discussed in the last post), the most common trading vehicles are Futures, ETFs and Leveraged ETFs.

Of those vehicles, futures contracts and especially the micro-contracts, are illiquid.

The futures market for silver is thin; that makes getting impaled by a low-liquidity spike a very real possibility.

For the purposes of trading an extended or sharp decline, the vehicles of choice (for my accounts) will be leveraged ETFs (AGQ, ZSL) and the physical.

Follow The Money

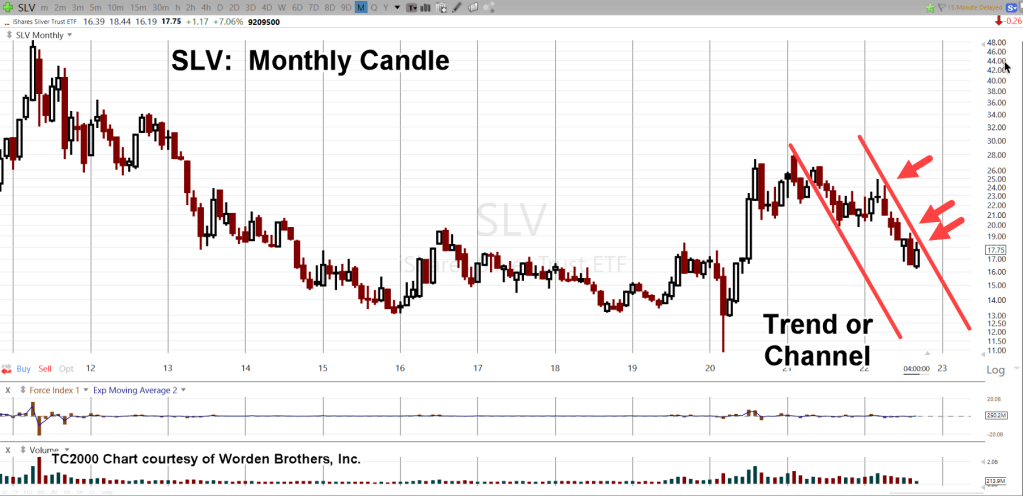
Depending on how you look at the monthly chart of SLV, price action’s either following a down-trend for the past seven months or has been in a trading channel for the past 17-months.
Zoom Chart

Summary & Strategy

It’s generally agreed, having some amount of precious metals is a good idea.

What’s being presented here and potentially on a go-forward basis, is strategy to position for windfall profits (or to acquire physical) during a mass-psychosis event; where it looks like (albeit temporally) precious metals and specifically silver may be of no value.

We’ve already seen over the past two years, how a wide swath of the public can be easily manipulated. Why not manipulate them to think they need (or will be forced) to dump precious metals?

Next Update

We’ll discuss how precious metals could be heading for a sustained or sharp decline, Fed announcement notwithstanding.

Stay Tuned

Charts by StockCharts

Note:  Posts on this site are for education purposes only.  They provide one firm’s insight on the markets.  Not investment advice.  See additional disclaimer here.

The Danger Point®, trade mark: No. 6,505,279

Silver … Cue The Hype

What If Europe Abandons ‘Green Energy?’

The ‘Texas Freeze‘ laid bare the farce that is ‘renewable’ energy.

Will this coming winter do the same for Europe?

Like a limpet on an ocean liner, the ‘silver squeeze’ idea won’t go away.

Here we have yet another report; linked here.

The data in the report’s not in dispute. If that data is to be believed (no reason not to), silver stockpiles are shrinking.

Even so, the major trend-change (down) in silver was identified way back in February of 2021; reports are linked here and here.

The second report stated silver had ‘changed hands’ from strong to weak.

It’s been nearly 20 months since then; silver remains below that February 1st, 2021, level and is down -35.7%, as of Friday’s close.

I like silver as much as the next guy but what we’re discussing here, is strategy.

Silver To Single Digits?

Is that even possible?

Well, was oil going negative possible?

Not until it happened.

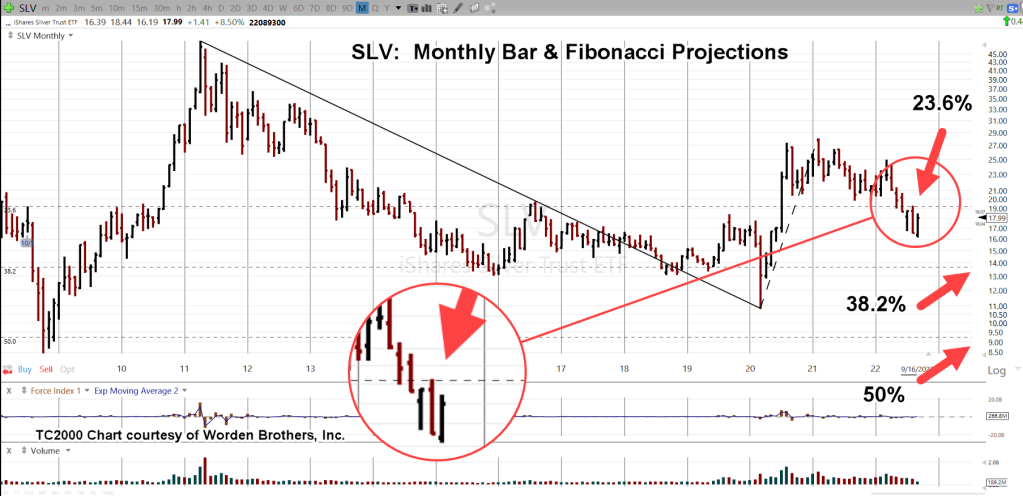
The monthly chart of SLV below, has a standard Fibonacci projection shown. Note how at 23.6%, the projection shows price action tapped and reversed down.

Next up is 38.2% at around 13.75, and then 50%, below the 10-area.

Silver SLV, Monthly Chart

Zoom version

And then, a trading channel.

Both silver and gold, are at The Danger Point.

Gold has pushed below support and is currently in Wyckoff spring position.

Silver is below the 20-area, which is established support.

If a rally is in the cards, this is the place to start.

A failure to move decisively higher at this point signals the potential for much lower prices ahead.

Summary

The next update will discuss various tactics that could be used if/when there’s a major downdraft.

Stay Tuned

Charts by StockCharts

Note:  Posts on this site are for education purposes only.  They provide one firm’s insight on the markets.  Not investment advice.  See additional disclaimer here.

The Danger Point®, trade mark: No. 6,505,279

Silver’s Bull-Fight

Wedge Breakdown, Imminent?

Like a stubborn mule, silver’s just not going along with the ‘hyperinflation’ narrative.

How many years of mainstream ‘breakout’ forecasts, has it been?

‘Silver upside breakout just around the corner’. ‘Silver to launch higher because of inflation’. ‘Silver physical shortage to expose futures manipulation’ … and on.

It’s not happening. Why?

Silver, more so than gold, is an industrial metal. In that sense, more like copper than gold.

That said, silver’s price action alone, tells us (along with copper) we’re in an imploding economy.

Before we get to the charts, let’s review what was said at the last update on silver (emphasis added):

“Since gold (GLD) is in position for an upward test of its wedge breakdown (chart not shown), it’s reasonable to expect another bounce off support for silver.

Using the ‘rule of alternation’, we already had a brief move off the first support level before reversing.

The next contact at lower support, will likely bounce for longer or not at all.“

Well, ‘bounce for longer’, is exactly what we got.

The prior bounce from low to high lasted 11-trading days (5/13/22 – 5/27/22). The current bounce lasted nearly twice as long; 20-trading days.

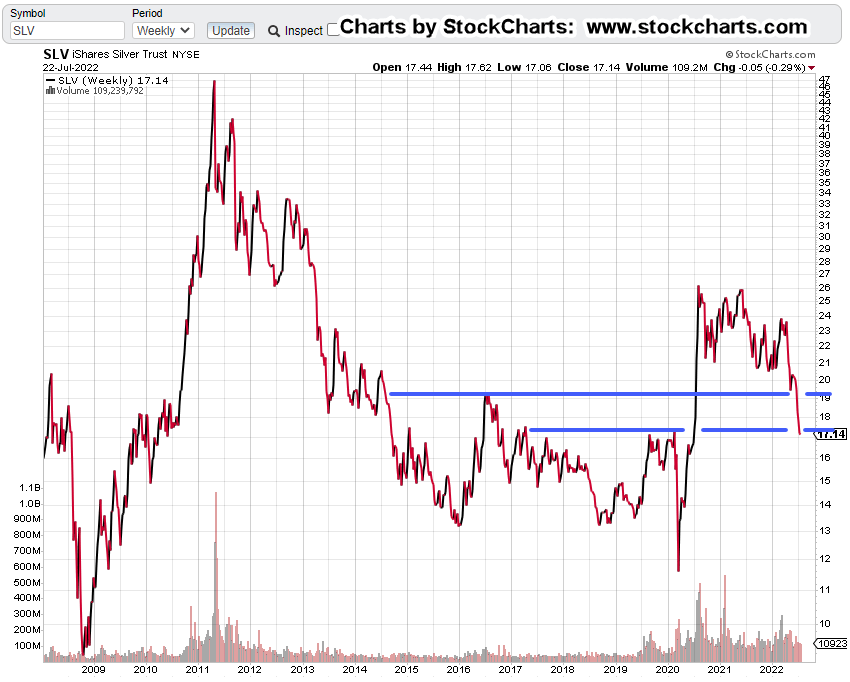
Silver (SLV), Weekly Close

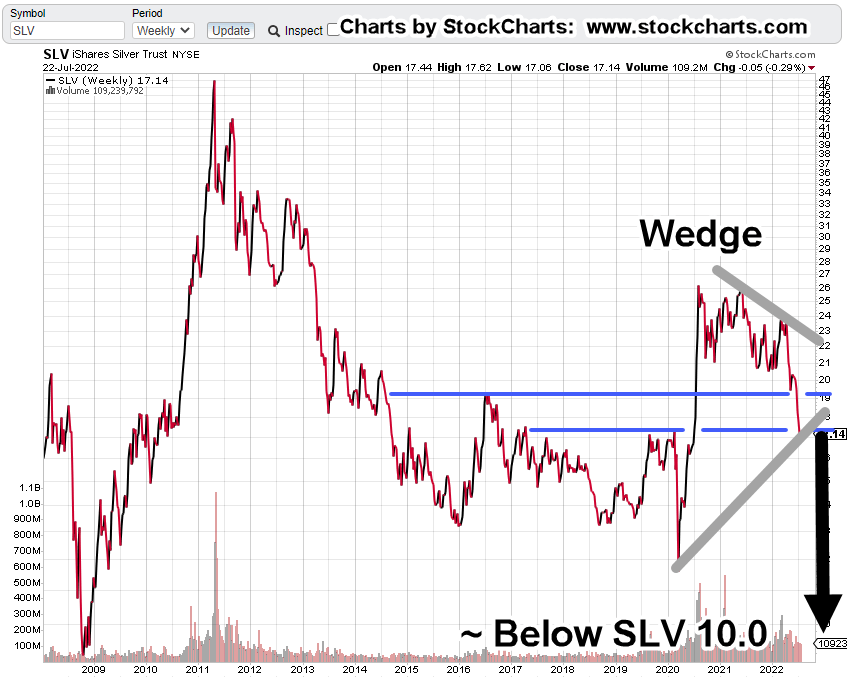
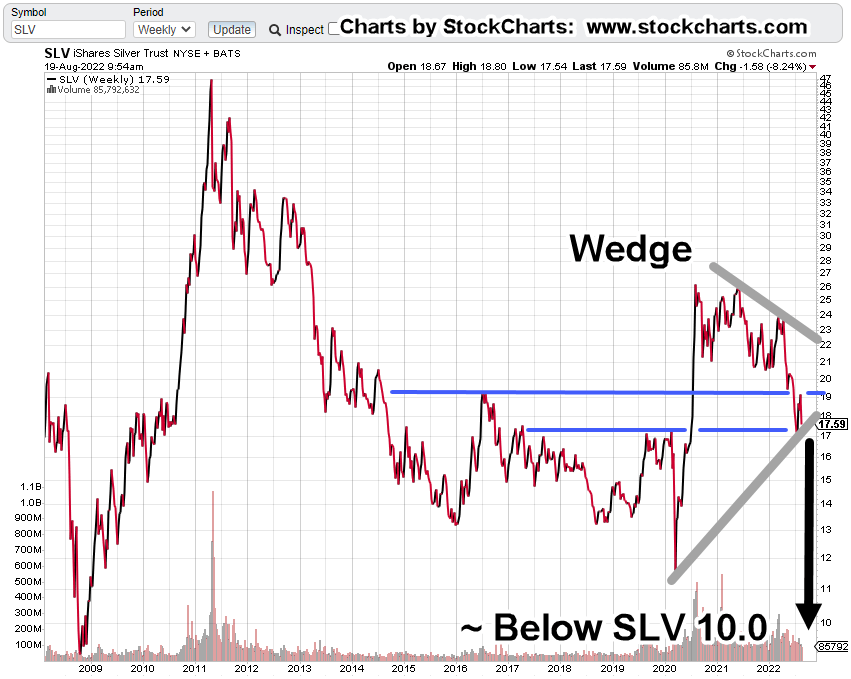
Since the last update, price action bounced off support, confirmed the wedge, tested upside resistance and now, back down to the wedge boundary.

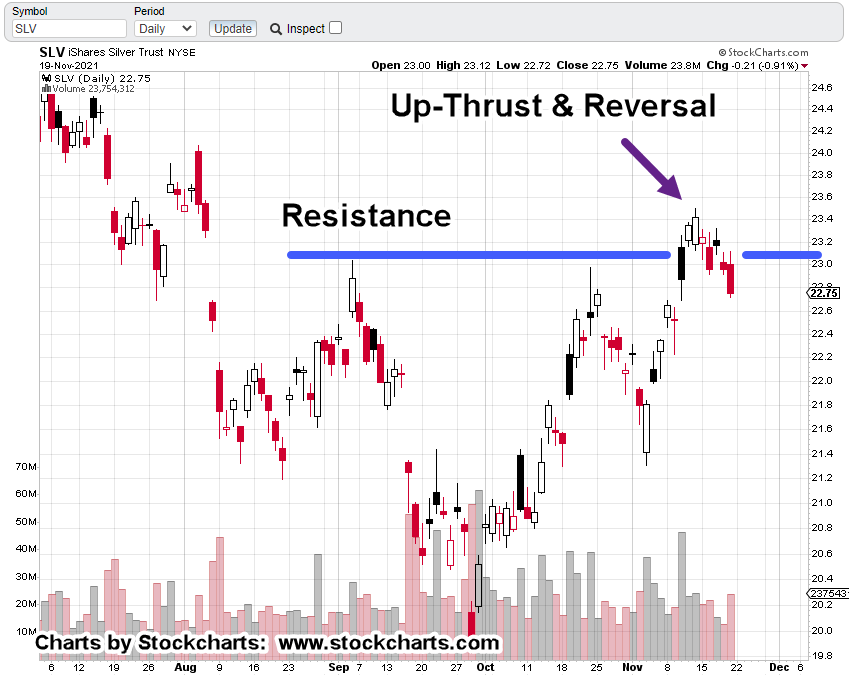
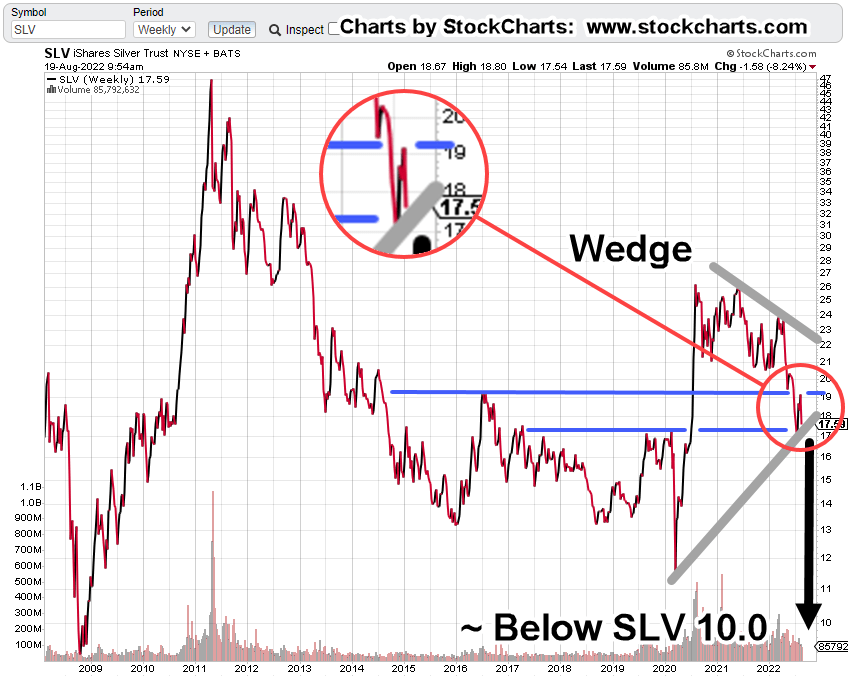
The zoom chart below shows the detail of the resistance test and reversal.

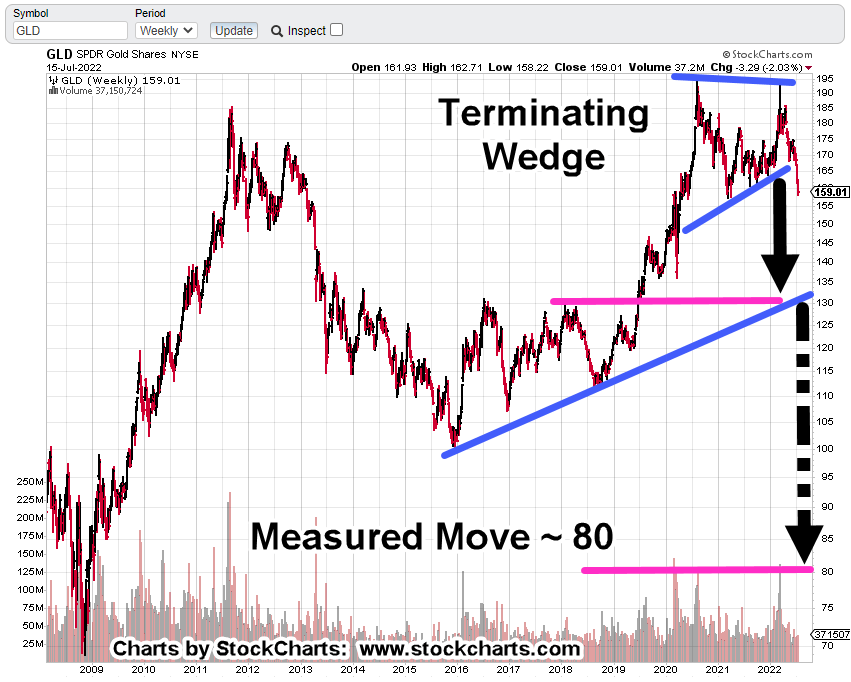
If SLV posts a decisive break below the wedge boundary, standard traditional charting technique provides a downside target in the vicinity of SLV 10.0, or slightly below.

Summary

As always, anything can happen. If silver decides to start posting bullish action, the analysis will be changed.

At this point, with growing fundamentals of economic collapse, i.e., Great Depression 2.0, silver’s price action is fighting the bulls (and winning), thus, confirming the economic decline (not advice not a recommendation).

Stay Tuned

Charts by StockCharts

Note:  Posts on this site are for education purposes only.  They provide one firm’s insight on the markets.  Not investment advice.  See additional disclaimer here.

The Danger Point®, trade mark: No. 6,505,279
Silver’s ‘Mysterious’ Decline

Read The Chart

Media analysts and YouTubers alike, are scratching their collective coneheads.

They’re asking; why is silver down a whopping – 39%, from its print high of February 1st, this year?

If we factor in the high of SLV 48.35 (from April of 2011), silver’s been pummeled – 65%.

With the ‘rampant’ inflation and never-ending money printing, silver (along with gold) should, there’s that word ‘should’, be skyrocketing higher.

It’s an apparent mystery; steeped with smoke-filled back rooms and intrigue.

The ‘Inflation’ Narrative

Let’s help unravel silver’s decline by taking a look at some of the facts.

First up, is ‘inflation’.

The inflation narrative is false. There; glad we got that out of the way. 🙂

How do we know?

We know it’s false because the price action itself, tells us it’s false.

It’s obvious at this point, what we have is supply destruction and not inflation.

The Economic ‘Connection’

Next up, is the economy.

Silver along with copper are industrial metals. They follow the economy … more so with copper. Copper futures are down – 32.5%, from their March 7th, highs.

Coper’s industrial uses are linked here. Nearly half of copper production is for building and construction.

Since the largest real estate bubble in world history has just popped, copper demand is essentially going to collapse.

If at this early stage of Great Depression 2.0, the average person can’t pay the phone bill, where are they going to get any money to drive precious metals demand higher?

Moving on to ‘truth’, we have price action.

Silver SLV, Weekly Close

The chart below has SLV, penetrating one support level (upper blue line) and just now, at the next support.

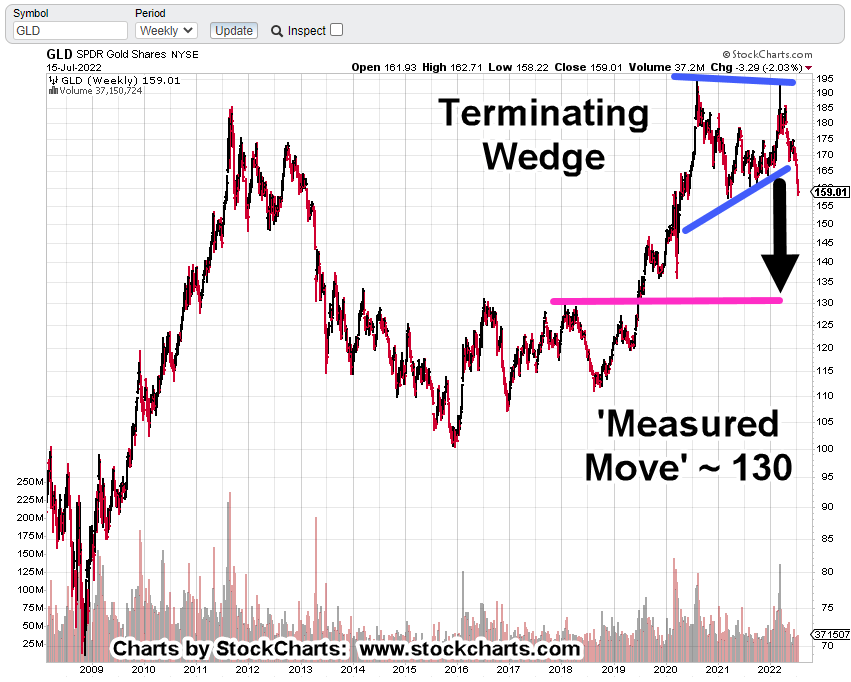
Since gold (GLD) is in position for an upward test of its wedge breakdown (chart not shown), it’s reasonable to expect another bounce off support for silver.

Using the ‘rule of alternation’, we already had a brief move off the first support level before reversing.

The next contact at lower support, will likely bounce for longer or not at all.

If silver can’t go higher … look out below.

Silver SLV, To Single Digits?

The economic depression is just getting started and industrial metals demand is already collapsing.

Although a data point of one, the following is significant.

Supporting the ‘depression’ assessment is this link; specifically, time stamp 3:20, with a recent graph of housing listings in California … going vertical.

SLV, is in position to test higher; thus, confirming the wedge pattern (grey lines) shown below.

Added to that pattern is a measured move target should SLV, break down to lower levels after an upward test.

There it is: ‘Mystery’ solved.

Silver is heading lower because price action said it would.

Now, the fundamentals are kicking in to add a potential mass acceleration to the decline.

Stay Tuned

Charts by StockCharts

Note:  Posts on this site are for education purposes only.  They provide one firm’s insight on the markets.  Not investment advice.  See additional disclaimer here.

The Danger Point®, trade mark: No. 6,505,279

Newmont’s New Highs

How Long Will This Last ?

Looking at the charts below, the amount capital being thrown at the last man standing, NEM, is stunning.

A real sustainable precious metals (and stocks) bull market typically starts with the weakest sectors.

They are the ones in the worst financial shape. They are the ones to benefit the most from an increase in metals prices.

That’s not happening.

Instead, we have what looks to be a market thinning out, on a massive scale.

Everything being poured into the leader … Newmont.

The charts below are from Monday’s close. Scroll up and down to get a ‘feel’ for what’s really happening.

It’s a bull market, non-confirmation on a huge scale.

Basically, the rest of the market, the rest of the Senior Miners and Juniors, don’t believe current conditions are sustainable.

How could they be?

Let’s get real and pose even the most basic questions.

How are these operations going to get spare parts or new equipment for their operations? How are they going to feed their employees?

Lastly, what about the ones that have forced their workforce to be injected?

Newmont (NEM), Weekly Close

Senior Miners, GDX, Weekly Close

Junior Miners GDXJ, Weekly Close

The price action alone, tells us capital is flowing out of all sectors and into Newmont (NEM).

Just to make sure the herd continues to herd; that no-one else, is presenting this information, here’s a brief list of recent ‘analysis’.

Me-Too: Gold To The Moon

Will Gold give a Massive Breakout From it’s Sideways Trend ? Lyn Alden Prediction

Gold & Silver Breakout | On Track to Go Higher

GOLD Prices Will Not Stop RISING!! BUY GOLD Before This Happens.. – Chris Vermeulen | Prediction

Gold Breakout: Breakaway Gaps Confirmed

Silver Will Hit $1200/OZ as Russia Invades Ukraine – Lynette Zang | Silver Price Prediction

Gold price rally will power to $2,700, then $7,400 as ‘perfect storm’ brews – Chris Vermeulen

__________________________________________________

A Different View

Momentum indicators are pointing higher for both gold and the miners … that does not mean it’s a buy (not advice, not a recommendation).

For both GDX, and GDXJ, they’re entering up-thrust (potential reversal) territory as discussed in a previous post.

It’s time to monitor the sector for potential exhaustion and change of momentum.

That momentum could take a while to bleed-off … being patient is just one requirement for successful speculation.

Summary

From the panic, you would think no one’s ever seen a down market. On top of that, we’re potentially just getting underway.

This is the exact environment where Wycoff analysis comes to the fore: ‘What’s the market saying about itself?’

That analysis says, gold and the miners could still push a bit higher but there are huge disconnects under the surface; not the least of which, silver’s also not confirming the move.

More on that, later.

Stay Tuned

Charts by StockCharts

Note:  Posts on this site are for education purposes only.  They provide one firm’s insight on the markets.  Not investment advice.  See additional disclaimer here.

The Danger Point®, trade mark: No. 6,505,279

Silver, Going To Single Digits ?

It’s A Depression

And

It’s An Industrial Metal

They don’t call it ‘silver solder’ for nothing.

As the link above says, it’s almost ‘impossible’ to substitute.

Silver goes into nearly everything electronic.

Depending on whom you believe, the mainstream says the Future’s So Bright … right?

However, the charts say we may be headed much lower.

Remember the silver ‘short-squeeze’ and the little guy putting-it to ‘The Man’?

At this point, the only silver put around is on the little guy.

The Man’s going merrily along; short the sector that was so recently hyped with gold to “$3000 In Months, Not Years”

In Steven Van Metre’s latest update, he said no fewer than three times, the Fed ‘does not print money’.

It’s a false belief (by the public) they’re not about to change.

At the end if his video, he promised a report … or to make accessible his research on how that (not printing) is so.

Bringing us to the market at hand.

Silver (SLV)

Monthly un-marked chart.

The main thing to note above, SLV, is not at new highs.

In fact, at today’s price, SLV is down over 57%, from its all-time high set in April of 2011.

That in itself, should say there’s something wrong with the inflation, hyper-inflation, narrative.

Using a standard Fibonacci projection tool and tagging the 2011 high, the 2020 low, and the 2021, retrace high, we get the following:

It’s a little hard to see … so we’ll zoom in on the right side.

The 50%, Fibonacci projection, is somewhere between SLV: 9.00, and 9.50.

The premise for declining past 38% (around 13.70) and getting at least to 50%, is predicated on the collapse of the economy and subsequent evaporation of silver demand … at least from an industrial standpoint.

The precious metals ‘stacker’, discussed below, might become more interested in obtaining food than continuing to stockpile something that in times of famine, has very little use.

With the SLV chart above, is that even possible?

SLV, to single digits?

Well, can oil futures go negative?

Enough said.

Food As The Weapon

This site’s been steadfast in thinking, it’s the food first, then silver and gold.

Here are two more links to add to our ‘stack’ supporting that assessment.

The Stage Is Set

Famine Comes Next

As Bjorn says in ‘famine’, come this spring, when the masses realize there will be no (or very little) food and/or you need ‘papers’ to buy food, market pandemonium (if not already) is the likely result; precious metals included.

When To ‘Stack’

So, when will be the time to acquire precious metals (not advice not a recommendation).

It’s deceptively simple; ‘When you don’t want to’.

The time to acquire an asset, is when nobody else wants it … including you.

Positioning short the gold miners GDX, was done when everybody and their dog was a manic bull; screaming an upside breakout was “imminent”.

As Prechter said, positioning opposite the herd involves overriding the limbic system of the brain.

It’s an intellectual (logic-only, thinking) process.

However, overriding the lower brain, i.e., going against the herd, is physically painful.

Excruciating, is a better description.

He went on to say, some of the best traders/speculators he ever knew, were former Marines.

Positioning

Coming up (most likely tomorrow) will be a chart showing positions opened in GDX inverse fund DUST (not advice not a recommendation).

There’s no obligation on this site’s part to reveal that information.

However, it will help explain how the market itself directed trading actions.

It will also show how the on-going reversal corrected several entry errors on my part.

Stay Tuned

Note:  Posts on this site are for education purposes only.  They provide one firm’s insight on the markets.  Not investment advice.  See additional disclaimer here.

The Danger Point®, trade mark: No. 6,505,279
Silver: Leading The Way, Lower

Already Below Resistance

While gold (GLD) is just above its resistance breakout, silver’s not waiting around.

It’s already below its breakout; apparently leading to the downside.

Using ‘boots on the ground’ type reporting from sources like Jerimiah Babe and Dan (I Allegedly), the financial collapse is accelerating.

The metals look like they’re not exempt from financial conditions (deflation); they’re at the cusp of reversal.

Silver (SLV) Daily Chart:

The next chart zooms in on the reversal area.

It’s clear; SLV is now below resistance … a bearish indication.

At some point and if you live long enough (and have a working brain) you realize it’s all about manipulation.

Everything is manipulated.

Separating from that trap is akin to mental bravery; setting you apart from the mindless herd and at times, in opposition to that herd.

Silver (SLV) is down a whopping -53% from its high set over a decade ago in April of 2011. How can we be in inflation or hyperinflation?

That’s to come … maybe.

Right now, silver’s giving us a signal; lower prices ahead.

Stay Tuned

Charts by StockCharts

Note:  Posts on this site are for education purposes only.  They provide one firm’s insight on the markets.  Not investment advice.  See additional disclaimer here.

The Danger Point®, trade mark: No. 6,505,279
Silver … Heading Lower

2:41 p.m., EST

‘Short Squeeze’ is Over

Those getting that ‘uh-oh’ feeling with their precious metals hoard, being first to recognize the error (not advice, not a recommendation) may be out in front; liquidating to buy storable food, water filtration, protection and power.

Since there’s so much injection ‘resistance’ does anyone really think it’s over?

Next step, starve them out.

Taking a cue from the late Zig Ziglar; he would start his presentations by telling the audience the one that needs to listen most closely, the one who needs to heed (and follow) his advice most, was himself.

‘Walk the talk’ … which he did.

I personally have some silver … even some gold. However, I am following the Biblical (Genesis 41) standard of where we are (again, not advice, not a recommendation).

If I had a massive ‘stack’, there’s a risk I would begin to trust in the ‘riches’ themselves.

All that’s needed is some kind of ransom or cyber attack at major trucking centers to effectively shut down the food supply.

Its already happened with gasoline distribution … trucking companies would be child’s-play.

Here’s a presentation on just how quickly food becomes the main, if not the only consideration when supply lines break down.

The daily close chart of SLV, shows the possibility of a measured move lower to 18.0 – 18.50, area.

The caveat is, once a reversal like that gets going, the hyper–inflationists are going to get very nervous.

Then, if there’s another ‘infrastructure’ event, we could see a mass panic liquidation. The next chess move (food supply) would be obvious; the stackers would be ‘check-mated’.

Russian Ready:

Is it a coincidence the new Russian jet fighter is named: шахматы

That’s pronounced “Shock … ma … Tee” (Check-mate)

They’re standing by while the enemy continues to (intentionally) weaken its own defenses.

Recall, the Russians do not have a ‘diverse workforce’.

Not sure what the Russians would want with a pathetic soy-boy enclave of woke-ness.

Maybe they would feed them to the Chechens. 🙂

Stay Tuned

Charts by StockCharts

Note:  Posts on this site are for education purposes only.  They provide one firm’s insight on the markets.  Not investment advice.  See additional disclaimer here.

Deflation = Credit Destruction

Silver Collapse Ahead?

If and when food shipments halt nationwide and there’s nothing at the grocery store, is everyone going to run to gold and silver?

Will that be the savior?

It certainly wasn’t during the ‘Texas Freeze’. Not even on the list of must-haves.

The next planned event(s) are in plain sight for those who can see.

Mega drought in the corn belt (whether real or not), power substation blows up in Houston (that one was real) and planned destruction (or total control) of semi-trailer shipping (also real).

It’s the food supply and infrastructure first; then gold and silver (not advice, not a recommendation).

The Wells Fargo incident; inflation has likely run its course.

The dollar (and bonds) are in strong upside reversals; gold and sliver are (still) inversely correlated to those markets.

Inflation is credit expansion. Deflation is credit destruction. That’s where we are now.

Analysis: Silver

It’s the job of the mainstream financial media to make sure as many as possible are on the wrong side of the trade.

They have done well with the ‘inflation’ narrative.

Uneducated Economist puts it well; price increases are the result of supply constriction not inflation.

Which brings us to silver.

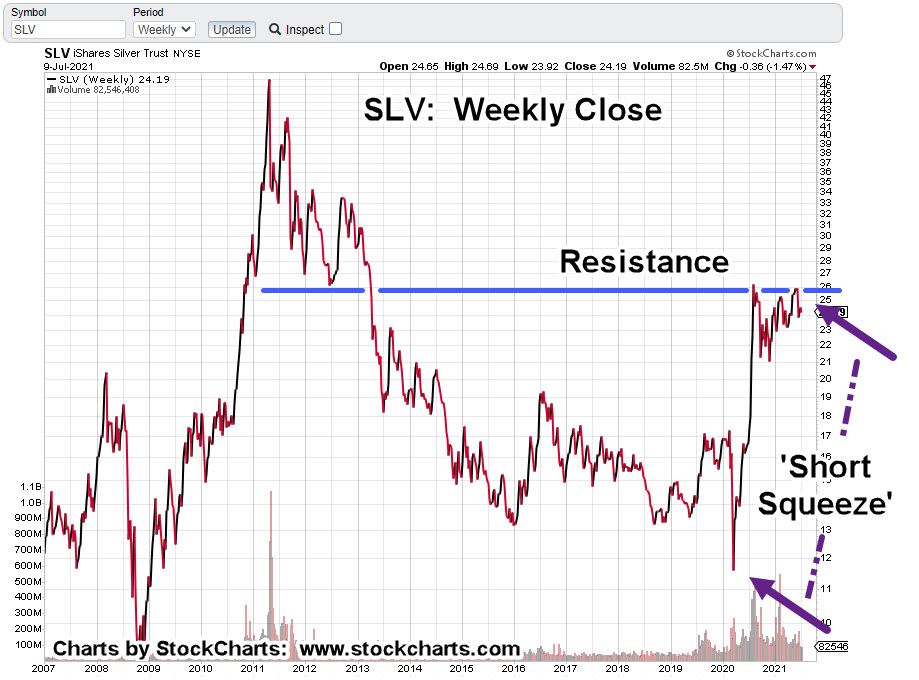
The weekly close of silver proxy SLV, has the ‘short squeeze’ already complete.

Shortages of product, continued inflation pummeling by the press, have not moved the metal higher; that’s the ‘tell’, something’s wrong.

Wells Fargo has kicked off the next round; deflation or deflation impulse.

One has to be prepared; silver may (even if only for a few days or weeks) head down to below where it started the squeeze.

Even to single digits … $9/oz., anyone?

If that happens, it means that gold and silver are being dumped onto the market while everyone’s scrambling for food, water and protection.

Stay Tuned

Charts by StockCharts

Note:  Posts on this site are for education purposes only.  They provide one firm’s insight on the markets.  Not investment advice.  See additional disclaimer here.