‘Holiday Turns’

It’s just a few hours before the futures open and we’re about to see if we have a (continuing) downside reversal.
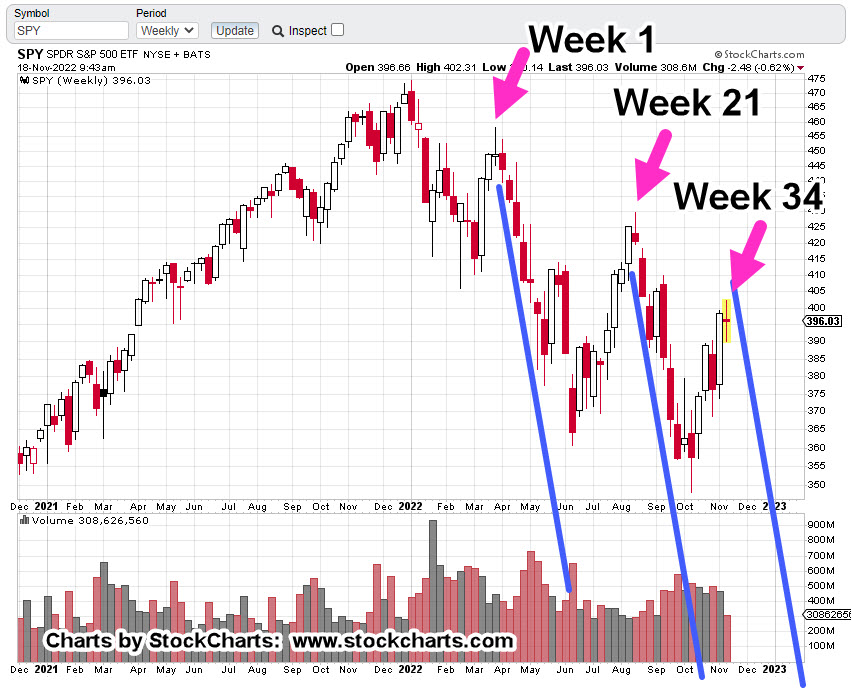
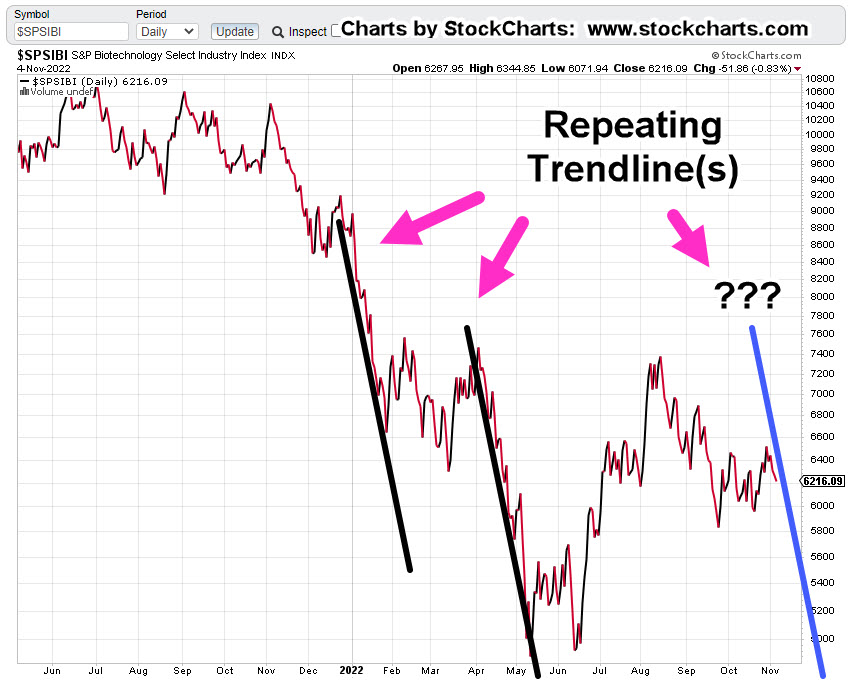
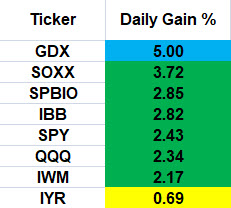
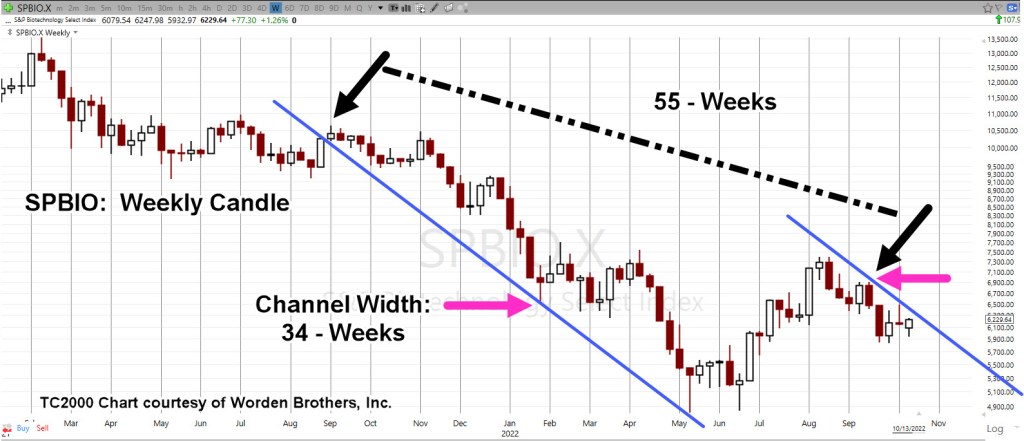
Remember, last week was Fibonacci Week 34, as discussed in this update.
That week’s range was just over 3.1%.
The time before that, similar narrowness Week 21, was around 2.5%.
Perhaps, even more interesting, going back to Week 1, we have yet another narrow range of 2.9%.
We’re about to find out if that sequence of narrow ranges means something or not.
Holiday Turns
This coming week is a holiday week.
It seems appropriate at this time, to re-publish analysis done years ago and currently behind the password firewall of my firm’s main website.
Author’s Note: At the time, I was publishing a daily market summary.
Here it is, from June 27th, 2015 … so long ago.

Market Summary: 6/27/15
The Russell 2000 index has reversed. In addition, the S&P 500 volatility has declined to pre-2008 crisis levels. We now have yet another potential reversal during or just prior to (or just after) a holiday week.
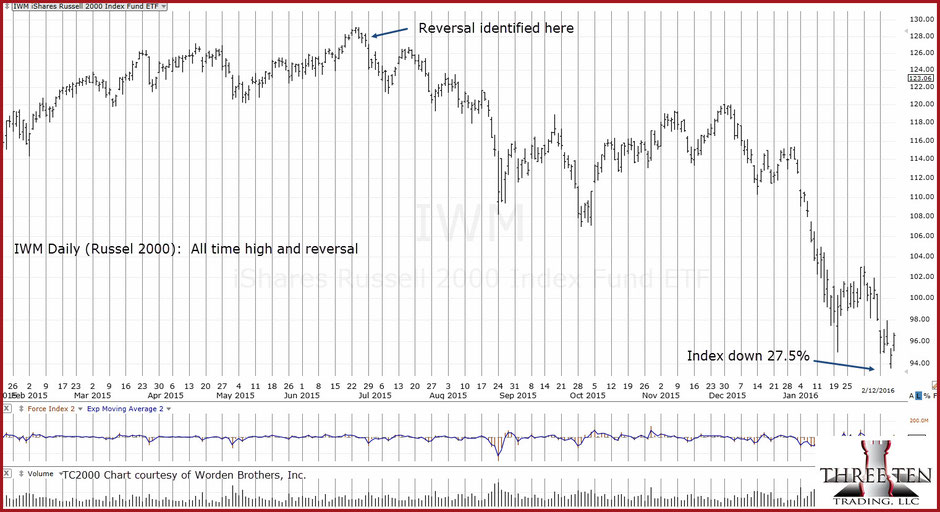
This is how the Russell looked when the reversal was identified.
Author’s Note: The hyperlink above is password protected. The chart below, has been brought outside the firewall.
The following data shows the original analysis (first chart) and then, months later, how that analysis was proven out to have identified the (near) exact moment of reversal.
Continuing on with the original (6/27/15) post.

For clarity, the reversal area of the chart has been expanded below:
Other notable reversals that occurred prior to, during, or just after a holiday week:
Week of 5/23/08: S&P 500 makes a high on the Monday prior to Memorial Day: S&P then crashes over 53%.
Week of 7/3/14: Russell 2000 makes a high on the Tuesday of the July 4th week: Subsequent decline is 9%
Week of 9/5/14: Russell 2000 makes a high on the Wednesday after the Labor Day weekend: Subsequent decline is 12%
Week of 6/26/15: Russell 2000 makes a high on the Wednesday prior to the July 4th week: Subsequent decline: 27%
Going way back: The all time market high of 1929, occurred on September 3rd, of that year. That date was the Tuesday following the Labor Day Weekend. Subsequent decline was 84 – 89%
Author’s Note: Months later, we now have the result as shown below:
Updated IWM (Russell 2000), from time of reversal identification to the low:
__________________________________________________
End of 6/27/15, market update.
Summary
There’s no question the analysis nailed it on the reversal.
From top to bottom, it was a decline of – 27.5%.
Keep in mind, that was back with the Fed was in full control and manipulating higher; now, we’re on the opposite side of the fence.
If there’s any control at all, it’s probably to the downside.
Stay Tuned
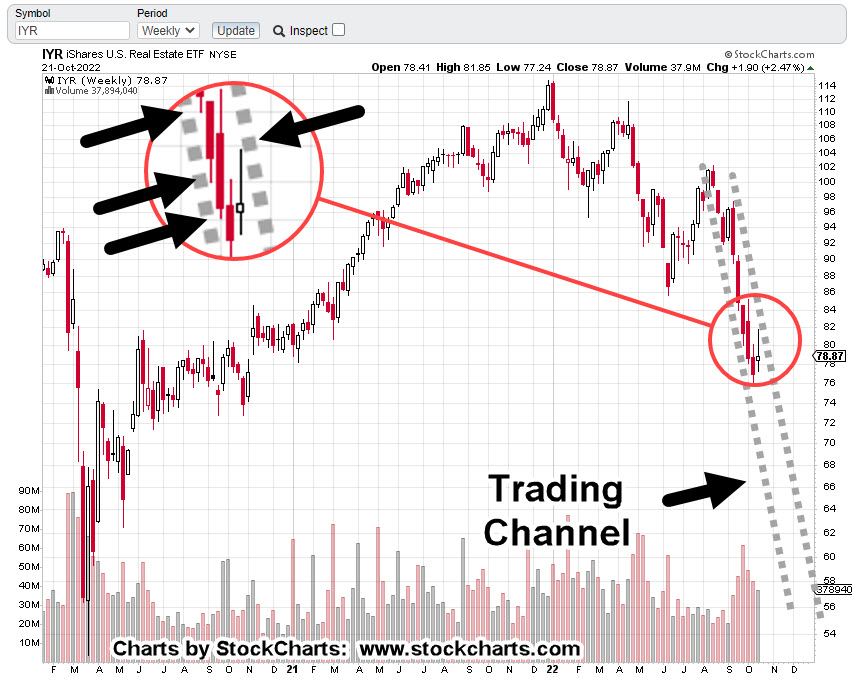
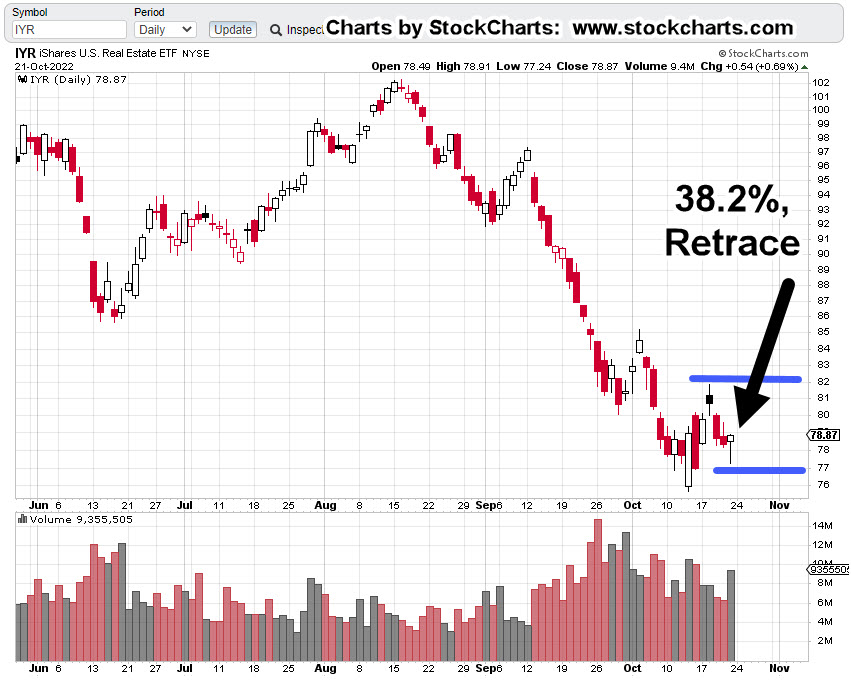
Charts by StockCharts
Note: Posts on this site are for education purposes only. They provide one firm’s insight on the markets. Not investment advice. See additional disclaimer here.
The Danger Point®, trade mark: No. 6,505,279