It looks like having a real (positive) P/E, may be about to be important.
The prior biotech update said that so far, no P/E, negative P/E, and ‘no money down’ was not affecting the sector.
That is, until now.
Well, ok. I made up the ‘no money down’, part. 🙂
That little jest does not take away from the fact, biotech SPBIO, and its top three weightings, BEAM, TWST and FATE, have all reversed, decisively to the downside.
For the week just ended, BEAM is down – 22.86%, TWST down – 19.18%, and FATE down – 14.16%.
Back at the ranch in the IBB index, Moderna (MRNA) is also down – 14.65% for the week.
So, we have confirmation the entire industry is now continuing its downward course.
Contrast the reversal of index SPBIO, at – 7.04%, with S&P (SPY) at – 1.16%, and the market itself is telling us where to go for opportunity (not advice, not a recommendation).
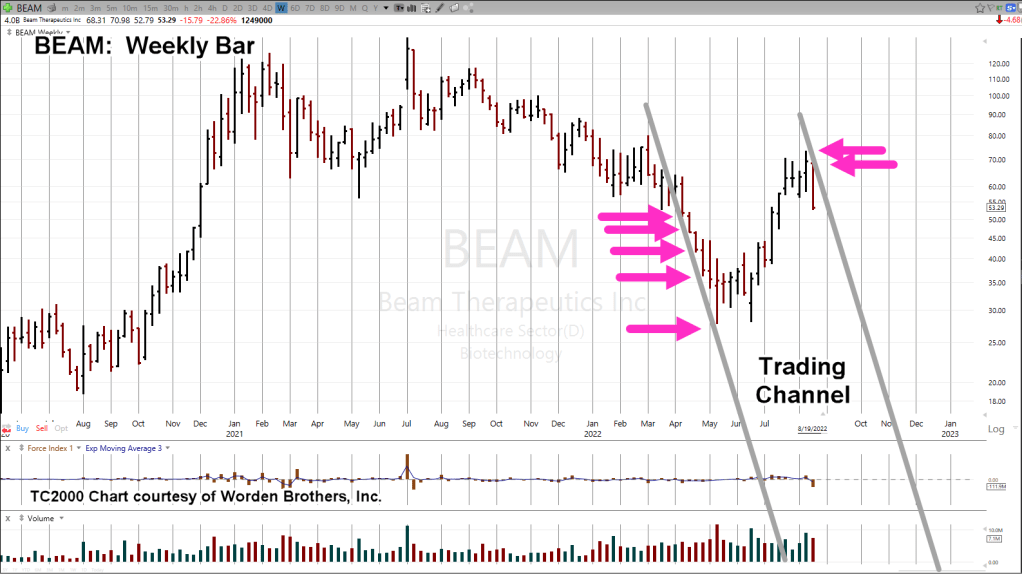
At this point, all three amigos (BEAM, TWST, FATE) are in downward trading channels.
Trading channel for BEAM is the most aggressive. The weekly chart is below.
Beam Therapeutics (BEAM) Weekly
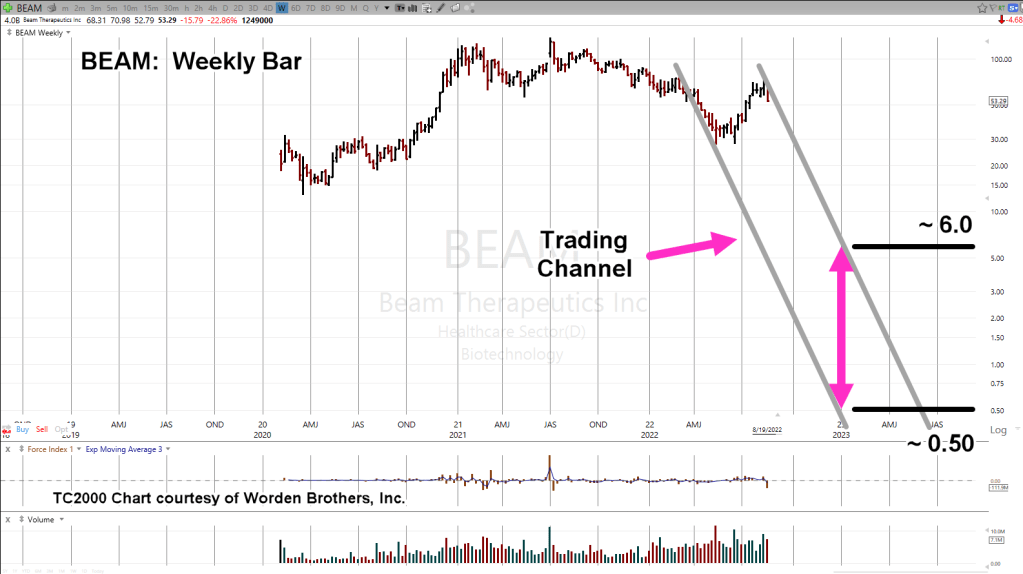
If BEAM maintains its channel for the rest of this year, the chart below shows the target area(s) for price action.
The coming week may let us know if this channel will be confirmed or negated.
Recall, the S&P is topping out and appears to be reversing.
Goldman says the squeeze is over but that ‘downside is limited’.
Note: Posts on this site are for education purposes only. They provide one firm’s insight on the markets. Not investment advice. See additional disclaimer here.
Evidently, according to this out on ZeroHedge, stocks will be a good buy when the Fed pivots; apparently getting back to 2%, inflation.
So many lies, half-truths and pre-suppositions, all in one sentence. Let us count the ways.
Actually, let’s not.
At this point in time, one does not want to draw any undue attention.
A better idea is to see what the market’s saying about itself. This is the crux of Wycoff analysis.
Wyckoff stated a century ago (1902, to be exact), stock prices moved based on an energy of their own; at times, completely disconnected from fundamentals.
Looking at those markets and from my own tracking spreadsheet, 106, indices or equities are currently monitored.
That list will change over time but it’s typically around 100 or more ticker-symbols.
Of that number, the following are those currently in a downward sloping trading channel.
Note: Posts on this site are for education purposes only. They provide one firm’s insight on the markets. Not investment advice. See additional disclaimer here.
On a weekly closing basis (as we’ll see below), it’s obvious.
Upward (net) progress in biotech SPBIO, has come to a standstill.
While the media continues to foment the lie that somehow interest rates have reached their limit, or ‘Da Fed’, is going to do this or that, behind the scenes the plan … set out years ago, continues to unfold.
Before we get to the charts, let’s not forget what’s happening ‘out there‘. The number of idiots seems to be increasing without bound.
As Goethe said way back in 1826, ‘There is nothing more frightful than ignorance in action’. He was being polite with the ‘ignorance’ part.
Now, on to the charts.
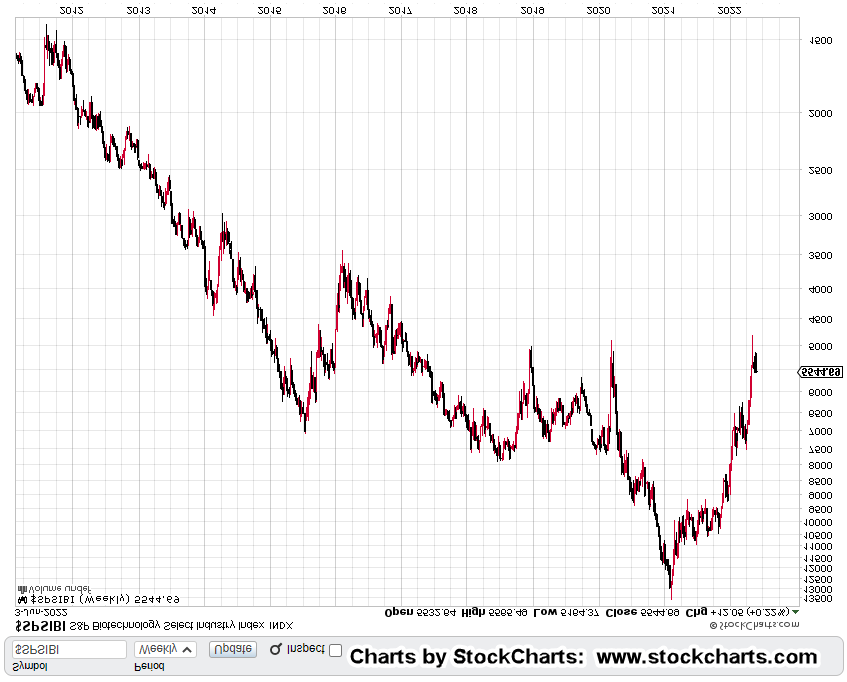
The un-marked, chart of biotech SPBIO, is below.
The second chart zooms-in, showing the percentage changes on a closing basis.
Biotech SPBIO, Weekly
Zoom in, showing net progress.
One would think, since biotech has dropped so significantly, there’s no more (downside) left.
Certainly, anything can happen.
However, the premise is, the overall collapse is still in the early stages.
We have not (yet) had a 50% – 90%, drop in the S&P.
In addition, pension funds are likely to go broke.
So all those $250,000/year ‘retired’ lifeguards that J.B. has spoken about? Well, how do you leverage that ‘skill’ to another industry?
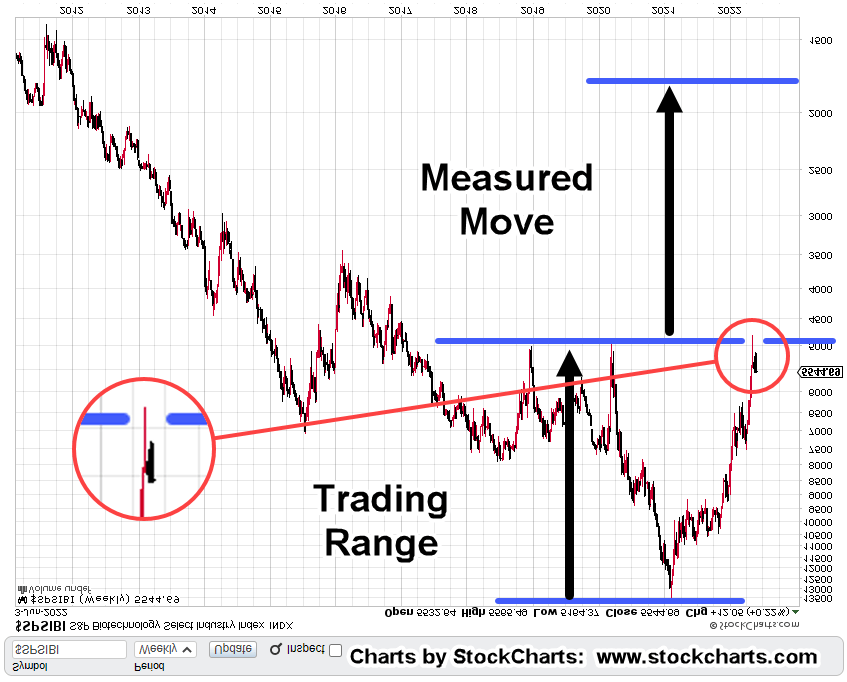
SPBIO, Inverted
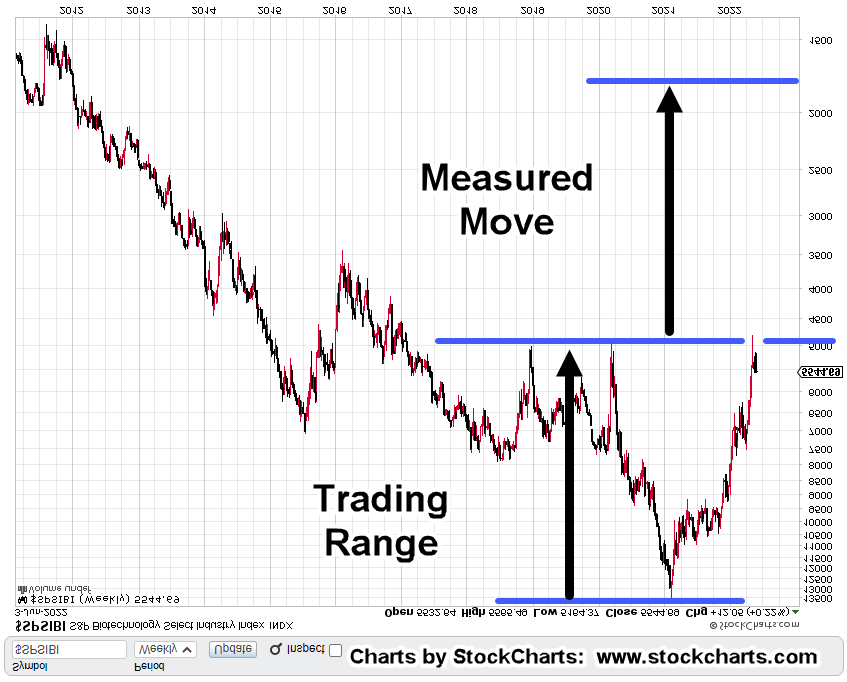
Next up, the inverted chart of SPBIO, to mimic the action seen in leveraged inverse, LABD.
Then after that, is the same chart marked with a potential forecast of where price action may be heading (not advice, not a recommendation).
Now, the markup showing potential action should biotech continue its decline.
Zooming in on the last few weeks of action.
The fact price action has bounced from this area of the chart, tells us the trading range is valid; the blue line is being recognized by the market.
Now as shown, we’ve come to a halt.
So, what happens next?
Positioning
As SPBIO ground its way higher (LABD lower) over the past week, the short position, LABD-22-02, was reduced further but not eliminated (not advice, not a recommendation).
Since there’s no more net progress upward and we’re still in an overall downtrend, expectations are for biotech to either stall, or reverse, continuing its trend lower.
As stated previously in this post, the market’s prior congestion was ‘complex’.
So, we’re expecting ‘simple’ this time around; all of which lends support to more downside.
Note: Posts on this site are for education purposes only. They provide one firm’s insight on the markets. Not investment advice. See additional disclaimer here.
That’s going to age just as well as our picture at left.
Toilet paper across my face, makes me feel so much more safe.
Within the first ten seconds in the link above, Dan from i-Allegedly gets into it.
He still, at this late stage, has people contacting him to say we’re past the bottom.
He summarizes those comments by saying, ‘We’re far from the bottom of anything.’
Then, as if on cue, ‘Economic Ninja‘ comes online to let us know, another 200,000 egg-laying chickens have just been destroyed in a ‘mysterious fire’ … imagine that.
Almost becoming background noise to all this, the S&P 500, in a sharp rally on Friday that looks like it won’t stop.
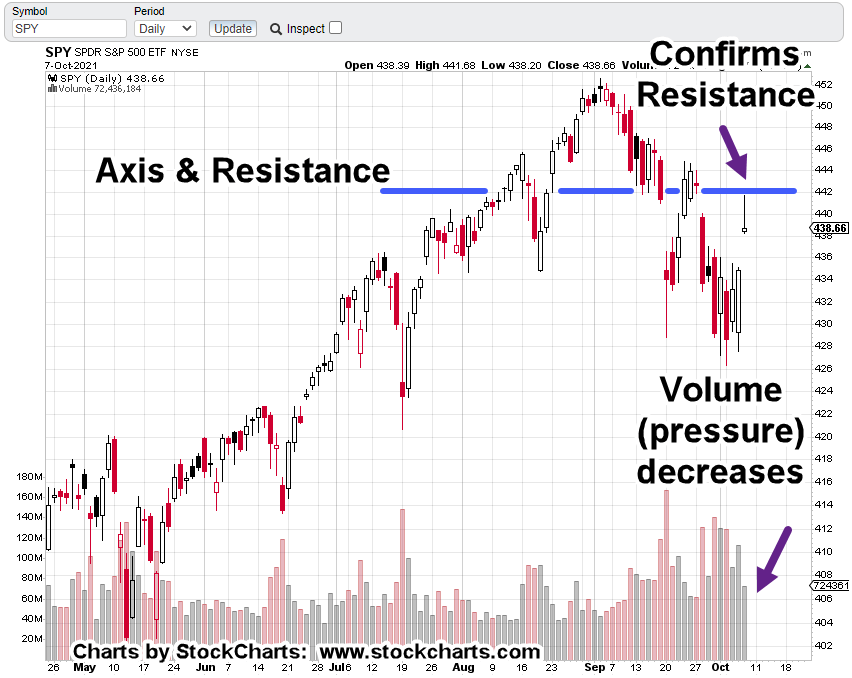
S&P 500, Summary
Friday’s action took the S&P back to test resistance on waning volume while at the same time, posting a Wyckoff spring to up-thrust.
That’s it in a nutshell.
Daily SPY, Close
With markup notes
Getting closer-in on the candle chart.
Futures Market
As of this post (3:31 p.m., EST) the futures are higher by a tad at +0.52%. The question is, will that carry-through into the Tuesday open?
Of course, that’s not known. What we do know however, is that price is at established resistance and in up-thrust (potential reversal) condition.
Even if the ultimate direction for the market is higher, normal behavior would suggest a pull-back to gather more fuel for such an attempt.
Otherwise, we’re at the danger point; conditions have been set for downside reversal.
Note: Posts on this site are for education purposes only. They provide one firm’s insight on the markets. Not investment advice. See additional disclaimer here.
If you’re blowing whatever’s left of your money (or credit), it’s likely you have no real marketable (high pay) skills, no talent, lazy, obese; so, we’re off to Vegas.
Add to that, we’rejust at the start of the depression.
Patera, from Appalachia’s Homestead (time stamp 4:24) addresses the problem a little differently but her final assessment is the same.
It’s true, there are some barriers to learning a new skill.
Dan from i-Allegedly points out the high cost to get a CDL, to be a trucker.
However, those who are awake, those with their nose in the KJV Bible, those leaving the corrupt church (in droves), knew that current events were coming; they took action way before it became obvious.
Yet another indicator of the current strange weather (warfare) that’s going to strain the system.
Here’s the link to the very first post that specifically referenced Genesis 41; posted on December 31, 2020.
As with the ‘Mask on, Mask off (linked above), how has the post aged?
Is it still relevant?
What about this quote … seemed extreme at the time.
They paid for the corn first, with gold and silver. Then they paid with their livestock. Then they paid by selling themselves into life-long slavery. We can equate that last part (slavery) as getting the vax.
No. 5
Chess Board Strategy
It’s a bitter pill to realize we’re in the long game. ‘Normal’, is not coming back … ever.
That does not mean there’re no opportunities. There are.
Those opportunities (if we survive) are/will be potentially life changing for the good.
The Sunday futures market opened about two hours ago and we’re up around +0.40%, in the S&P.
Let’s see if that spills over to the Monday open; remembering that we’re short the real estate sector with the finger on the sell trigger (not advice, not a recommendation).
Note: Posts on this site are for education purposes only. They provide one firm’s insight on the markets. Not investment advice. See additional disclaimer here.
The number of opinions forecasts, pontifications and gesticulations have reached levels beyond the absurd.
Everybody’s important and has some intellectual and/or philosophical missive to promulgate.
We have great levels of insight like the selected items below. As promised, these comments were taken from the article linked in the last post.
“I don’t need to pay some 78 year old to hold 1/2 my money in cash”
“What a joke. We’re heading for multi-year blow-off top”
“78 year old fund manager loses his azz … markets going nowhere but up”
“Parabolic increase to nosebleed levels and an epic explosion 3 years from now.”
Seems our idiot/lazy Boomers, Gen-X-rs, Millennials, Gen-Z-rs, and just about everybody else, is the genius in the room; except for the 78-year-old.
He’s just a buffoon.
If someone has no real skill, experience or initiative, they resort to trash-talk like we see above.
Getting the right experience is the hard part.
Having experience in the markets involves many years of education (i.e. losses).
Just for documentation’s sake, let’s take a look at two examples of what experience looks like; each in their own respective industries.
Exhibit A:
Go ahead, check out this Bubba from Amarillo, Texas.
His customers drive from neighboring states, hundreds, if not thousands of miles away to have him rebuild their transmissions.
Within the first 5-minutes of the video above, there’s probably 30-years of experience on display.
I would suspect his rebuilds go for top-dollar; rightly so.
Then, we have this:
Exhibit B:
Yesterday’s market action, and today’s, has happened before.
That is:
A sharp multi percentage point, headline grabbing spike higher (within a down market), that’s immediately reversed the very next day.
Not only that, but the reversal also signified a bear market had started in earnest.
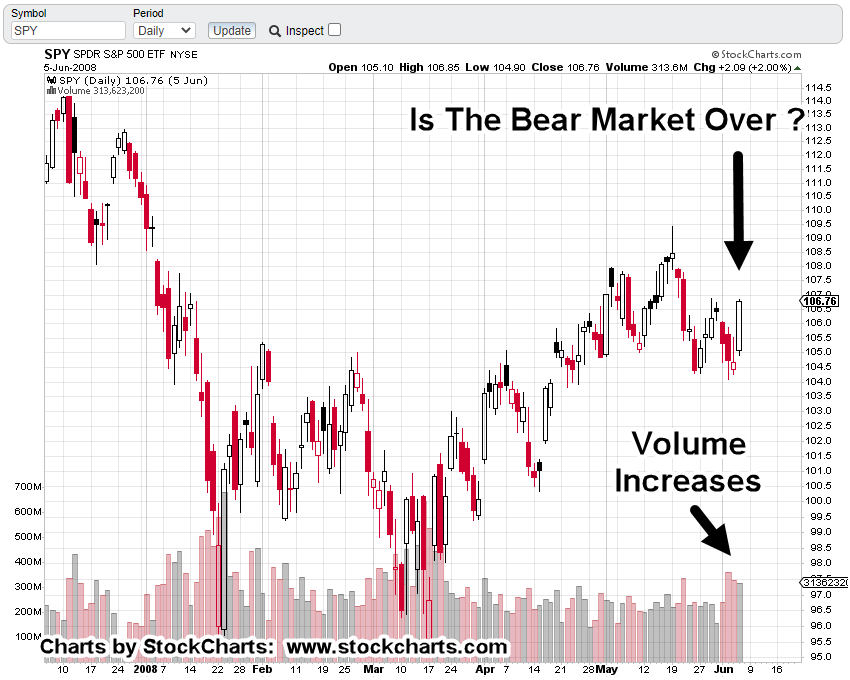
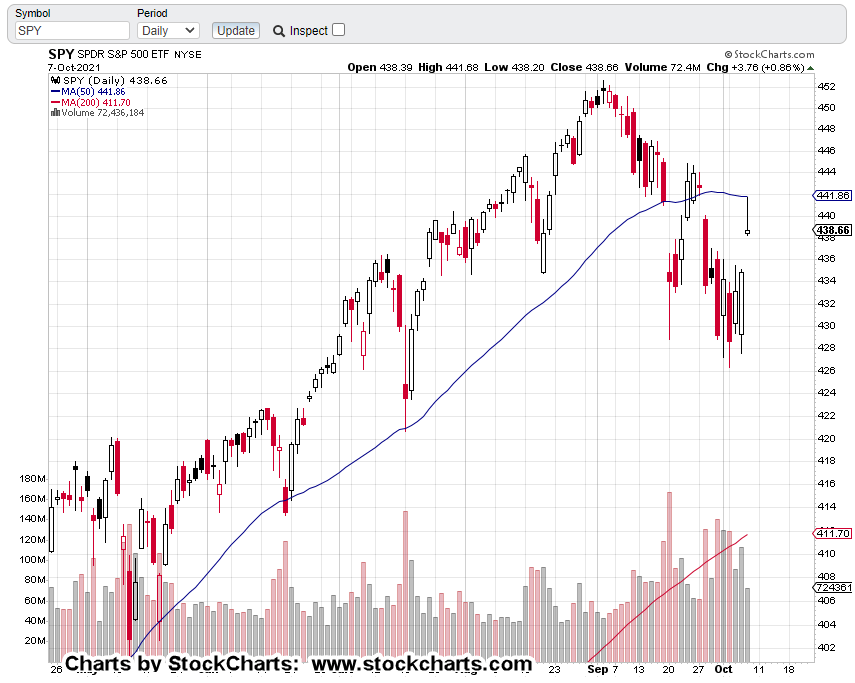
S&P 500, SPY, Daily Chart
Let’s set the stage.
In our example, the S&P had already topped and reversed.
It spent the next seven months heading lower and then retracing upward to an eventual downside reversal.
The next leg down continued, but then a few days later, there’s a massive, headline grabbing, upward spike.
Is the bear market over?
Is this the signal to buy the dip like our ‘experts’ above think for the current situation?
The next day, price action reversed the entire gain (like it has done today).
The chart shows the result.
From a personal standpoint, a 78-year old that’s still mentally sharp enough to provide his services and is not an obvious (globalist) sell-out the likes of which are on CNBC, then I’m very keen on what he would have to say.
His message: It’s the biggest bear market of his life.
Secondly, as Dr. Elder has said, ‘Trading is an old man’s game’. A good memory is critical to creating an edge.
In our example, I remember that upward spike well.
It was a Thursday.
The next day, price action reversed hard to the downside.
It never looked back for nine months.
Summary:
Is the S&P scenario described above, where we are now?
History never repeats itself exactly.
However, one can propose with some level of confidence, if today was the kickoff to the next leg, it has potential to be the fastest, farthest down price action in market history (not advice, not a recommendation).
Note: Posts on this site are for education purposes only. They provide one firm’s insight on the markets. Not investment advice. See additional disclaimer here.
Yesterday’s upside failure (from Monday’s reversal) tells us it’s a very dangerous market environment.
Several YouTubers (here and here) and maybe more, the leaders anyway, have noted they’re providing good-faith analysis and potential tips, but that does not change the fact, ‘You’re on your own’.
The ‘rebound’ that Maverick discussed (second link, above) may have been on Monday and that’s all there was.
Absolutely nothing against him in any way.
If that was it for a bounce, we’re indeed in a very dangerous (to the downside) situation.
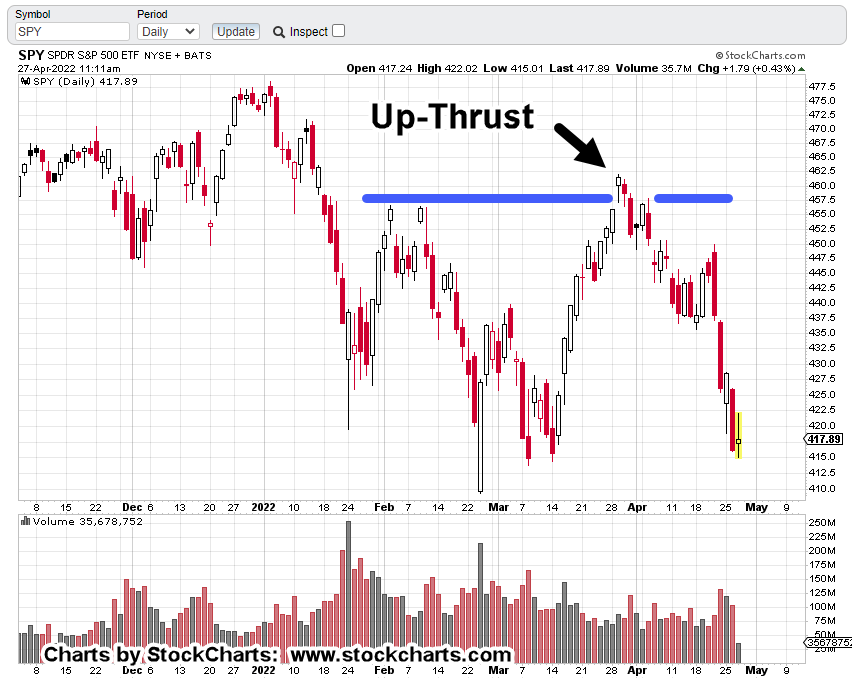
The S&P got itself into a Wyckoff Up-Thrust condition, noted here and shown on the daily chart below.
S&P 500 (SPY), Daily
It’s about midway through today’s session.
We can see SPY price action grinding its way down to support near the 410 – 415, level.
Up-Thrust, headed for ‘Spring’ ?
We already know from empirical observation that markets tend to go from spring to up-thrust.
Does it work the other way around … up-thrust to spring ?
From a personal standpoint, I do not have any data to show that behavior exists.
However, with SPY in its current position (near support) we may be about to see if there’s penetration and then attempts to move higher (i.e., in spring position).
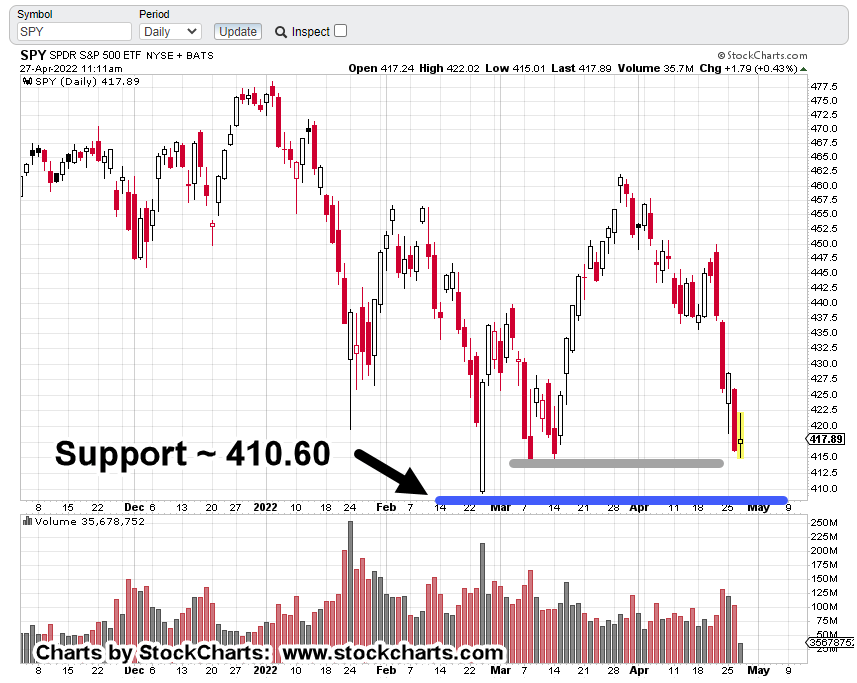
The chart below shows current support.
There would need to be decisive penetration to set up the potential for any kind of sustained rebound.
The blue line is a significant support level.
The grey line just above, is also support, where price action is at the moment.
Penetration of either one sets up a spring.
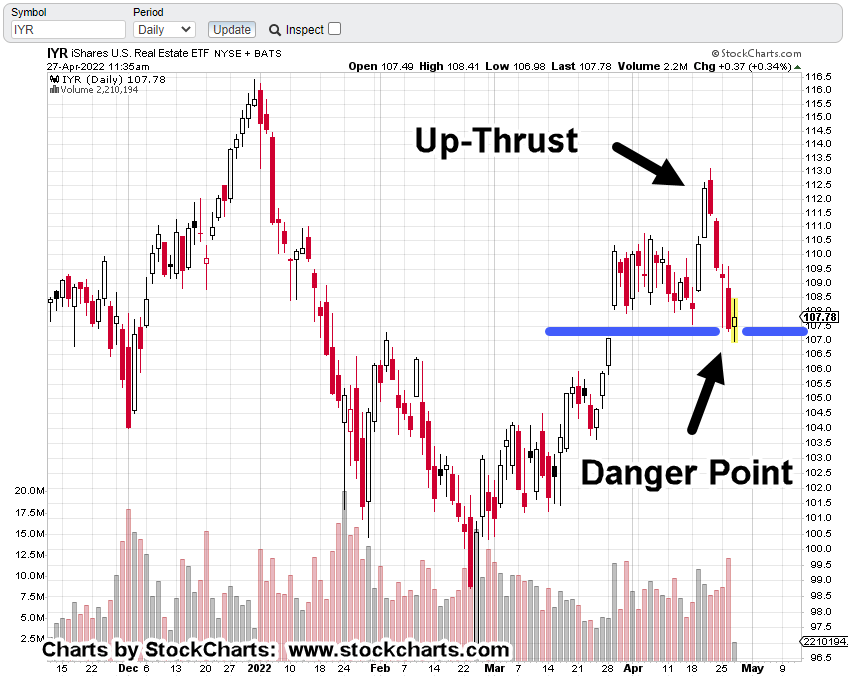
Real Estate, IYR (Daily)
While the S&P fights it out at support, real estate, IYR is doing the same thing.
The previous post was looking for new highs in the sector.
At that time, it looked to be 50/50, odds of doing so.
Now, we’re right at the danger point.
It won’t take much for price action to confirm a spring or a break to lower levels.
It looks like we’ve already had an up-thrust which seems to point probability lower.
With the overall markets, the S&P at support now and deep oversold, points the opposite way, probability to the upside.
Summary
IYR had a shallow, 38% retrace during yesterday’s session before continuing lower and closing near the low of the day.
As that retrace was completing, a short position was opened via leveraged inverse SRS (SRS-22-01) and the stop set at yesterday’s IYR high of 109.58 (not advice, not a recommendation).
As this post is completing, IYR price action’s laboring to move higher (SRS, lower).
We’ll know soon enough if we’re in a breakdown or a spring.
Note: Posts on this site are for education purposes only. They provide one firm’s insight on the markets. Not investment advice. See additional disclaimer here.
For the evening/overnight session, both gold and the S&P futures have opened lower.
The S&P is down 50-pts, nearly 1.10% (at about 8:15 p.m. Eastern) and already penetrating the last session’s low.
The number of technical factors concerning gold, the miners and especially the Junior Miners GDXJ, is significant.
We’ll cover just a few in this update.
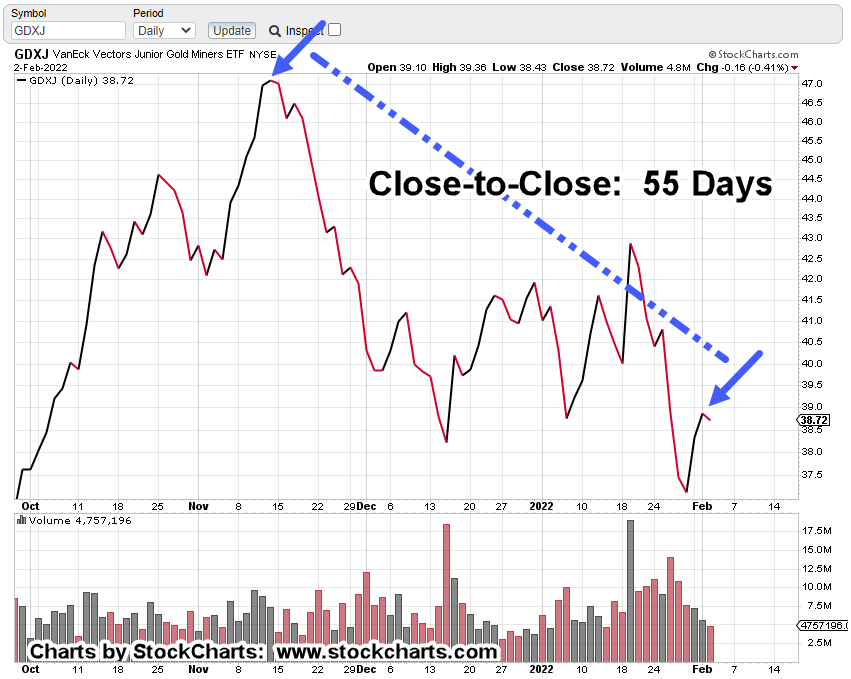
Junior Miners, GDXJ: Daily
The un-marked daily chart shows GDXJ oscillating but in a general downward trend:
The next chart shows price action posted a reversal bar right at Fibonacci 23.6%, for the entire move; from the breakout highs in mid-November ’21, to the lows on January 28th, this year.
A ‘Fib’ retrace of 23.6%, is rare and if it holds, indicates significant weakness.
The next two charts present a case for why this shallow retrace may indeed hold and thus, indicate the start of the next leg lower.
On a print basis, it’s been a Fibonacci 55 (+1) days from the GDXJ print high on November 12th, 2021, to the high posted today (2/2/22).
The next chart shows that November 12th, 2021 was also the closing high of the breakout set-up.
The Important Part:
Yesterday, was the closing high of GDXJ (so far) and that makes it a perfect Fibonacci 55-Days, from peak-to-peak.
The last update on the miners showed significant down-pressure at support levels, unlike previous visits to the area.
Looks like we’ve had the rally that was forecast; that rally may now be fading.
“It’s reasonable to expect an attempt to rally in the coming week … but with this much down force, a successful rally is not the high-probability outcome.”
Gold Could Hold
Already discussed, is the idea, the actual price of gold may hold steady or even go higher and yet the mining sector collapses.
As Dan from i-Allegedly posts in this report, Italian wine makers are having a hard time getting corks for their bottles. That’s right, corks !!!
Does anyone really think a massive mining outfit is going to be able to source all they need to continue operations without interruption?
Let’s not even get started with the ‘sustainability’ corporate failure already baked into the cake 🙂
“For we wrestle not against flesh and blood, but against principalities, against powers, against the rulers of the darkness of this world, against spiritual wickedness in high places.”
Sorry for those who think it’s all a ‘myth‘. I’m with Good Patriot on this one (time stamp 17:09); that we’re in a battle surpassing all that’s come, since 33 AD.
Gold & Silver
Hard assets: Good to have for sure (ammunition, seeds and egg-laying hens may be better) … but if we’re really in a similar event to Genesis 41, that means the corn and grain come first, then gold and silver.
Summary:
This post started with the S&P down about -0.80% and it’s now down -1.10%, posting a new daily low.
Gold is down slightly, holding steady but that’s already been discussed above.
Remaining short the sector via JDST-22-01 (not advice not a recommendation).
Position size on JDST-22-01, has been increased. More on that in the next report.
Note: Posts on this site are for education purposes only. They provide one firm’s insight on the markets. Not investment advice. See additional disclaimer here.
This just out from Activist Post, shows we’re in yet another ‘never before seen’ event.
One of the references in the article can be found at this link.
Many times on this site, the ‘reduction in size’ has been discussed.
Now, the official numbers are starting to show-up. The bottom line? Retail demand is going to evaporate.
As a side note, it’s interesting that YouTube now has videos on how to spot Myocarditis …. something we’ve (in the serfdom) have never heard of … until now.
While everyone seems to be focused on the overall markets, S&P, Dow, and QQQ, underneath the radar, gold and the miners continue to rachet themselves lower.
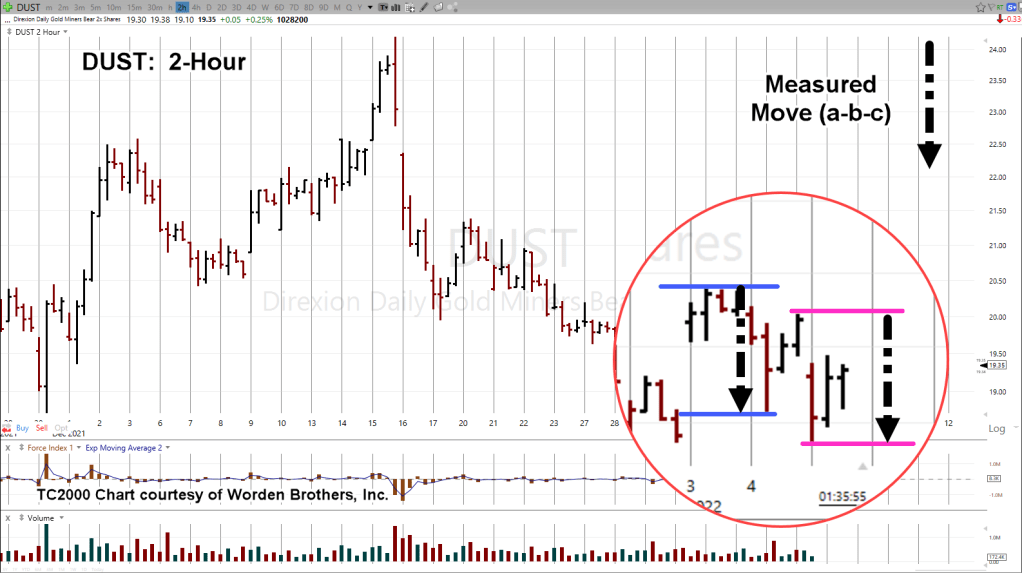
Senior Miners, GDX & Inverse DUST
The 2-Hour chart of inverse fund DUST shows we’re still at the danger point discussed yesterday.
The zoom chart (below) has an interesting distinction.
The distance between the blue-line trading range and the magenta-line trading range, is the same. The black-dashed arrow is equal length.
This implies that yesterday’s move, along with today’s may be an ‘a-b-c’ correction. A counter-trend move.
If so, the main direction has changed from down to up (for DUST).
Summary:
Still at the danger point, we remain short this sector (not advice, not a recommendation).
The good part, if price action reverses in DUST and begins to pressure the most recent lows, it’s an indication something else is afoot and the trade is failing.
Note: Posts on this site are for education purposes only. They provide one firm’s insight on the markets. Not investment advice. See additional disclaimer here.
Note: Posts on this site are for education purposes only. They provide one firm’s insight on the markets. Not investment advice. See additional disclaimer here.