Strange things happen in the markets just before, during, or just after a holiday week.
This time is no different.
With all that’s gone on in the past few weeks, one gets a sense ‘the jig is up’.
One example of the curtain being pulled back on a well-established grift, is this unrelated, but related post, link here.
So, it could be with biotech.
The past two weeks look like a change of character (not advice, not a recommendation).
Biotech XBI, Daily
It’s been a Fibonacci 13-Days since the reversal on 11/11.
The sector has accelerated to the downside on record volume and now, is testing that break.
The ‘Axis Line’, is also the location of the 61.8%, retrace for the current down-move and test.
Although there’s been no new daily low to ‘confirm’ the test is complete, (upside) risk may be at a low.
Positioning
For reasons to be covered in a later update, this sector’s being shorted directly as opposed to using leveraged inverse LABD (not advice, not a recommendation).
Trade is labeled: XBI-24-01
Stop level for the short is (or will be) the session high, currently at XBI 99.79 (not advice, not a recommendation).
Note: Posts on this site are for education purposes only. They provide one firm’s insight on the markets. Not investment advice. See additional disclaimer here.
Market reversals tend to occur just before, during, or just after a holiday week.
Is that where we are now?
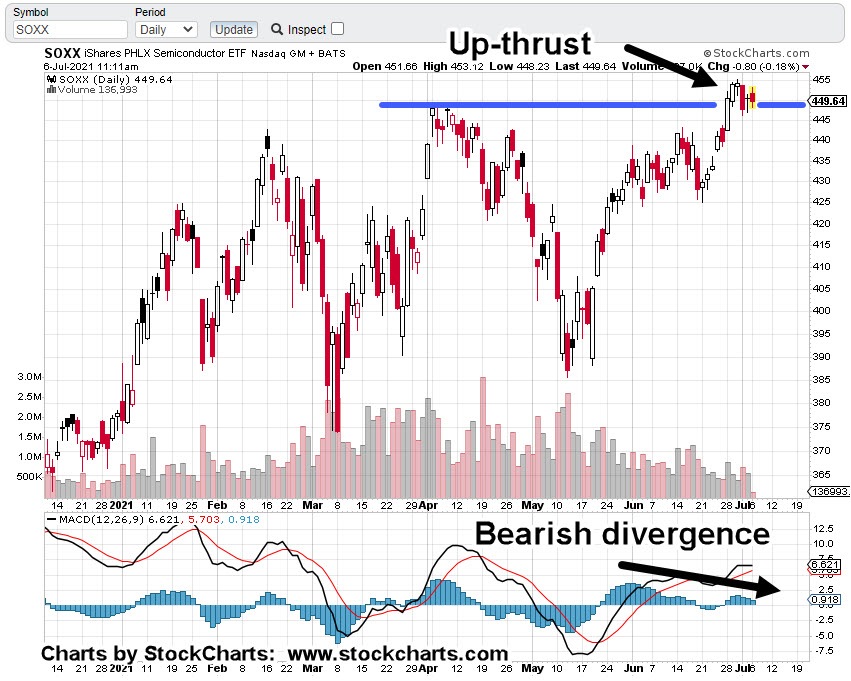
Semiconductors (SOXX), and it’s chief cook and bottle washer, Artificial Intelligence (NVDA), may have already decided the next direction … down.
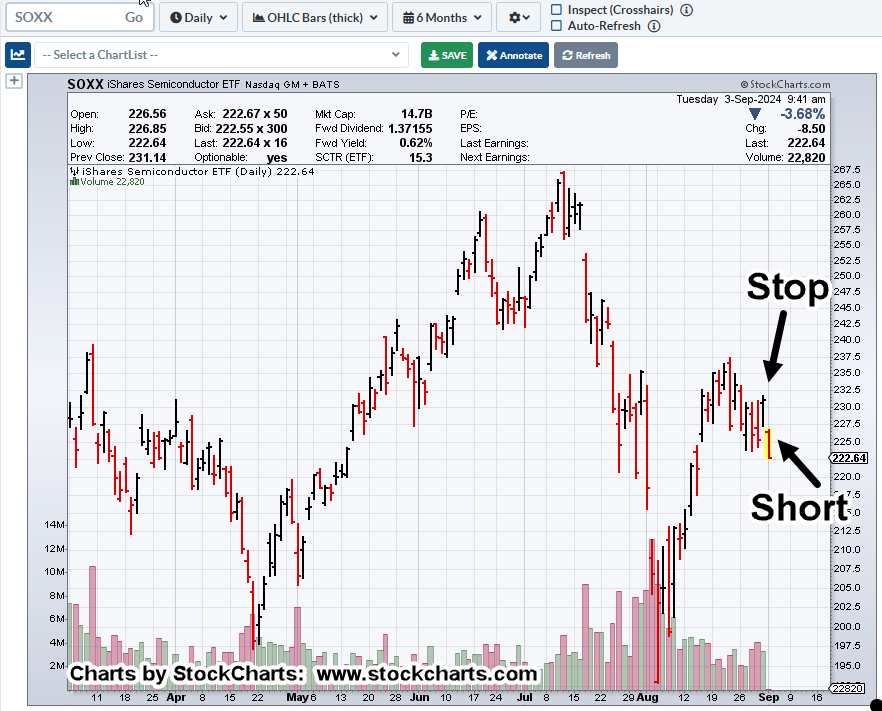
Semiconductors, SOXX, Daily
It’s just after the open and this is where we are.
“What do you see?”
Marking up the chart, we have a sell-short indicator (not advice, not a recommendation) right along with a hard stop location (as shown).
From yesterday’s update, those that watched the presentation by Robert Prechter Jr., were challenged with the idea, we’re in the largest bubble ever or at least since the 1720s South Sea Bubble (not advice, not a recommendation).
Positioning
In the sidebar, we can already see a short position was opened during last Friday’s session: SOXS-24-15 (not advice, not a recommendation).
Everyone has their own style and for me, I detest ‘chasing’ the market.
I’d rather make several attempts, get stopped out, then enter again, than watch the opportunity take off because I was too afraid to pull the trigger.
It’s only 20-minutes after the open and we can see the SOXX, is down hard.
Note: Posts on this site are for education purposes only. They provide one firm’s insight on the markets. Not investment advice. See additional disclaimer here.
Note: Posts on this site are for education purposes only. They provide one firm’s insight on the markets. Not investment advice. See additional disclaimer here.
There are nine other supplemental data points for the economic mayhem, collapse, collapse-in-progress scenario; they are listed at the end of this post.
For now, we’re talking about real estate and specifically the proxy for the sector, IYR.
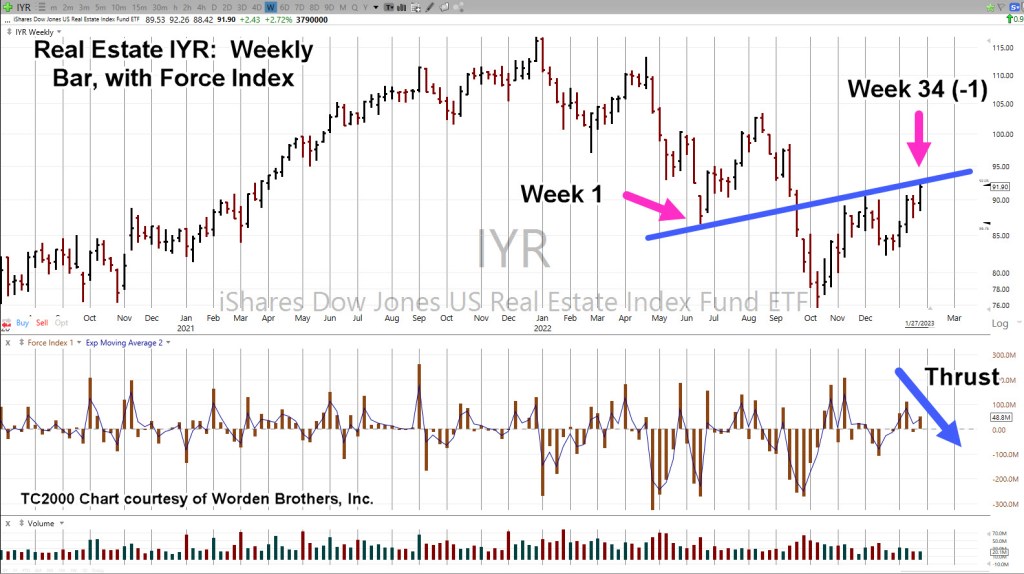
Real Estate IYR, Weekly
As stated in the last post, we’re going to follow-up with a potential IYR, downside reversal by covering three more technical points; Fibonacci time correlation, thrust energy and trading channel.
First up: Last week completed a Fibonacci 34 (-1 week) time frame that may result in a reversal into a trading channel (shown on second chart).
Upward force (Thrust Index) declined significantly over the prior upward push during the week of 1/13/23.
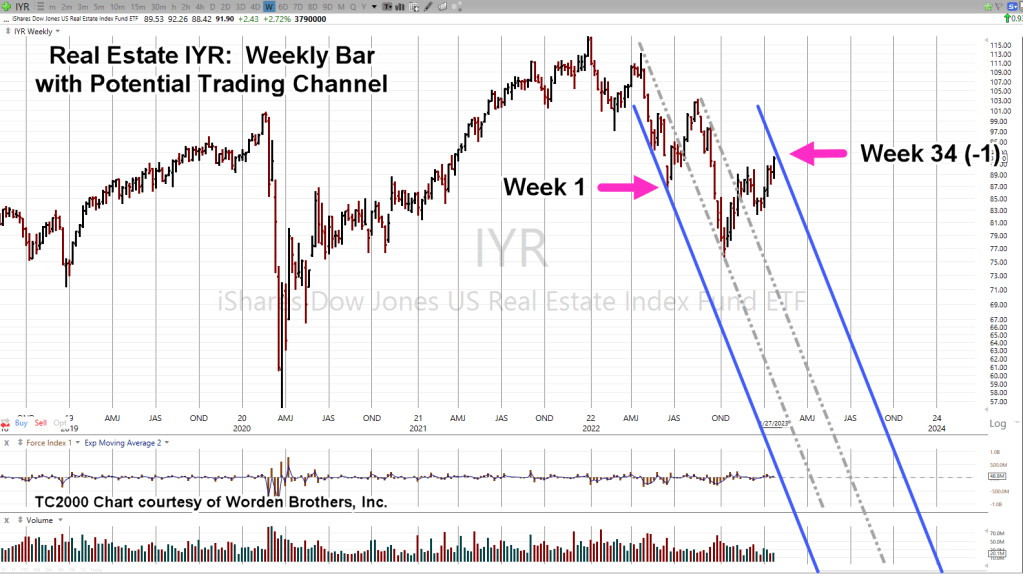
The weekly chart has been compressed and trading channel lines added.
Internal trendlines are printed as grey dashed lines.
As shown, we’re at ‘Week 34 (-1)’.
If this market’s in reversal and adhering to a Fibonacci time sequence, we could see an immediate reversal or another minor high next week to make it an even 34 or go one additional week to make it 34 (+1) weeks.
Either way, we’re at The Danger Point®
The 1929 – 1932 Trading Channel(s)
Here’s a bit of insight you’ll not find anywhere else.
Research and data gathered by my firm, has shown markets tend toreverse just before, during, or just after a Holiday Week.
In our case below, The 1929, all time high was 379.61, posted on September 4th; the Tuesday following the Labor Day Weekend.
The final low and subsequent reversal was 41.81, posted on July7th 1932; the Thursday following the July 4th Holiday:
There are at least three main trading channels in effect for the entire (nearly) three year down move.
Trading channels are an old and repeating characteristic of the markets.
Real Estate Re-Cap
The all-time high in real estate IYR, was 116.89, posted on December 31, 2021, the Friday before the New Year’s Weekend.
Since then, there have been several trading channels in effect; at this juncture, we may have yet another.
With the data links provided at the beginning and the links at the end of this post, sustained price action to the downside is more probable (not advice, not a recommendation).
This coming week is likely to be quite interesting as the Fed continues on its path of price and demand destruction.
Note: Posts on this site are for education purposes only. They provide one firm’s insight on the markets. Not investment advice. See additional disclaimer here.
The Danger Point®, trade mark: No. 6,505,279
Addendum
Congratulations on reading this far. You must be serious about your work. Supporting data for the bearish case is below.
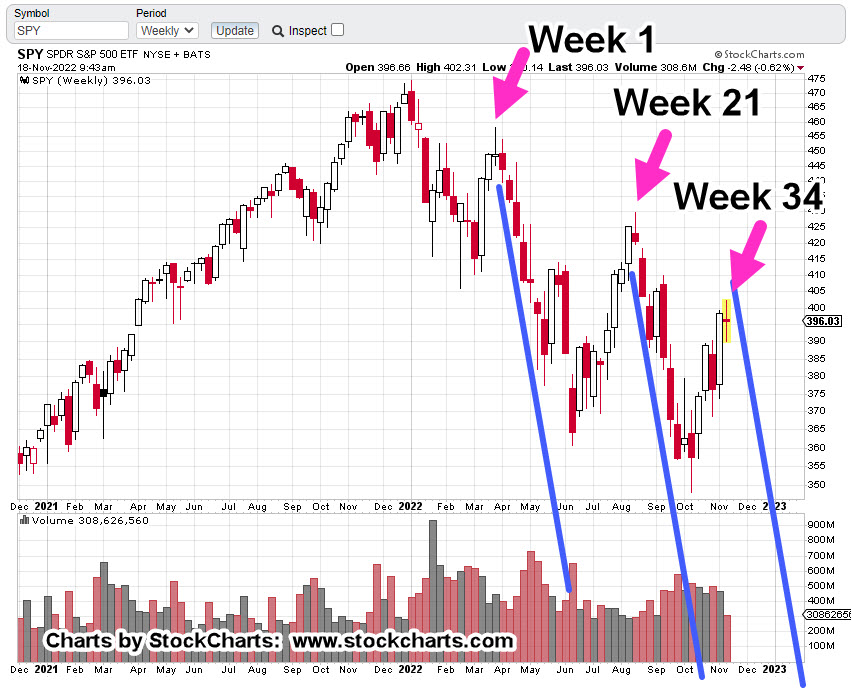
It’s just a few hours before the futures open and we’re about to see if we have a (continuing) downside reversal.
Remember, last week was Fibonacci Week 34, as discussed in this update.
That week’s range was just over 3.1%.
The time before that, similar narrowness Week 21, was around 2.5%.
Perhaps, even more interesting, going back to Week 1, we have yet another narrow range of 2.9%.
We’re about to find out if that sequence of narrow ranges means something or not.
Holiday Turns
This coming week is a holiday week.
It seems appropriate at this time, to re-publish analysis done years ago and currently behind the password firewall of my firm’s main website.
Author’s Note: At the time, I was publishing a daily market summary.
Here it is, from June 27th, 2015 … so long ago.
Market Summary: 6/27/15
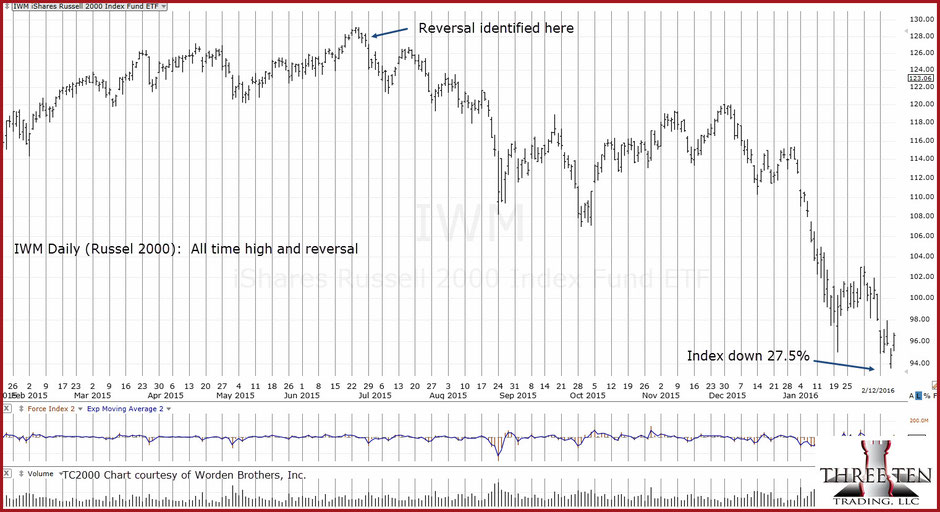
The Russell 2000 index has reversed. In addition, the S&P 500 volatility has declined to pre-2008 crisis levels. We now have yet another potential reversal during or just prior to (or just after) a holiday week.
This is how the Russell looked when the reversal was identified.
Author’s Note: The hyperlink above is password protected. The chart below, has been brought outside the firewall.
The following data shows the original analysis (first chart) and then, months later, how that analysis was proven out to have identified the (near) exact moment of reversal.
Continuing on with the original (6/27/15) post.
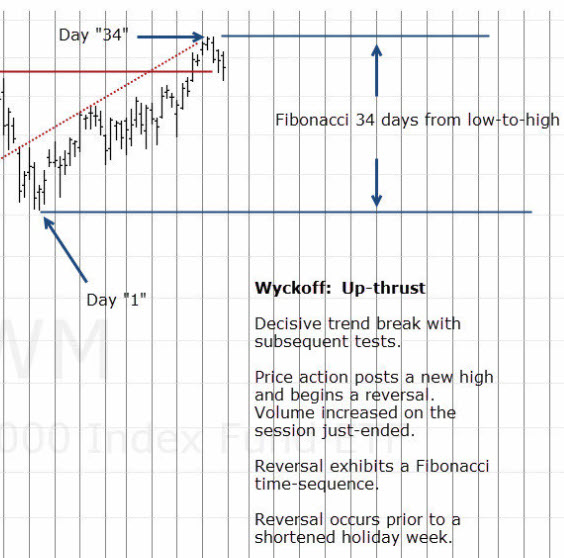
For clarity, the reversal area of the chart has been expanded below:
Other notable reversals that occurred prior to, during, or just after a holiday week:
Week of 5/23/08: S&P 500 makes a high on the Monday prior to Memorial Day: S&P then crashes over 53%.
Week of 7/3/14: Russell 2000 makes a high on the Tuesday of the July 4th week: Subsequent decline is 9%
Week of 9/5/14: Russell 2000 makes a high on the Wednesday after the Labor Day weekend: Subsequent decline is 12%
Week of 6/26/15: Russell 2000 makes a high on the Wednesday prior to the July 4th week: Subsequent decline: 27%
Going way back: The all time market high of 1929, occurred on September 3rd, of that year. That date was the Tuesday following the Labor Day Weekend. Subsequent decline was 84 – 89%
Author’s Note: Months later, we now have the result as shown below:
Note: Posts on this site are for education purposes only. They provide one firm’s insight on the markets. Not investment advice. See additional disclaimer here.
How many biotech ‘outfits’ are at risk of being incinerated during a market implosion?
For activist short-seller, Scorpion Capital, they’ve found at least one and they’re not mincing any words.
They sate: Twist Bioscience (TWST) is ‘cash burning inferno‘ and then go on to say:
Price target for TSWT, is Zero.
Their report supporting that assessment is linked here.
Note: It’s 236-pages, long!
Maybe it’s a one-off.
However, considering the other market implosions in just the past week, probably not.
As is typical for an equity in a long decline, the lawsuits have already started.
Other implosions just in the past seven days, are FTX, and Twitter. Maybe, Amazon (AMZN) will be next.
Analysis, vs. Antics
Seems like every other week or so, we’ve got some kind of Alpha, Beta, Delta, Gamma, extreme du jour, that’s supposed to cause ‘fireworks‘.
Reporting on fireworks, does not help navigate the current (or any future) situation.
What does help, is to clearly and without bias, assess what price action’s telling us.
We’ve already analyzed the biotech sector many times over as (potentially) the index most susceptible for a severe decline if not outright implosion.
That implosion may already be underway (not advice, not a recommendation).
Back To Wyckoff
Wyckoff analysis pointed us to biotech over a year ago.
Now, as is typical, the truth is starting the come out; a trickle at first …
So, for today’s update were going shift gears and follow-up on the prior two posts here and here.
We’ll take another look at the S&P (SPY); specifically, the weekly chart.
S&P 500, Weekly
The weekly is shown with trendlines.
Looking at those lines, is there any other basis for drawing them at the location shown?
The short answer is yes and it’s on the second chart.
The chart below has a Fibonacci time correlation for the trendlines, now, potential trading channel.
We’re currently at Week 34, from the beginning of the (potential) channel.
It may be something, it may be not.
As of this post (10:07 a.m., EST), we don’t know and price action itself, is the final arbiter.
Summary
Because of the supposed ‘fireworks’ scheduled for the day, we may not know if we’re at a pivot point until next week.
That week just so happens, to be a holiday week.
Many times, this site has a presented a proprietary insight; market reversals tend to occur just before, during, or just after a holiday week.
Obviously, the most famous of these was September 3, 1929 (the day after Labor Day weekend), which was the all-time high and reversal, leading to the crash.
Note: Posts on this site are for education purposes only. They provide one firm’s insight on the markets. Not investment advice. See additional disclaimer here.
Well, another financial media lie has come and gone.
As Jerrimiah Babe says, time stamp 6:05, at this link:
“The good times are over.”
The Dow Jones was down over 1,000 points on the day and finished (along with the S&P, NASDAQ) right at the session lows.
Typical action for the markets under such conditions, is a follow-through at the next trading session, Monday.
Recall, it’s been presented many times on this site (Holiday Turns), major reversals tend to occur just before, during, or just after, a holiday week.
The 2008, countertrend reversal took place on the Monday (5/19/08), leading into Memorial Day Weekend. The big one in 1929, was the Tuesday (9/3/29) following the Labor Day Weekend.
The current reversal (discussed below), if it holds, has come a couple weeks early in the ‘holiday’ window.
It’s possible because of the massive size of this monster, that a week or two does not make a difference.
Let’s look at the Dow 30 and its perfect Wyckoff Up-Thrust, Reversal, and Test.
Dow 30, DIA Daily Close
Daily Close with Fibonacci retrace levels identified.
A close-in look on the reversal area.
Looking at the zoom-chart above, we had a Wyckoff Up-Thrust that touched 61.8%, then declined sharply before coming back to test at 50%.
After the test was another sharp decline. One can make the case, the up-thrust has been tested.
Continued (overall) downside is the higher probability with a ‘no Fed pivot’ providing the tailwind.
Note: Posts on this site are for education purposes only. They provide one firm’s insight on the markets. Not investment advice. See additional disclaimer here.
Note: Posts on this site are for education purposes only. They provide one firm’s insight on the markets. Not investment advice. See additional disclaimer here.
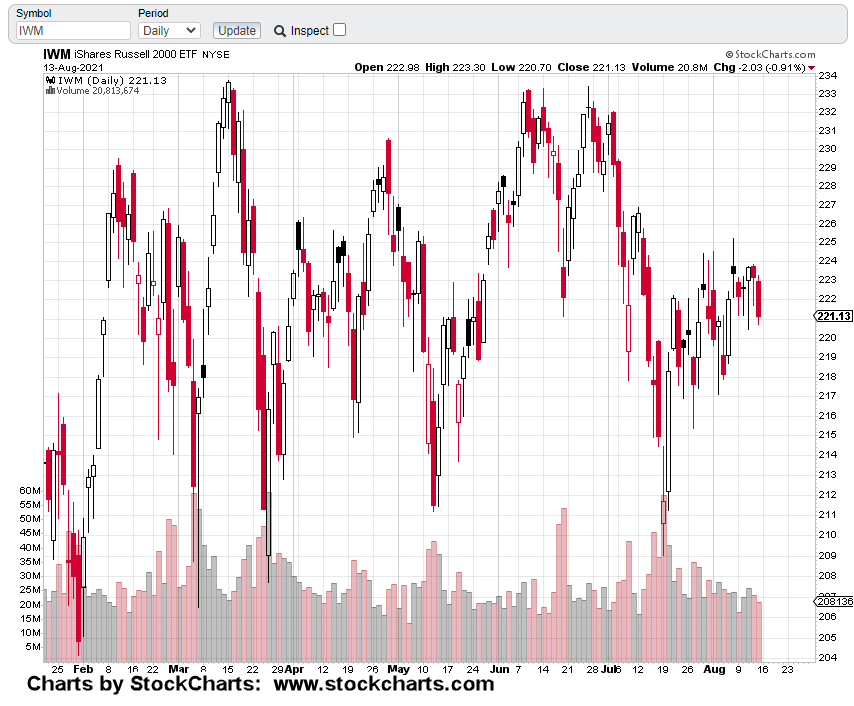
The Russell 2000 (IWM as proxy) has been congesting sideways for about five months.
While the overall markets, S&P, Dow, SOXX, IYR and the QQQs, have been moving on to new highs … the Russell has stagnated.
Taking a cue from Steven Van Metre’s reports on ‘who goes first’ in a downturn, it’s the small caps.
At this juncture, it looks like the Russell’s ready.
The six month daily chart of IWM below, shows choppy action.
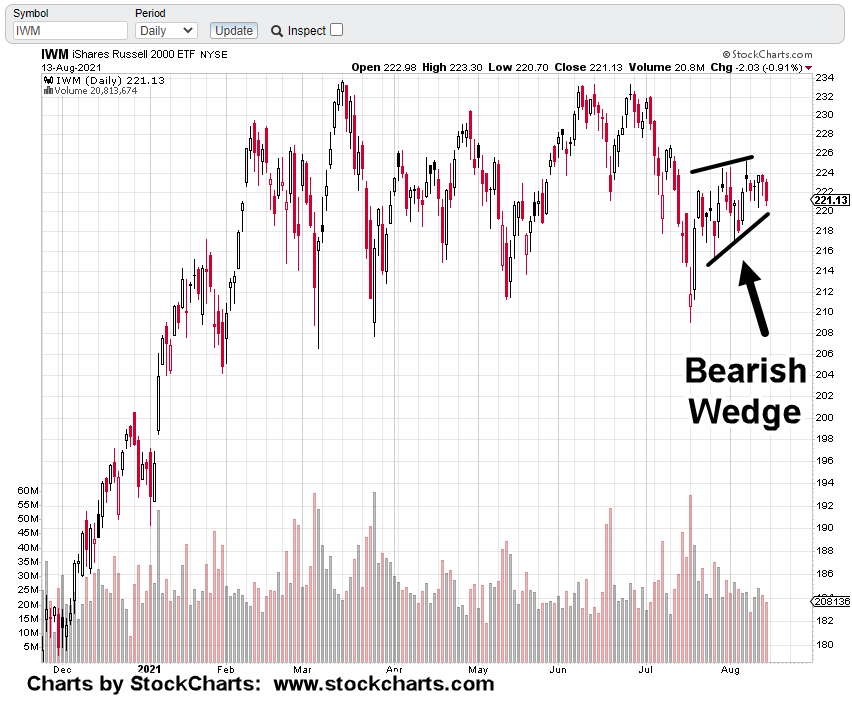
Pulling back somewhat and labeling the bearish wedge, puts it into perspective (second chart):
Pulling out and labeling the wedge:
One item of note (not shown) at the top of the wedge, where price action pivoted lower (August 6th), is a Fibonacci 62%, retrace level.
So, we have a bearish wedge retracing 62% … along with non-confirmation of the overall highs; S&P, Dow, SOXX, etc.
Major reversals take a long time to form. However, once they get underway, it’s like a juggernaut to the bottom.
Harkening back to the oil (USO) bear market of 2014, nearly all (if not all) the YouTuber’s at the time, completely missed the bearish set-up.
What they did instead, once the downdraft started, was pump out update after update about ‘catching the bottom and setting up for the new bull market in oil’.
It never happened.
Oil continued lower for a year and a half before getting into a sideways range.
The big money’s in the big move. Monitoring the Russell provides confirmation a significant reversal’s in the works (not advice, not a recommendation).
As with biotech (SPBIO), already in a bear market, the IWM could break lower while the overall markets continue to thin-out and even make new highs.
Recall, we’re getting close to an up-coming holiday: Labor Day
The 1929, high was on the Tuesday just after Labor Day weekend.
Note: Posts on this site are for education purposes only. They provide one firm’s insight on the markets. Not investment advice. See additional disclaimer here.
Note: Posts on this site are for education purposes only. They provide one firm’s insight on the markets. Not investment advice. See additional disclaimer here.