Gold … Set-Up & Strategy

Testing Underside Resistance

There’s no shortage of bullish prognostications for gold.

Said many times, as soon as there’s a blip higher, it’s near lunacy.

One of the latest installments is linked here and go figure … it’s the Russians, again!

Let’s get real.

Remember, the last time it was the Russians and the time before that?

From the date of the second link above in April, this year, gold (GLD) is down about -8.5%.

Not exactly a crash but definitely not a ‘paradigm shift the world has yet to fully process’.

Just from a contrary standpoint, if ‘everybody’s doing it’, there must be something else going on.

Let’s take a look at the actual facts, the price action, and see what it’s telling us.

Gold (GLD), Quarterly

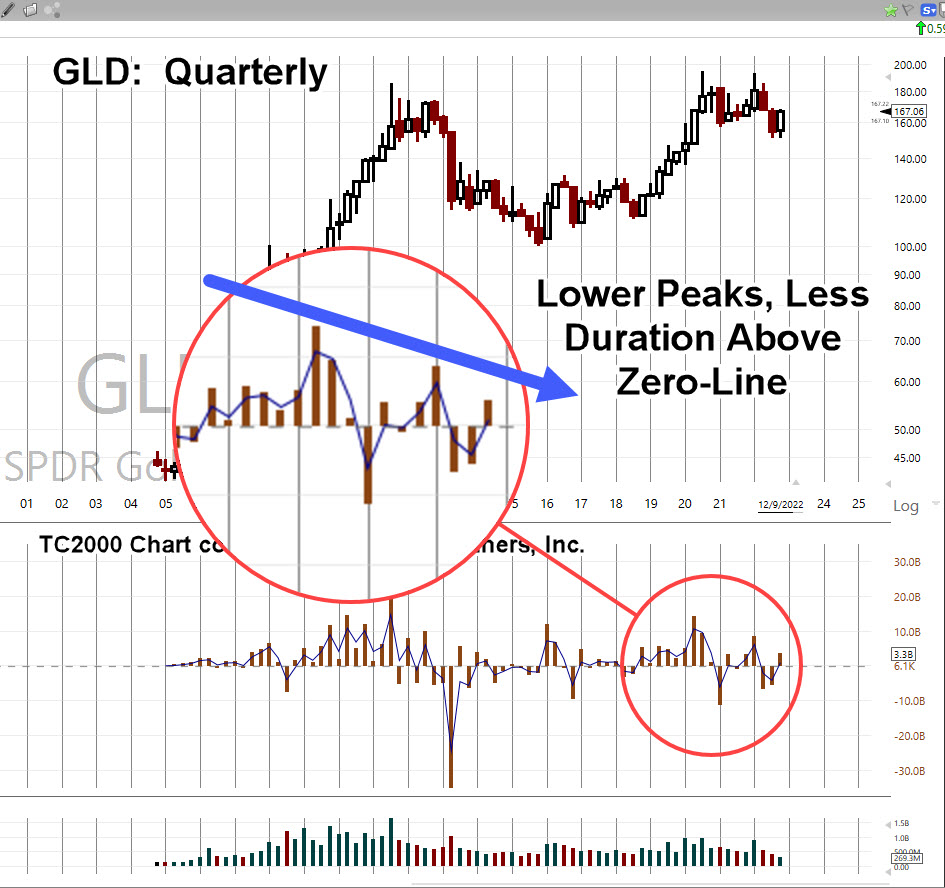
Looking at the big picture first; the quarterly chart.

Elder’s Force Index (shown in the middle section) has been expanded to detail the thrust energy behind the move(s).

It’s important to note, for at least the past 10-Quarters, two and a half years, the upward thrusts have been successively declining in energy.

That decline is highlighted below.

Next, we’ll drill down to the monthly chart.

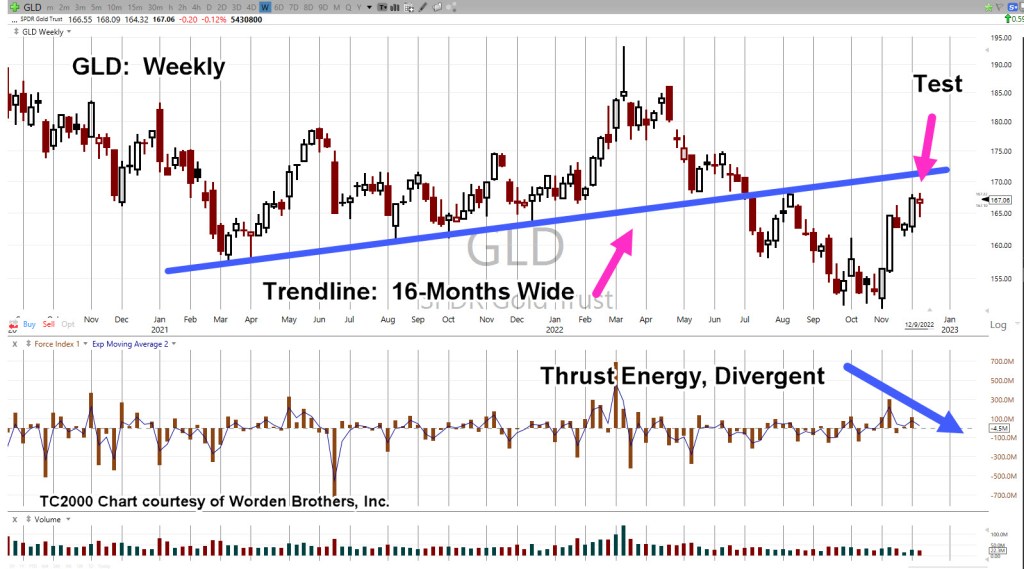
It shows GLD, trended (slightly) higher for at least sixteen-months, before breaking down.

GLD, Monthly

Now, as the right-most magenta arrow shows, we’re at the test of underside resistance.

Tests may pass or fail; obviously, what happens next is important.

Also note, as with the quarterly, upward Force Index on the monthly, is declining.

We’ll take it one step further and go the weekly … it too, has declining and also diverging upward thrust.

GLD, Weekly

Ok, you talked me into it. 🙂

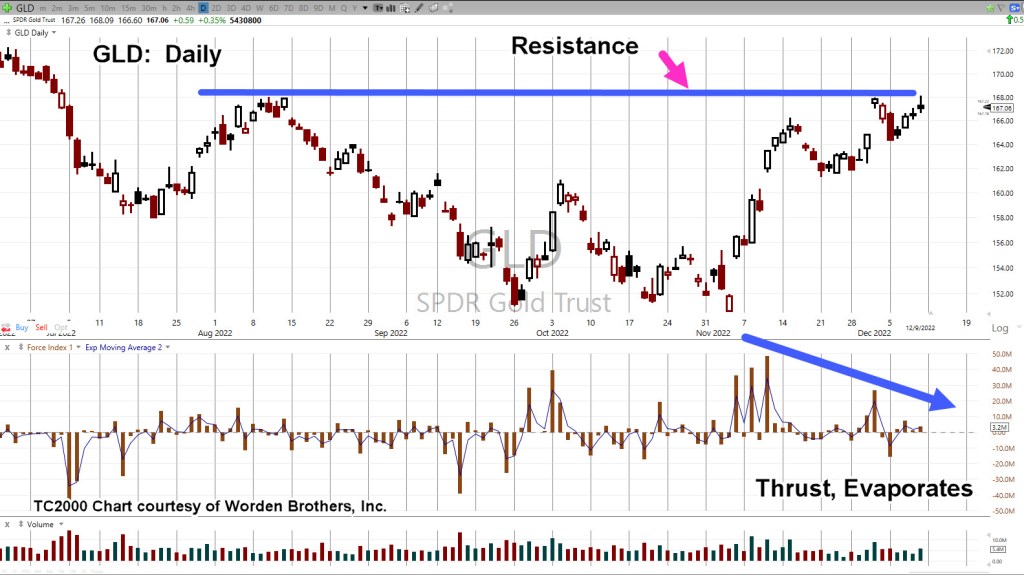
Let’s go to the daily and see the same thing.

GLD, Daily

Does all this mean gold will immediately go lower at the next open?

The short answer … it’s not known. However, from a probability standpoint, lower is more likely than higher.

No ‘Capitulation’

There’s nothing to indicate downside capitulation.

Nothing like the ‘changing of hands’ that took place this past March 8th, here and here.

It appears we’re still in the initial stages of a long-term downside reversal.

Downside? … How’s downside, even possible?

‘What kind of idiot comes up with that type of analysis?’

Moving Parts, A-Plenty

Every day, we see things going on in the background that could not be known or fathomed; like missing $80 Trillion?

All it takes, is for some kind of sovereign debt or derivatives blow-up, requiring that country to sell its assets like gold, silver, oil, grains and so on.

A huge dump on the gold market, would of course trigger stops and that in itself, could result in a contagion of selling.

If or when it happens, the downside might be temporary like the Flash Crash of 2010, or oil going negative, or it could be longer.

The ‘powers’ don’t seem to be too concerned with precious metals demand, prices, and low stock of physical at the commodities exchange(s).

It’s as if they know, it will work itself out.

They’re on to something else more basic. Something ‘crude but effective‘ like destruction of the food supply.

Stay Tuned

Charts by StockCharts

Note:  Posts on this site are for education purposes only.  They provide one firm’s insight on the markets.  Not investment advice.  See additional disclaimer here.

The Danger Point®, trade mark: No. 6,505,279

There’s No … ‘Santa Rally’

Forecasted Months Ago … Now, Playing Out

Let’s start with the post from way back in September, linked here.

Back then, it said (emphasis added):

It’s going to be a very different place come December.

This won’t be like ’08 -’09, where all the stops are being pulled to ‘rescue’ the market.

No, this time really is different.

We can all see by now; the plan is controlled demolition.

That was then. Fast forward to now.

ZeroHedge has come out with the obvious. If there’s going to be a Santa Rally, it needs to start soon.

Good luck with that.

Instead of looking for a rally, we’ve moved on from that (unlikely) potential to something different, linked here.

That link is not a forecast. It’s there to remind us, the potential for what can happen.

One group that just won’t let go of the (sustainable) rally scenario are the gold bugs.

Seems like with every ‘blip’ higher we have articles like this one, this one, and this one.

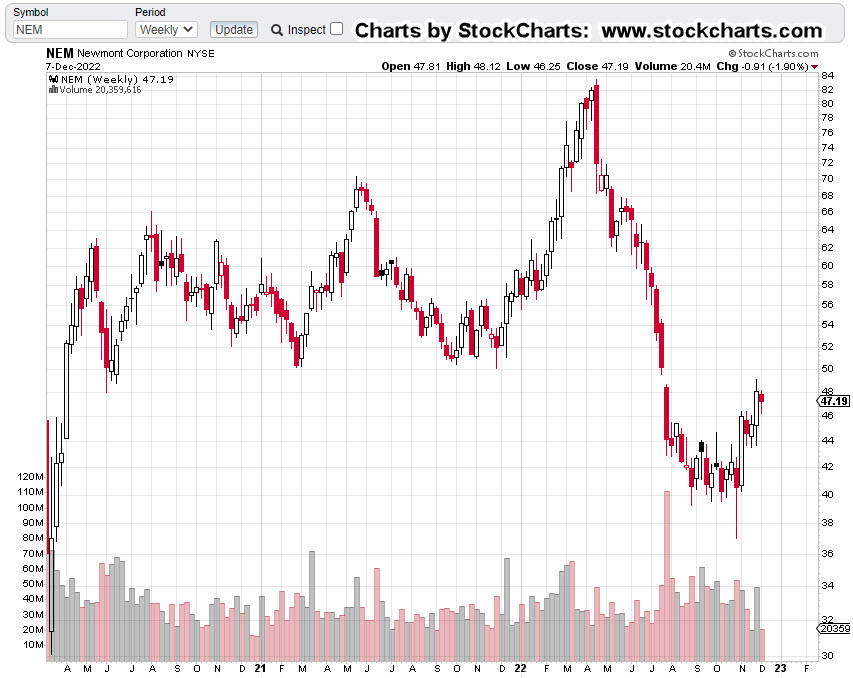
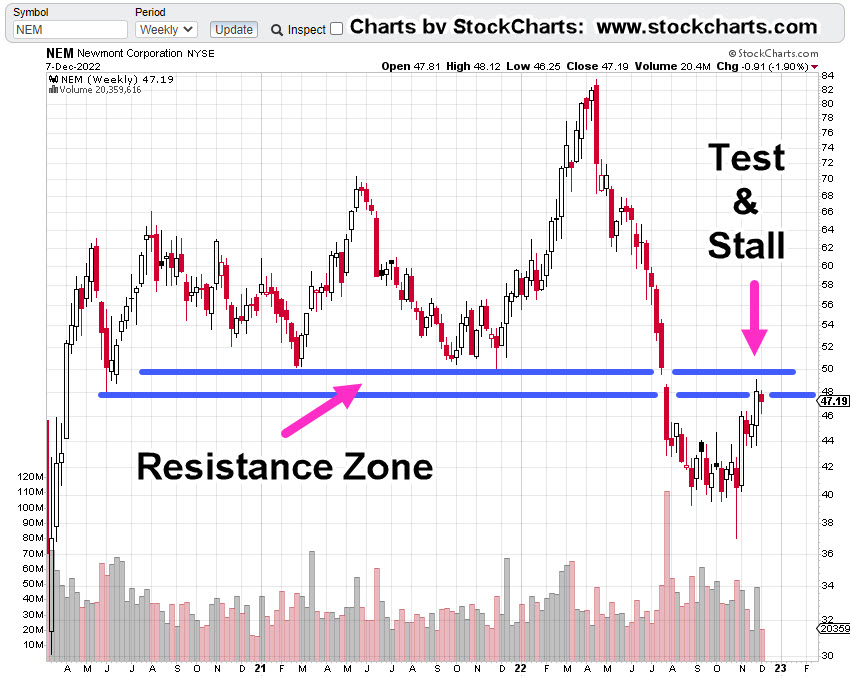
So, let’s take a look at a the largest cap in the mining sector, Newmont and see what the price action is telling us.

Newmont Mining NEM, Weekly

First, we have the un-marked chart and right off the bat, it does not look good; down -45.4%, from all-time highs.

It looks even worse, when the resistance zone is added.

So far, price action has already stalled and not been able to hold within the resistance zone.

It’s important to note, this resistance area is over two years wide. it’s not likely that anything’s going to happen to the upside without numerous attempts.

No ‘Clicks’, In A Gold Bear Market

If buying gold was the answer to getting through the financial, economic and societal collapse, then one would think the price would be moving relentlessly higher.

That’s not happening … not by a long shot.

What is happening, is this: Demand destruction on a colossal scale.

This destruction is on the birth side and the death side.

These events are affecting everything, going forward.

Nailing The Reversals

Using Wyckoff analysis, this site has been able to identify reversals in gold and the miners at times, to the day.

Important pivot points are here, here, here, and here,

Once again, at this juncture, we’re at a potential reversal in silver, gold, and the miners.

It’s about 15-minutes before the open. NEM is trading slightly higher by about 1.00%.

Let’s see what happens next.

Stay Tuned

Charts by StockCharts

Note:  Posts on this site are for education purposes only.  They provide one firm’s insight on the markets.  Not investment advice.  See additional disclaimer here.

The Danger Point®, trade mark: No. 6,505,279

The Set-Up … Goldman, ‘Gives Up’

Right At The Pivot

That’s the way it looks at this point as we’ll see below.

The ZeroHedge article in question, is linked here.

You can see, it starts off (before being grey-ed out) with referencing the Non-Farm Payrolls report; a report, that another article calls ‘rigged’. So, there’s that.

With each passing day, it’s ever more apparent, price action itself, is telling us the most probable market direction.

Just to prove the point, Blackstone’s sending out a ‘talking points‘ memo to keep clients calm and help ‘guide the conversation’ … i.e., ‘thought shaping’.

Thoughts ‘shaped’ or take action.

For this update, we’re taking action; looking at what the real estate market is telling us.

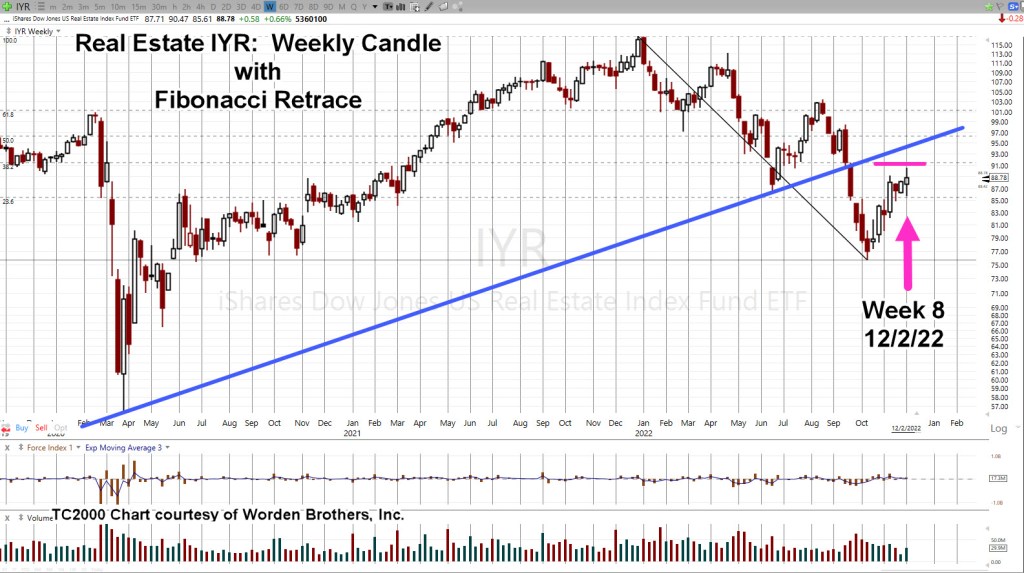
Real Estate IYR, Weekly

Let’s go back to the IYR, update from late October.

It showed the most probable direction; a move higher into a test, giving both the location, and the date.

Fast forward, to now:

We’re right at 38.2%, retrace and on time with Fibonacci Week-8, from the lows.

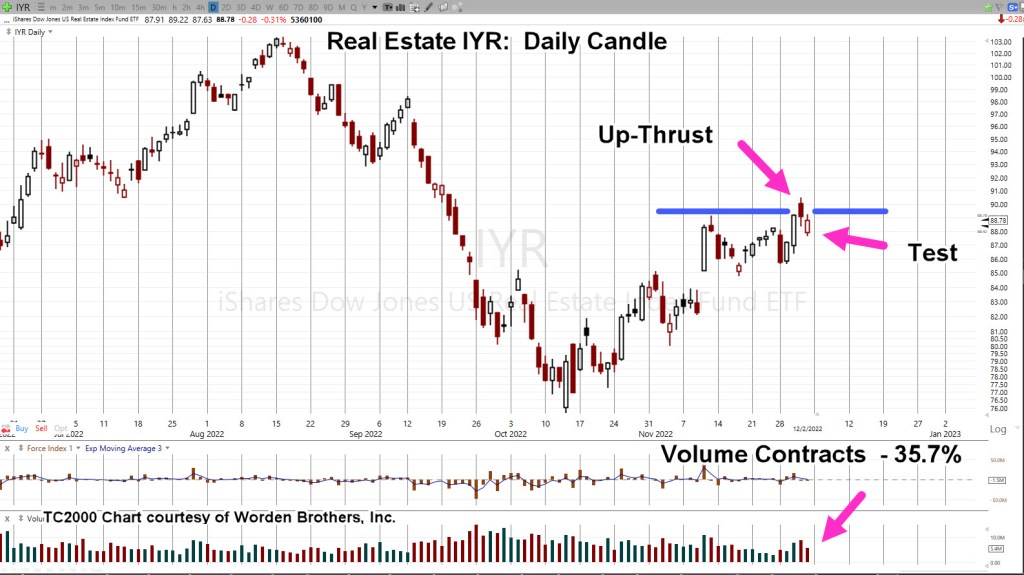
The daily chart shows a possible up-thrust (reversal) and test … the very same day that Goldman ‘gives-up’.

Real Estate IYR, Daily

Not shown on the daily; from the lows, October 13th, to the (print) high, December 1st, is a Fibonacci 34 (+1) Days.

Volume increased on the reversal bar December 1st, and then contracted on the upward test the next day … pointing probabilities to the downside.

Printing a new daily low at the next session, will help confirm the reversal.

Summary

Let’s see what happens next.

The Goldman report may be contrary indicator; telling us the ‘professionals’ are throwing in the towel, changing their approach right at a potential top.

Positioning

Not advice, not a recommendation.

LABD-22-13: Closed

It’s become apparent from this article; the truth, that was counted on as a tail-wind (for a short position) is not going to come out anytime soon.

Those that know, already know.

Moving on to other markets (below) that will be affected by the consequences of biotech.

DRV-22-06:

Short real estate IYR, via DRV (not advice, not recommendation)

Entry @ 48.39***: Soft Stop @ 47.53***, Hard Stop @ 45.11***

Note: Positions may be increased, decreased, entered, or exited at any time.

***, Indicates change

Stay Tuned

Charts by StockCharts

Note:  Posts on this site are for education purposes only.  They provide one firm’s insight on the markets.  Not investment advice.  See additional disclaimer here.

The Danger Point®, trade mark: No. 6,505,279
Biotech Forecast … Pivot or Not

Multiple Scenarios, Going Forward

The ability to see multiple scenarios is like a Rorschach Test.

With each additional tick on the chart, it takes on a different character.

So, let’s look at what’s most likely, based on where we are now with one of, if not the weakest sectors; biotech SPBIO.

For reference, we’ll start with the big picture … the weekly chart to show the two-month long, bear flag.

Biotech SPBIO, Weekly

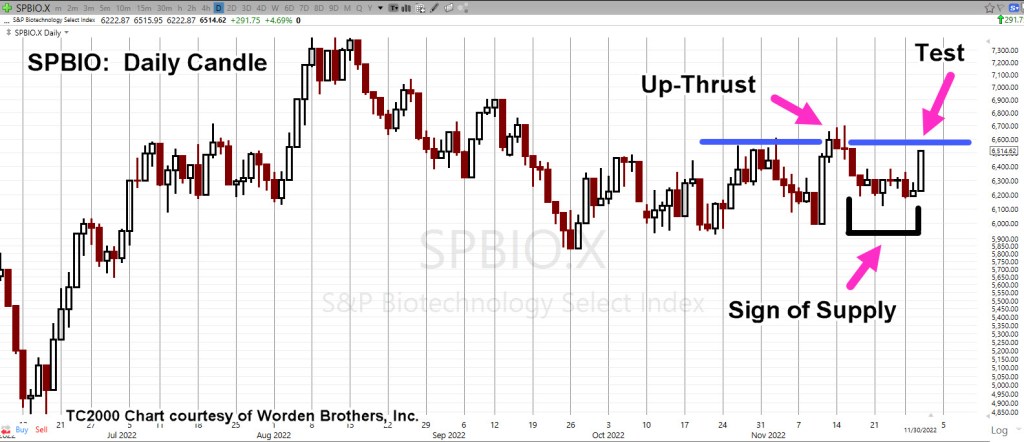
Next, is the daily for the past several months.

We’re at The Danger Point®; the test, where there’s not much distance between pass and fail.

Price action can (easily) go either way.

SPBIO, Daily

However, from a probability standpoint, we’ve been in a bear flag for months; the expectation is the test will pass, price action reverses and we get a downside breakout.

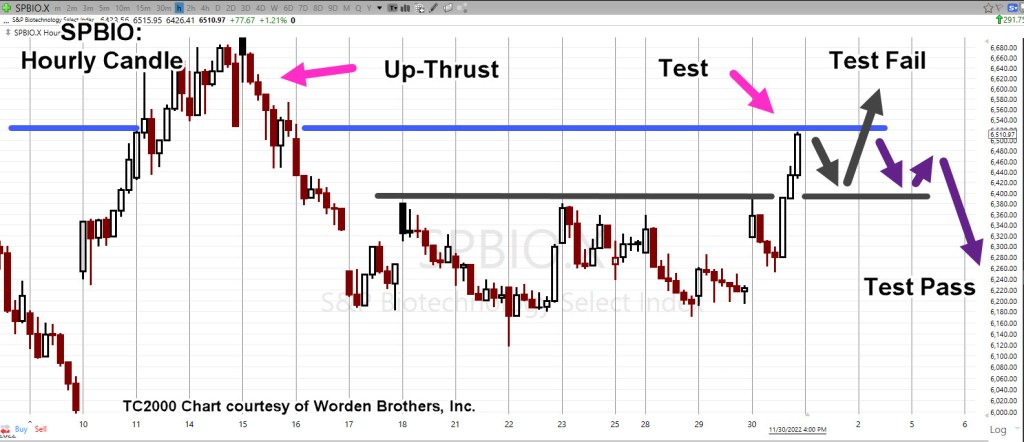
The hourly chart has the most likely potential outcome.

Pre-market action shows flat (as of 9:08 a.m., EST).

SPBIO, Hourly

The chart has two likely scenarios: one pass, one fail.

A less likely outcome is a straight up launch above resistance.

However, anything can happen.

Summary

With the Fed out talking hawkish again, we’ll say it again; there is no ‘pivot’.

Whether or not the press is intentionally miss-directing the narrative, in a sense, does not matter.

We’re looking at the price action.

Right now, it says, we’re at a dangerous spot and may be about to pivot (pun intended) to the downside.

Positioning

Not advice, not a recommendation.

No change since yesterday.

Short position in SPBIO via LABD; details are as follows:

LABD-22-13:

Entry @ 18.72: Stop @ TBD

Note: Positions may be increased, decreased, entered, or exited at any time.

***, Indicates change

Stay Tuned

Charts by StockCharts

Note:  Posts on this site are for education purposes only.  They provide one firm’s insight on the markets.  Not investment advice.  See additional disclaimer here.

The Danger Point®, trade mark: No. 6,505,279

Pandora & Twitter, The Box Opens

Fuel, For The Downside

With Twitter’s lifting of the ban on truth, linked here, we may be entering the next phase of collapse.

Whether or not it’s going to immediately show up in market price action, is unknown at this point.

Nascent Reversal?

The last update identified the markets were poised for potential reversal.

Two days later and we’re mostly down; that’s in spite of the supposed positive ‘machine’ bias as presented at this link.

A positive machine-market could still happen (data released tomorrow) but for now, price action itself, is posting lower; this is the crux of Wyckoff analysis … ‘What is the market saying about itself’.

In line with the truth being let out, not surprisingly, chief cook and bottle washer, biotech, is having a rough time.

Biotech Bear Market

Prior posts have documented the bear flag that’s been forming for over nine-weeks. Now, we have an apparent coiled action, ready for the downside.

Since we’re short this sector via LABD (not advice, not a recommendation), we’re going to look at LABD, to identify the potential.

SPBIO, 3X Leveraged Inverse, LABD

We have three charts, all depicting daily action.

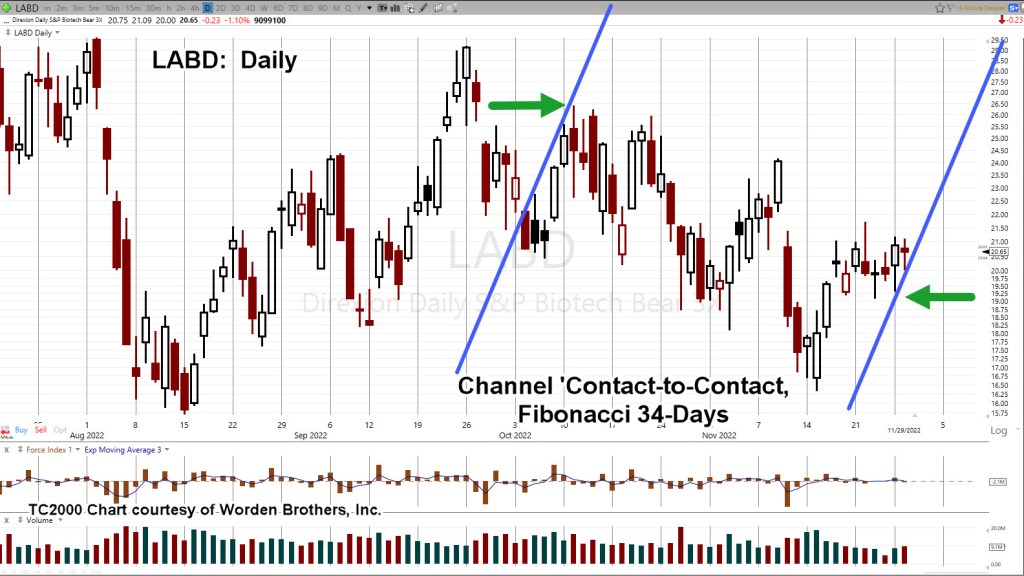
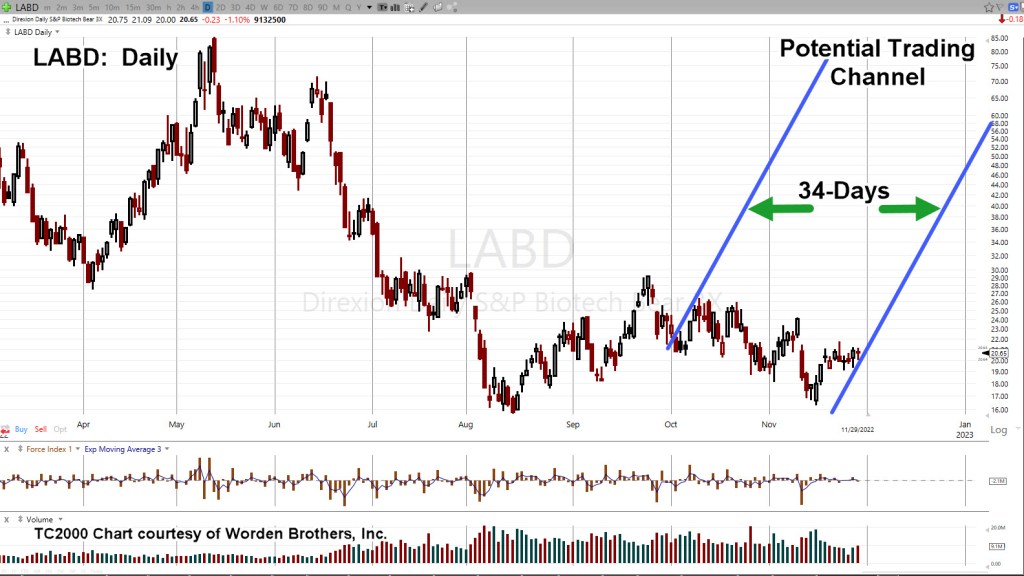
The first (un-marked) chart is close-in and it looks like a mess. That is, until you put in trend lines and a Fibonacci count as shown on the second chart.

Adding the mark-up.

Then, keeping those trend lines intact, pulling farther out, we see the potential if there’s a sustained move.

Price action has been trading in a tight range over the past eight-days. Let’s see what happens next.

Positioning

Not advice, not a recommendation.

Short position in SPBIO via LABD; details are as follows:

LABD-22-12:

Entry @ 19.9194, 20.91***: Stop @ 19.28***

Note: Positions may be increased, decreased, entered, or exited at any time.

***, Indicates change

Stay Tuned

Charts by StockCharts

Note:  Posts on this site are for education purposes only.  They provide one firm’s insight on the markets.  Not investment advice.  See additional disclaimer here.

The Danger Point®, trade mark: No. 6,505,279
Bond Market, Signals Trouble

It’s Not About The Fed

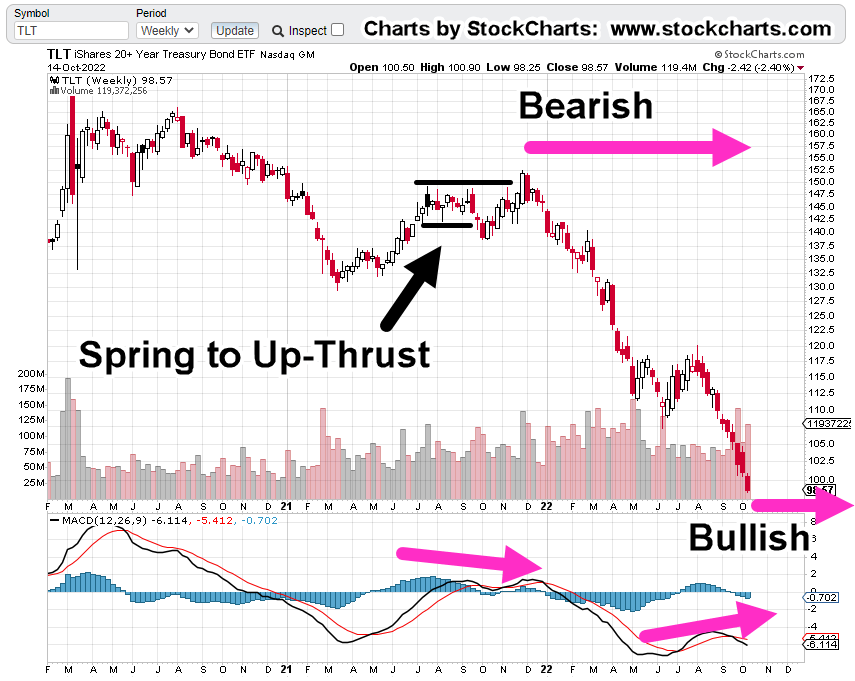
The potential for a sustainable bond reversal was identified way back in mid-October.

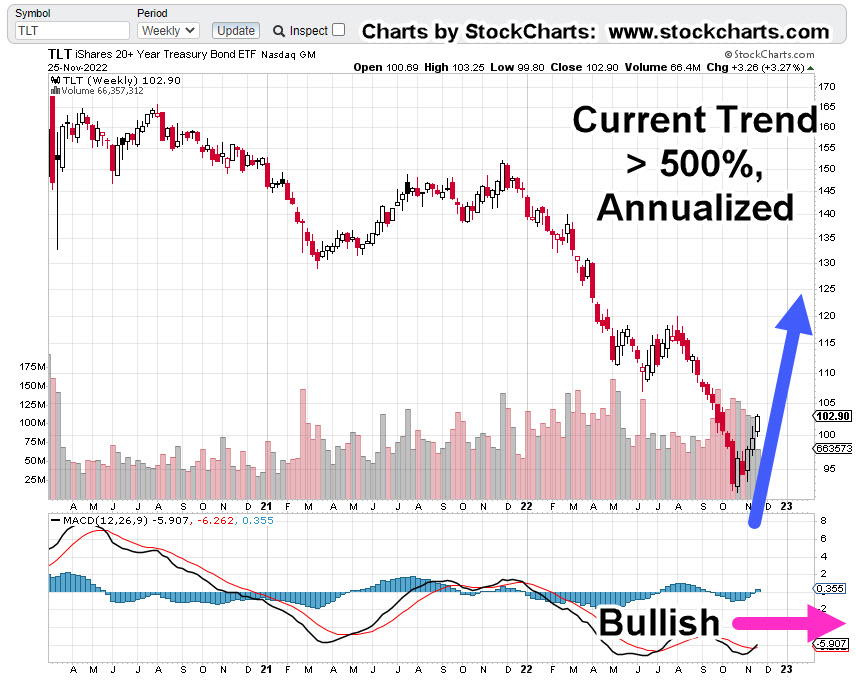
Now, over a month later with bonds moving decisively higher, the ‘narratives‘ are out in force.

Those narratives revolve around ‘pivot me this, or ‘pivot me that‘, or an infinite number of the same variations.

The reality is, there’s not going to be any ‘pivot’.

Even if there was, as Michael Cowan reported weeks ago, the market keeps crashing anyway (not advice, not a recommendation).

With that in mind, a popular narrative is that bonds are higher because the Fed will lower rates when they see we’re in a ‘recession’.

Well, they won’t ever see a recession because we’ve skipped that part; going straight to collapse and economic depression. 🙂

Of course, as Jerimiah Babe puts it, Americans won’t do a thing to get ready until the last minute … most likely after the market is down 50%, or more.

Instead of the placating, proletariat calming narrative, it’s a recession; maybe bonds are moving in response to those in the know … something much worse may be ahead.

Could bonds be signaling, we’re close to a market rout?

Bonds, TLT, Weekly

We’re going to start with the original analysis, showing the potential for a sustained reversal.

From the October 16th, post.

A month or so, later.

As with the dollar analysis from years ago, a weekly bullish divergence as we see here, may result in a rally that lasts longer and goes farther than anyone expects.

Of course, the real question is ‘what does it mean?’

As Wyckoff said over a century ago, we won’t know the full reason for a move until it’s over.

One view of it however, different from the accepted narrative, we could be headed for some kind of disconnect; those in the know are shifting to ‘relative’ stability.

Moving on to other markets, we have the following:

Positioning

Not advice, not a recommendation.

The push higher in biotech SPBIO, discussed in the prior update did not materialize.

Instead, we got a new daily low, followed by some upward testing action.

A day-trade in LABD was opened and closed; then near the market close, opened again.

Details are as follows

LABD-22-12:

Entry @ 19.9134***: Stop @ 19.10***

Note: Positions may be increased, decreased, entered, or exited at any time.

***, Indicates change

Stay Tuned

Charts by StockCharts

Note:  Posts on this site are for education purposes only.  They provide one firm’s insight on the markets.  Not investment advice.  See additional disclaimer here.

The Danger Point®, trade mark: No. 6,505,279
Set For ‘Implosion’ … Biotech

IBB & SPBIO, at The Danger Point®

Each one in their own way, as we’ll see below.

From a Wyckoff standpoint, we’ve identified one of, if not the sector(s) most likely to decline the farthest and fastest in a bear market.

Without question, biotech contains the overriding ‘elephant’ that’s literally affecting everything else on the planet (not advice, not a recommendation).

As stated in the tag-line above, the two indices in question are IBB (large cap) and SPBIO (small cap).

IBB, has Amgen, Gilead and Vertex, as the top three while SPBIO, has more speculative (i.e., losing more money) Beam, Twist and Fate.

Index IBB has $342.8-Bil, combined for the top three while SPBIO has only $6.5-Bil, combined.

So, it makes sense the more speculative ‘cash burning inferno‘ TWST, is in the SPBIO. 🙂

On to the charts

IBB Weekly

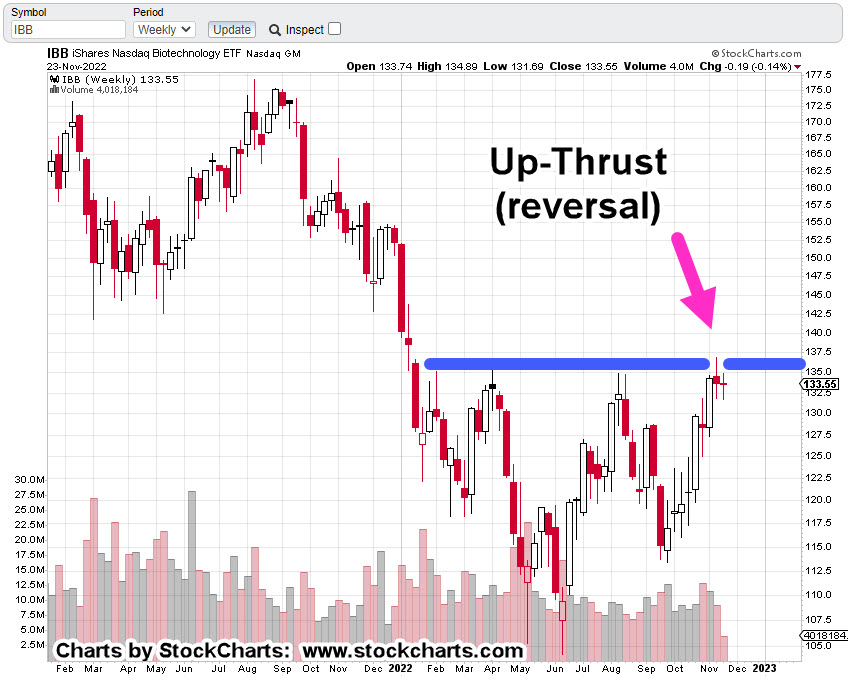
IBB has formed a decisive resistance area as shown.

The fourth attempt which pushed above the prior three levels (and retraced), puts IBB, at The Danger Point®

Next up is the SPBIO.

It’s much weaker and thus the focus for any short opportunities (not advice, not a recommendation).

SPBIO ($SPSIBI), Weekly

While IBB, has moved higher, to an up-thrust over the past nine weeks, SPBIO during that time, has languished.

Note: The chart scales are identical. Scrolling up and down, one can visually see the weakness of SPBIO.

SPBIO, also reached all-time highs, six months before IBB.

Getting Closer-In: SPBIO

We’re going to look at the hourly chart.

SPBIO, Hourly

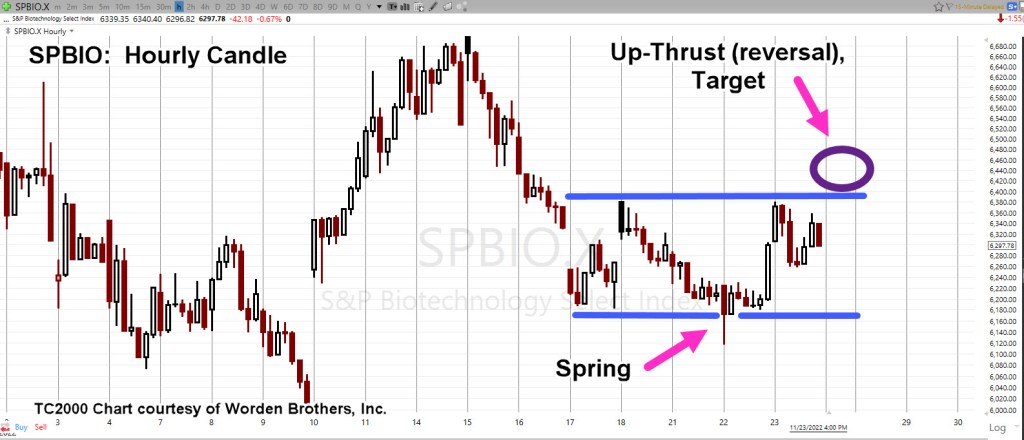
Those who are long-time visitors to this site will instantly recognize the set-up: ‘Spring-to-Up-Thrust

This Friday, tomorrow, is a shortened trading day.

There’s a potential we’ll have a small blip higher into the up-thrust zone.

Conversely, for 3X Leveraged Inverse Fund LABD, the potential is for a temporary move lower.

Leveraged Inverse LABD, Hourly

This is how it looks for LABD.

Note for the inverse fund, the ‘spring’ on SPBIO, becomes the ‘up-thrust’ on LABD.

Positioning

Not advice, not a recommendation

Wednesday’s downside action in LABD, resulted in the LABD-22-10, position being stopped out with an overall gain around 7.12%.

There have already been several disruptions to the company’s trading platform and data line over the past month and we’ve not even got started with market chaos.

Recall that just recently, the Canadian market went off-line for several hours. We should consider these events the ‘norm’, on a go-forward basis.

As a result, a standing order (in the market) is in place to go long LABD (short SPBIO) at the execution price of LABD @ 18.62.

That order may or may not be modified as we go into the open tomorrow morning.

Stay Tuned

Charts by StockCharts

Note:  Posts on this site are for education purposes only.  They provide one firm’s insight on the markets.  Not investment advice.  See additional disclaimer here.

The Danger Point®, trade mark: No. 6,505,279

Biotech’s, ‘Cash Burning Inferno’

If There’s One, There’s Probably More …

How many biotech ‘outfits’ are at risk of being incinerated during a market implosion?

For activist short-seller, Scorpion Capital, they’ve found at least one and they’re not mincing any words.

They sate: Twist Bioscience (TWST) is ‘cash burning inferno‘ and then go on to say:

Price target for TSWT, is Zero.

Their report supporting that assessment is linked here.

Note: It’s 236-pages, long!

Maybe it’s a one-off.

However, considering the other market implosions in just the past week, probably not.

As is typical for an equity in a long decline, the lawsuits have already started.

Other implosions just in the past seven days, are FTX, and Twitter. Maybe, Amazon (AMZN) will be next.

Analysis, vs. Antics

Seems like every other week or so, we’ve got some kind of Alpha, Beta, Delta, Gamma, extreme du jour, that’s supposed to cause ‘fireworks‘.

Reporting on fireworks, does not help navigate the current (or any future) situation.

What does help, is to clearly and without bias, assess what price action’s telling us.

We’ve already analyzed the biotech sector many times over as (potentially) the index most susceptible for a severe decline if not outright implosion.

That implosion may already be underway (not advice, not a recommendation).

Back To Wyckoff

Wyckoff analysis pointed us to biotech over a year ago.

Now, as is typical, the truth is starting the come out; a trickle at first …

So, for today’s update were going shift gears and follow-up on the prior two posts here and here.

We’ll take another look at the S&P (SPY); specifically, the weekly chart.

S&P 500, Weekly

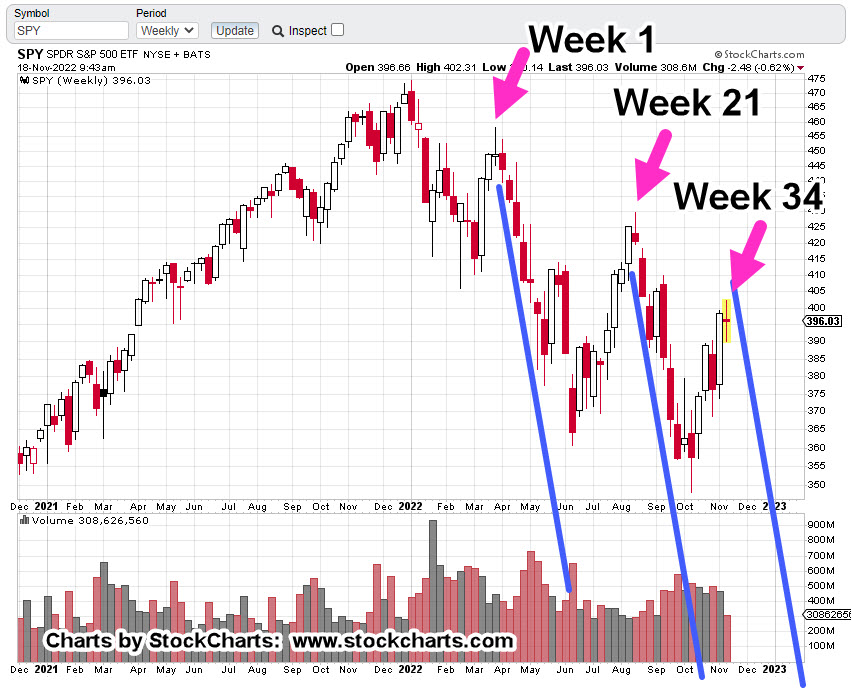
The weekly is shown with trendlines.

Looking at those lines, is there any other basis for drawing them at the location shown?

The short answer is yes and it’s on the second chart.

The chart below has a Fibonacci time correlation for the trendlines, now, potential trading channel.

We’re currently at Week 34, from the beginning of the (potential) channel.

It may be something, it may be not.

As of this post (10:07 a.m., EST), we don’t know and price action itself, is the final arbiter.

Summary

Because of the supposed ‘fireworks’ scheduled for the day, we may not know if we’re at a pivot point until next week.

That week just so happens, to be a holiday week.

Many times, this site has a presented a proprietary insight; market reversals tend to occur just before, during, or just after a holiday week.

Obviously, the most famous of these was September 3, 1929 (the day after Labor Day weekend), which was the all-time high and reversal, leading to the crash.

Stay Tuned

Charts by StockCharts

Note:  Posts on this site are for education purposes only.  They provide one firm’s insight on the markets.  Not investment advice.  See additional disclaimer here.

The Danger Point®, trade mark: No. 6,505,279
S&P, Opens Gap-Down

Upside Fuel, Exhausted?

Are we starting the next leg down?

Yesterday’s post, had this to say:

“SPY has yet to post a new daily low (below SPY, 394.49). If or when it does, that’s just one more addition to the bearish scenario.”

This morning’s open, puts the SPY below that 394.49, level and potentially confirms an up-thrust reversal as well as downtrend contact (shown below).

However, let’s not get ahead of ourselves as the first order of business, especially with the S&P (SPY), is an attempt to close this morning’s gap.

While that’s happening, let’s look at the charts.

S&P 500, SPY, Daily

Looking at the wider timeframe, first.

Now, let’s get closer-in.

As this post is being created, SPY is attempting to close the opening gap as expected.

Confusion Rules

As posted earlier, events are accelerating to the downside.

Supporting that assessment, we have this just out on the Crypto carnage; then on the flipside, we have this report, pointing to more upside.

Meanwhile, biotech pivots lower.

Part of the objective of these posts is to document the procedure (Wyckoff analysis) being used to select the market(s) most susceptible for a significant decline.

With that, it’s been on again off again with biotech for most of this year.

However, it looks like we’re now, at another (possibly, final?) pivot point lower.

Positions: (courtesy only, not advice).

The biotech short is being built in real time (not advice, not a recommendation).

LABD-22-10:

Entry @ 18.1398, 17.565, 17.65, 18.1594, 19.2792***: Stop @ 17.84***

***, Indicates change

Stay Tuned

Charts by StockCharts

Note:  Posts on this site are for education purposes only.  They provide one firm’s insight on the markets.  Not investment advice.  See additional disclaimer here.

The Danger Point®, trade mark: No. 6,505,279
December Crash of 1899

123-Year Anniversary, Coming Up

It’s happened, before …

Even so, unless you knew it (and the exact date), finding information is difficult to near impossible.

A once free access to the New York Times article from December 19th, 1899, is now subscription based, link here.

Another link here, shows that December 19th, is not available for browsing.

Going to the site-map for that date, the crash is not at the top as one would expect.

It’s much farther down, buried in the list.

‘The worst day-panic, The Street has ever known’

Of course, in the NYT article, J.P. Morgan himself, is ‘credited’ with saving the market from further decline.

You have to laugh.

It’s just like an Arizona mid-term election. 🙂

Lastly, using the way-back machine, here’s an article from the Seattle Times, written in December 1999. It compares the situation (then) to a century earlier.

On Track For Another?

Obviously, that can’t be known until if/when, it happens.

However, we can look at the most watched market, the S&P, and see what it says.

S&P 500, SPY, Daily

We’re leaving in the moving averages to show, at least from the 200-Day perspective, the downtrend is still intact.

Other items to note:

The market is still sub-dividing lower, lower highs, lower lows. Price action’s retraced to a Fibonacci 38% (shown below), and is also in Wyckoff up-thrust (reversal) position.

We’ll get closer-in with the details.

Moving averages have been removed for clarity.

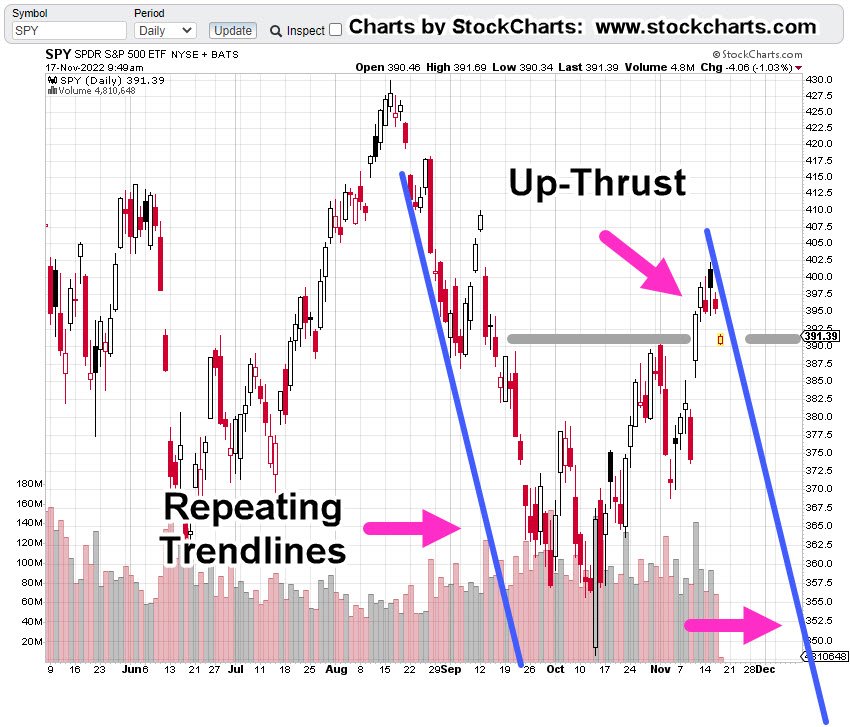
The blue line is the resistance and up-thrust area. Price action clearly above and apparently, hesitating.

Dashed grey line is the Fibonacci 38% retrace from all-time highs (1/4/22), to the most recent lows set on 10/13/22.

Zooming back out, is the scariest part of this chart.

There’s no doubt; we’ve had at least two repeating trendlines. A third could make it a trading channel.

Summary

As of this post (11:28 a.m., EST), SPY has yet to post a new daily low (below SPY, 394.49). If or when it does, that’s just one more addition to the bearish scenario.

Positions: (courtesy only, not advice).

The focus is on biotech; uniquely positioned as the weakest of all the major indices (not advice, not a recommendation).

LABD-22-10:

Entry @ 18.1398, 17.565, 17.65, 18.1594***: Stop @ 16.29***

***, Indicates change

Stay Tuned

Charts by StockCharts

Note:  Posts on this site are for education purposes only.  They provide one firm’s insight on the markets.  Not investment advice.  See additional disclaimer here.

The Danger Point®, trade mark: No. 6,505,279