” Pull It ! “

Check Mate, for The Middle Class

From a strategy standpoint, we’re now ready for the next round of financial destruction.

If we use this article from ZeroHedge, as the pivot point, consumer credit has maxed out.

The consumer (i.e., middle class) is now on the downward slope, just as the layoffs are about to begin in earnest.

Following the typical corporate model, expect job losses (time stamp 15:18) to start slow, then accelerate into December of this year.

The latest employment numbers provide the perfect backdrop to raise interest rates into a declining economy; all going as planned.

Market Response

As is typical, everyone’s focused on the major indices; The S&P 500, Dow, NASDAQ, SOXX, and on.

However, there’s one sector covered in the past, that’s mostly ignored: Basic Materials, with ticker DJUSBM.

That sector has held up until recently; probably because the thinking was, we’re going to have infrastructure projects to keep the economy going.

Looks like someone got the memo; Basic Materials has broken down.

As of this past Friday, it’s at a critical point.

The prior post from last November, does an excellent job of highlighting the divergences (which have only become worse) as well as downside potential.

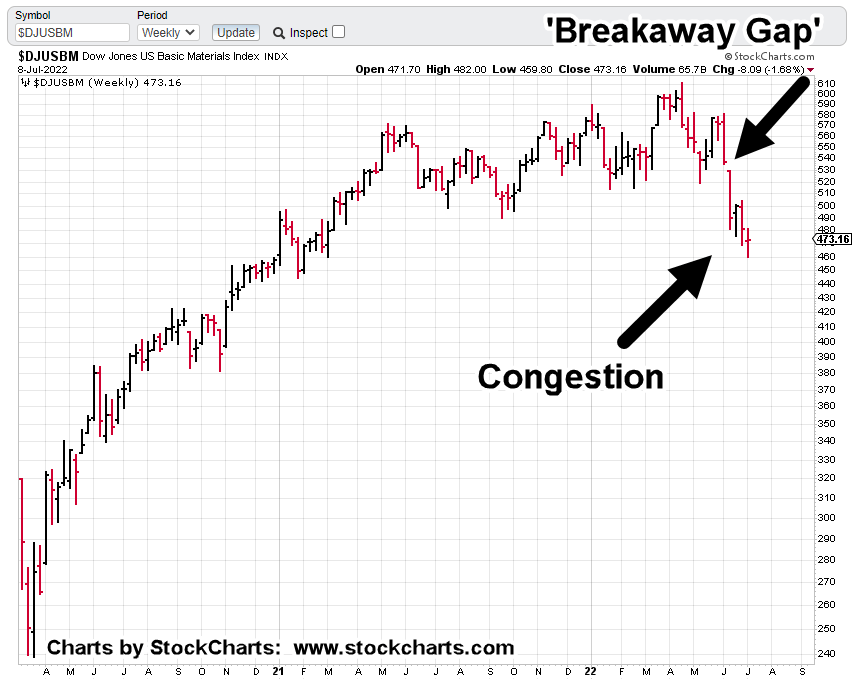
Basic Materials DJUSBM, Weekly

On the chart, we’ve got a breakaway gap that looks like it won’t be filled.

After that break, price action has formed a congestion area over the past three weeks.

However, it’s the congestion area giving us clues; the sector’s set up for an imminent break to the downside.

If that congestion holds true, it’s a stunning revelation of what may be about to happen.

We’ll go to the daily chart and start with a Fibonacci time correlation between pivot points.

Basic Materials DJUSBM, Daily

Well, it might not look like much.

However, let’s go one step further with another time correlation, shown below.

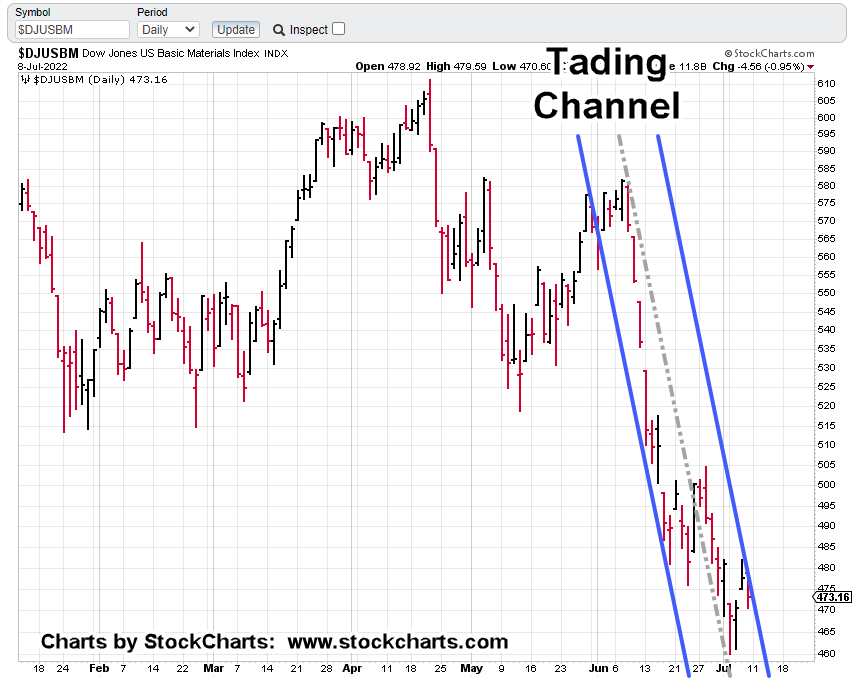
If you’re reading ahead, then you already know a trading channel has been defined.

The next chart shows the result.

For this channel to confirm Fibonacci ‘Day 21’, Friday’s action had to post lower … and it did.

That lower action also confirms, the channel’s a Fibonacci 13-Days wide.

Even more disconcerting (depending on one’s viewpoint), the channel lines are declining at approximately – 96.5%, on an annualized basis.

It’s not straight down but it’s close.

The next chart has a zoom of the congestion area.

Note how the grey dashed ‘center line’ is perfect in its contact points … further confirmation of the channel.

Leveraged 2X Inverse SMN, Daily

Although volume is still light, it has improved dramatically.

On a weekly basis, last week was the second largest trading volume at least going back to the ’07 – ’08, meltdown.

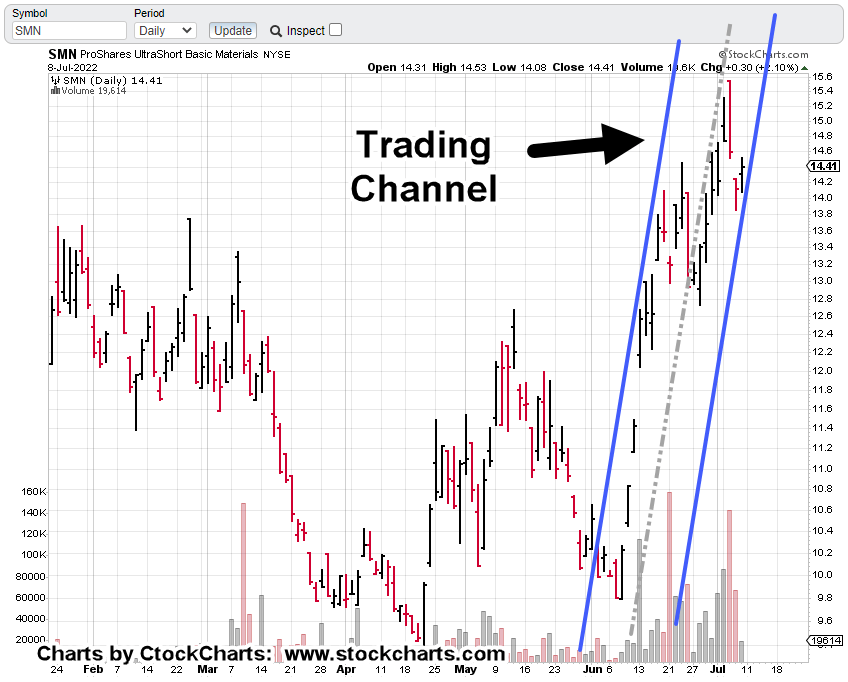
The inverse fund is shown below with the trading channel.

Liquidity is still marginal but has picked up over the last three weeks.

The Week Ahead

Obviously, the expectation for the next open is to post lower for basic materials.

Even with all the analysis, it’s the market itself that’s the final arbiter.

Positioning

As the hyperlink tabs in this post (top-left) show, I’ve positioned one account short the sector via SMN (SMN-22-01), with a stop just below Friday’s SMN, low at around SMN 14.05 (not advice, not a recommendation).

It’s a very tight stop.

The analysis is either in-effect, or it’s not. By this Monday, we’ll find out.

A Decline of Biblical Proportion.

On a strategic basis, we can see how expertly the middle class has been maneuvered into a corner.

For the past two years and probably much longer, that sector has been positioned to not have any recourse when the real decline hits.

We may be there now.

At the same time, if you’re up on Biblical references, you already know that when destruction came, there was always a ‘remnant‘.

The remnant was left to either escape or re-build and was typically 10% of the population.

If you’re reading this, you have already decided at some level, to be part of that remnant.

Stay Tuned

Charts by StockCharts

Note:  Posts on this site are for education purposes only.  They provide one firm’s insight on the markets.  Not investment advice.  See additional disclaimer here.

The Danger Point®, trade mark: No. 6,505,279

Active: Short DJUSBM via SMN, as SMN-22-01, stop @ SMN 14.05

Recession First … Depression Next

The Last Place To Be … Real Estate

The most illiquid of all ‘assets’: Real Estate

Two quarters of negative GDP (even with cooked books) equals recession.

Next up, full-blown depression.

Some would argue (like J.B. and Dan) that we’re already in a depression … we skipped the recession part altogether.

Do not pass Go. Do not collect $200.

Anyone who thinks the Fed’s going to ‘pivot’ because the numbers are weak, does not understand (or won’t admit to) the real purpose of the entity; but I digress.

The Strategy

Way back in December of 2020, this post was released which discussed ‘Genesis 41’, specifically.

It was an intuitive assessment; we’re in a phase where corn and grain (i.e., the food supply) are potentially more important than ‘stacking‘ silver or gold.

Over the ensuing year and a half, how correct, that has proven to be.

Then, nine-months ago, was this post, presenting the ‘elephant’; a massive population decline whose repercussions would last the lifetimes of anyone reading.

Now, we have this. A report that confirms the elephant.

It’s all starting to hit the mainstream, although the language is still being couched to not cause undue panic. Good luck with that.

So, what’s next?

The Danger Point: Real Estate

While mainstream press and money managers alike struggle to figure out the obvious, we have price action itself telling us the next likely direction of the market.

During an economic downturn there are many places not to be such as semiconductors, airlines and other low margin businesses, restaurants and so on.

However, the most illiquid of all, is real estate. It does not matter how bad one wants to sell, if there is no buyer, there is no sale.

Real Estate IYR, Weekly Chart

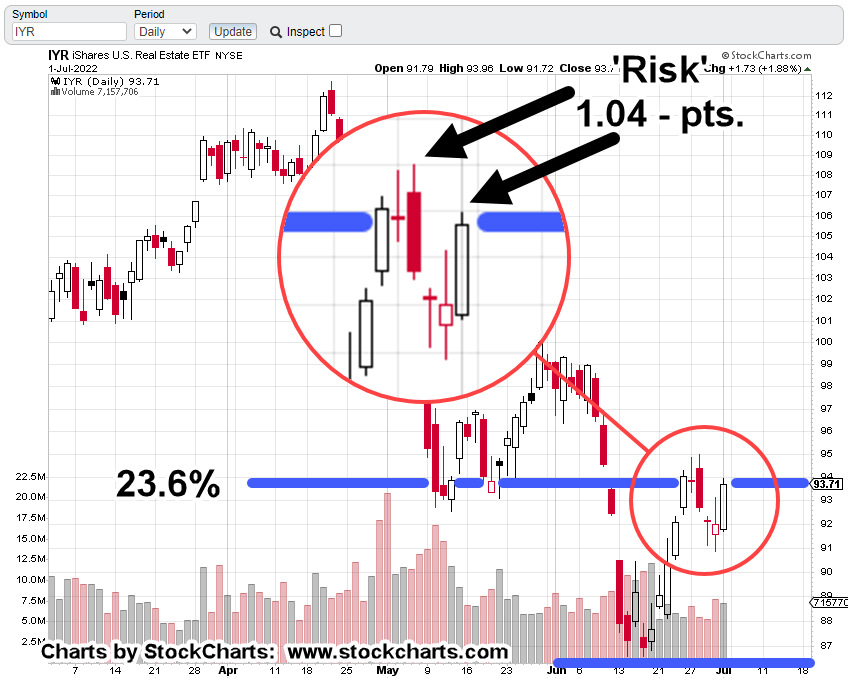
Last week, real estate IYR, closed right at the Fibonacci 23.6% retrace as shown.

Getting closer in on the daily, it’s marked up to show the risk from a shorting perspective (not advice, not a recommendation).

Real Estate IYR, Daily Chart

In this case, the risk on a short position is defined as the distance from last Friday’s high (IYR: 93.96) to that same week’s high of IYR: 95.0

Let’s add, Friday’s action saw IYR, retrace a Fibonacci 76.4% (the most available) of the entire move for the week.

The Summary

Amazon (AMZN), ProLogis (PLD), and Real Estate IYR, are joined at the hip.

Now the economy’s imploding, massive warehouse space is not needed.

Ditto that for employees as well.

ProLogis is already down – 31.2%, from its all-time highs set just this past April.

We’ve already shown PLD, has a nasty habit of going straight down during a market route.

Last time, PLD, crashed over – 84%, in just two months.

It’s likely to be worse, this time around.

Stay Tuned

Charts by StockCharts

Note:  Posts on this site are for education purposes only.  They provide one firm’s insight on the markets.  Not investment advice.  See additional disclaimer here.

The Danger Point®, trade mark: No. 6,505,279
Retail Investor … The Apocalypse

Mass Psychosis, At The Edge

Even before we had gone around the room to introduce ourselves, the instructor at Online Trading Academy, Dallas, said he had a important topic to cover.

He wanted to make sure everyone understood the concept. The rest of the seven-day course hinged on the understanding and acceptance of the idea.

What was it?

You may have already guessed: ‘Short Selling’.

The big money is made on the downside … not after, when the bottom is in, although that may happen as well. No, it’s the downside that has the greatest opportunity for profit.

Fear is a much easier emotion to gauge than greed; in that sense, down is easier than up.

Short Selling: Market Trading 101

You would think it’s a no-brainer; that everyone knows this.

Not so.

Years ago, while discussing the markets with a former broker, he asked me, and I quote: “What’s an inverse fund?”

During a business lunch, I asked another broker if he worked the downside for his clients. The response was “They can’t handle the volatility”.

In his case, he knows the vehicles are there (inverse funds) but he doesn’t use them; only working the upside.

Shorting The Market

My first short sale was back around 1995.

I shorted ‘against the box‘, when you could still do so. The short trade was Alcide.

In the May 1993, edition of my newsletter (see About) ‘Market Order Letter’, published by my firm, Equity Research Corporation, Alcide received initial coverage.

Prior to that edition, I managed to get a phone interview with Mr. John Richards, Vice President, and Chief Financial Officer of the company.

Remember that I was simultaneously employed as Engineering Technical Manager, for an avionics company. So, the interview was performed on my lunch hour.

During the call, I had made it past the receptionist, then secretary, and then to Mr. Richards, specifically.

Initially, the interview was not going well.

I could tell he considered me an annoyance and rightly so. That was, until I mentioned the competition and how they were going to deal with that.

At the time, Isomedix, had a plan to irradiate chicken (carcasses) to prevent salmonella. Conversely, Alcide had a product that was sprayed on (i.e. low-tech) and biodegradable.

When I mentioned Isomedix, the tone of the conversation changed instantly. I had done my work; I knew the market and wasn’t some newbie (even in ’93).

Mr. Richards opened up and gave me a fantastic interview discussing all manner of things. I did not tell him I was on my lunch hour and in the end, had to politely say, ‘You must be busy, so I’ll let you go’; thank you for your input.

Alcide (ALCD) was a ten-bagger that ultimately went from about $3/share to above $60/share (actually, a twenty-bagger) before being acquired by Ecolab.

Which brings us back to the ‘Retail Investor’

Still Buying The Dip

One more thing about the trading class mentioned above.

After the short-selling topic was covered, the instructor went on to say, the fact we were sitting in that room, separated us out from the massive herd of ‘investors’.

At that time, there were about 40,000 – 60,000 professional traders in the U.S. Although still neophytes, we were considered in that group.

That’s 60,000 out of 240-million adults, putting the ratio at around 0.03%

Now, on to ‘the dip’.

This article out from ZeroHedge has the data saying, ‘Retail’, is still buying the dips although the average portfolio is down a whopping -34%, for the year.

Without getting into specifics, the most conservative account managed by my firm is up over 30%, for the year, which includes the LABD, whack from this past Friday.

Note: An updated analysis of Biotech SPBIO, inverse LABD, and LABD-22-03, is scheduled for tomorrow.

Fuel, For The Downside

Over a century ago, Wyckoff wrote about the behavior of those on the wrong side of the trade.

That is, they are the ones who provide the fuel for the next move. In our case, that would be fuel for the downside.

Investors are buying the dip, because that’s all they know how to do.

It’s a sign of desperation.

Hoping that somehow, the markets will pull them out and return things to ‘normal’.

If you’ve read this far, you already know, ‘normal’ is gone.

Whatever happens next, (except for the starvation) will be completely new.

Stay Tuned

Charts by StockCharts

Note:  Posts on this site are for education purposes only.  They provide one firm’s insight on the markets.  Not investment advice.  See additional disclaimer here.

The Danger Point®, trade mark: No. 6,505,279

Weekly, Wrap-Up

The Usual Suspects

No. 1

‘Finger Snap’ Offense

As if to drive the point of yesterday’s post home, we have this just out from ‘Economic Ninja‘.

People are offended by him snapping his fingers at the beginning of each video.

You can’t make this stuff up.

But wait, there’s more.

Those same snowflakes go on to say they’re offended that ‘Ninja’ is planning to take advantage of the real estate crash; being liquid at the bottom so he can buy-in, at pennies on the dollar.

I wonder how many of these coneheads are ‘financial advisors’, but I digress.

No. 2

‘Sudden Adult Death’

Yes, ladies and gentlemen, after thousands, if not tens of thousands of years of humanity, we have a brand-new disease.

Doctors are “baffled”. Who can it be now?

Wheels are set in motion for decades of repercussions.

We’re still at that leading edge.

No. 3

More Airplanes Going Down

This would have nothing to do with No. 2, above, right?

Link is here.

No. 4

So, It Was Just The Flu, All Along?

Daivid Knight, in his broadcast talks about the weasels attempting to jump ship.

Take a look.

Good thing this site figured it out long ago and well before it was obvious.

No. 5

It’s The Dollar (for now), Not Gold

When the forecast does not go your way, especially for gold, all you have to do is say, “It’s all rigged”.

That’s not very useful; especially if one is attempting to allocate assets as my firm does.

The article linked here, says part of the problem gold’s not higher is because of the strong dollar.

Wouldn’t it have been nice to know, eighteen months ago, the dollar was in position to rally?

Like this post did, for example. 🙂

Stay Tuned

Charts by StockCharts

Note:  Posts on this site are for education purposes only.  They provide one firm’s insight on the markets.  Not investment advice.  See additional disclaimer here.

The Danger Point®, trade mark: No. 6,505,279

Economic Free-Fall

Anecdotal Data, Says Implosion

As we speak, economic activity is shutting down … fast.

Amazon shipments cancelled, gas stations going dry, banks halt lending, real estate sales collapse.

Meanwhile, the market’s in a short-squeeze.

What happens next?

We’ll discuss real estate and biotech farther down but first the data sources.

Dan from i-Allegedly reports here, he still has a couple of rubes (my word) that think the market just bottomed out.

Good luck with that.

As we’ll show below, the real estate bear market (IYR) rebound, was identified ahead of time.

Next, we have Red Hurricane describing one semi-trailer load after another being cancelled. He hauls for Amazon.

Shipping activity’s contracting, seemingly, by the minute.

Lastly, this link where the D-word, ‘Depression’ is used within the first one-minute, twenty seconds.

Bottom-out in the stock market? Probably not.

So, let’s take a look at real estate IYR, and see where it might go next.

Real Estate IYR, Weekly Chart

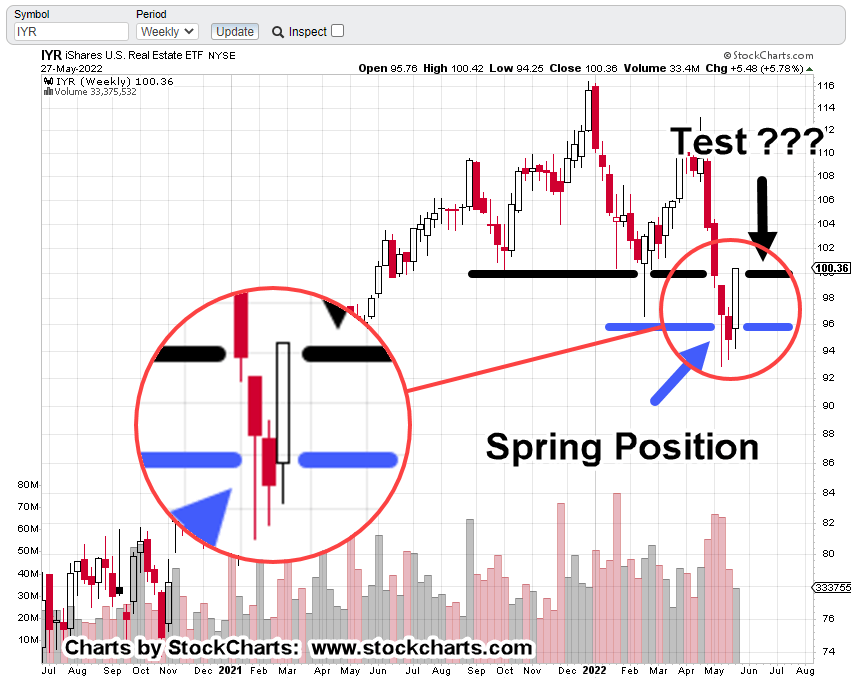
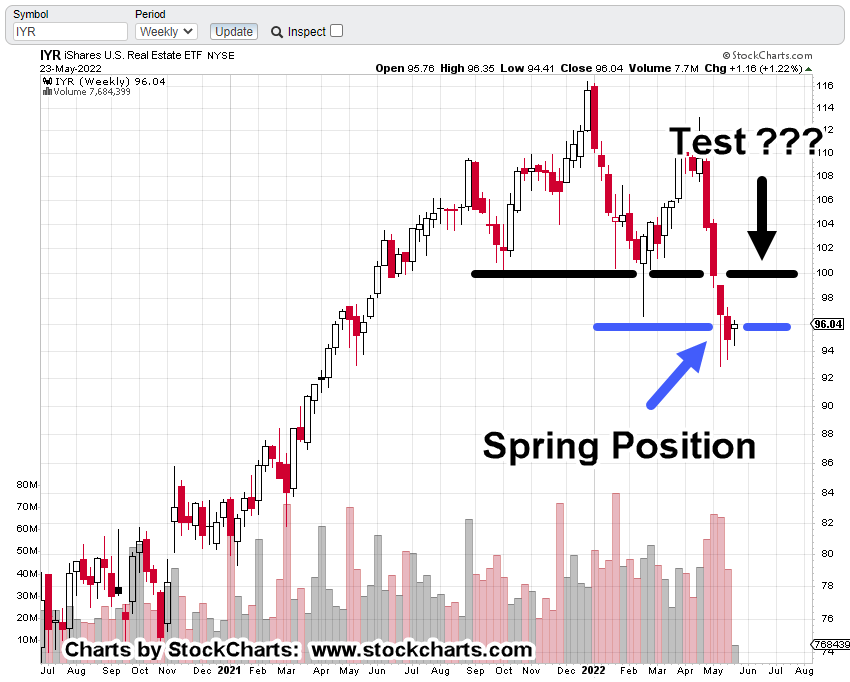
The last update (link, here) showed potential to rise into a test of resistance. That’s exactly what happened.

Back then:

And now:

With zoom

Obviously, the upward test happened much quicker than anticipated … but it was anticipated … no surprise.

Real estate got itself into Wyckoff spring position; so, a rebound (test) is normal market behavior … short-squeeze or not.

If it was a squeeze and if it’s over, we can expect an immediate drop in price action. We’ll analyze that as it plays-out in the coming week.

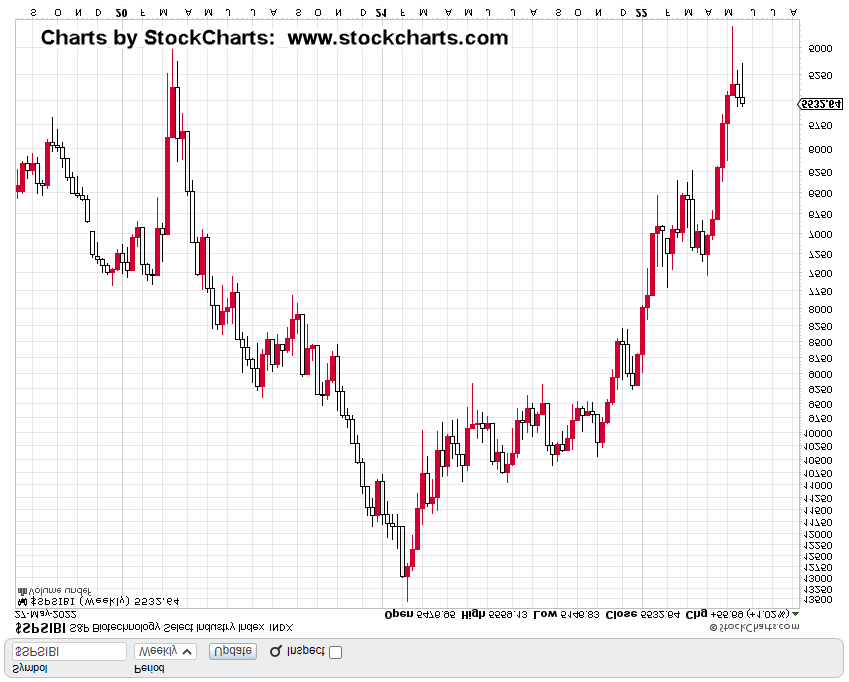
Now, on to biotech, SPBIO

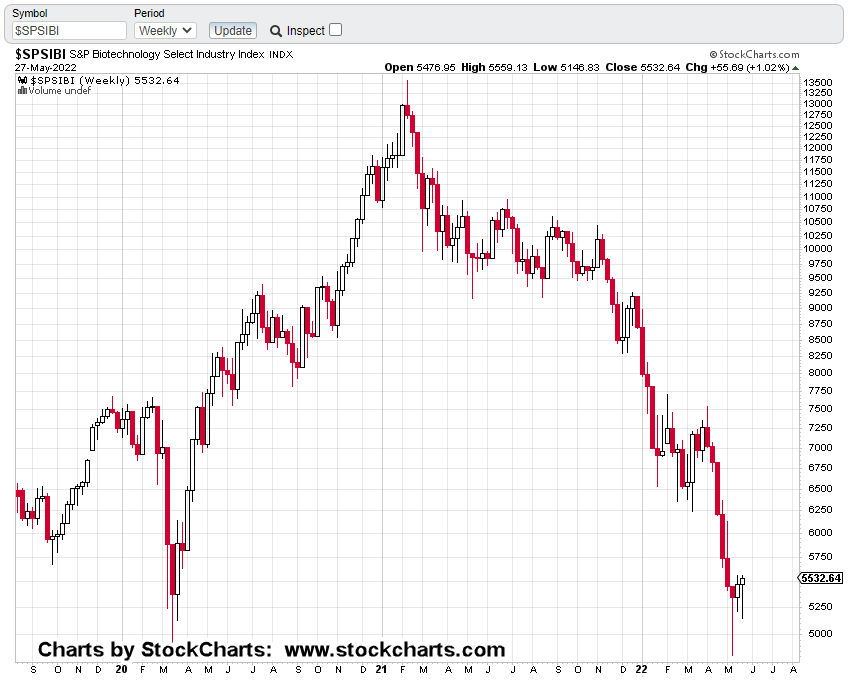
Biotech SPBIO ($SPSIBI), Weekly

Some housekeeping first.

Obviously last week, with being short, more downside action was anticipated resulting in upside for LABD.

On Friday, that did not happen. Biotech was part of the squeeze as well.

The short position via LABD, identified as LABD-22-02, was reduced but not exited completely (not advice, not a recommendation).

At present this is where we are.

First, we’ll start by inverting the chart to mimic the action of 3X inverse, LABD.

Next, we’ll zoom-in and highlight the ‘squeeze’.

Doesn’t look like much when viewed that way does, it?

Next, we’re going to zoom-in, on the zoom

In spite of all the squeeze chaos on Friday, price action could not post a new weekly low (high on the non-inverted).

We’ll see this Tuesday, if that’s important or not.

This post is getting long but let’s end with the rule of alternation. The same chart is marked up below.

If this rule is still in-effect, we’re at a juncture where one can expect a ‘simple’ alternation.

We’ve already had complex action on the prior congestion; so, we can expect current action to be simple in character.

That means, price action’s not likely to stick around at these levels whether it’s going up or down.

Based on the above analysis, the expectation for Tuesday’s open is a gap lower for SPBIO and higher for LABD.

If that does not happen, something else is at work … we’ll report on that as necessary.

Summary

Has the market bottomed out? Not likely.

Those who are at this late stage, still arguing with Jerimiah Babe and Dan (and Patera), that the market’s rebounding, everything’s fine, are in a state of delusion.

The mindless herd following spending with ever newer cars, moving up to the McMansion, opulent vacations, posting it all on Facebook is most decidedly, gone.

It’s finished. It’s Done.

The problem is, as J.B. notes above (time stamp 7:15 and 8:30), those still living that life don’t seem to know it’s over.

For the leaders, the tiny minority and those reading this post, who are, or who have been preparing for years, it means potential huge (life changing) opportunities.

That is, as long as the markets, the banks and other infrastructure stay open; not guaranteed in any way.

Stay Tuned

Charts by StockCharts

Note:  Posts on this site are for education purposes only.  They provide one firm’s insight on the markets.  Not investment advice.  See additional disclaimer here.

The Danger Point®, trade mark: No. 6,505,279
Could Real Estate Rally?

How Is That Possible?

It’s possible, because price action is always the final arbiter.

Before the rest of the report, some housekeeping.

Real Estate IYR, has broken the down trend lines previously discussed.

A discretionary (not stop related) exit was performed on all positions at approximately DRV 46.45.

Trade DRV-22-02, is officially closed.

If the market turns around and looks like IYR is about to resume its downtrend, the DRV position could be re-established (not advice, not a recommendation).

As it stands, profit on the entire DRV-22-02, was in the vicinity of +19.2%.

That’s not too bad, considering the rest of the population is losing their shirts as reported here.

There were 25 DRV, transactions during the trade.

Where to Now?

Real estate can resume the downtrend, or it can test the underside of support, now resistance (shown below).

Under ‘normal’ market conditions, a test is typical behavior.

However, we’re in a financial collapse so anything is possible.

Real Estate IYR, Weekly

The chart above paints a familiar picture.

The overall trend is down. However, that does not mean price can’t go higher.

In fact, as we all know, the sharpest rallies occur in the middle of bear markets.

Whether we get one now, is unknown. Typical market behavior is to come back to the resistance area (black axis line) for a test.

Summary

From personal standpoint, I’ll take the near 20% gain (not advice, not a recommendation) and stand on the sidelines for a more definitive set-up.

Stay Tuned

Charts by StockCharts

Note:  Posts on this site are for education purposes only.  They provide one firm’s insight on the markets.  Not investment advice.  See additional disclaimer here.

The Danger Point®, trade mark: No. 6,505,279

It’s a Minefield !

Intentional Distraction ?

Is the objective to create as many news stories (fake or not), along with incessant and contradicting market analysis with the objective: Shut down and distract even the most disciplined trading professional?

The market’s going up, it’s going to crash, it’s in a short squeeze, Goldman ‘says’, then ‘says not’ and on it goes.

If memory serves, the propaganda during the 2007 – 2008 meltdown, wasn’t nearly this bad. Of course, that was before the Smith-Mundt act was repealed … but I, digress.

There are even a few unfortunate dolts that don’t’ even know anything’s happening at all.

Take a look at Dan’s (i-Allegedly) latest video here.

He talks about the number of people contacting him to say ‘it’s not that bad’, or ‘real estate’s going much higher’, or ‘whatever’ as Dan likes to say.

He does present from the (ethical) sales professionals a recognition, real estate’s ‘finished’ for this go-round.

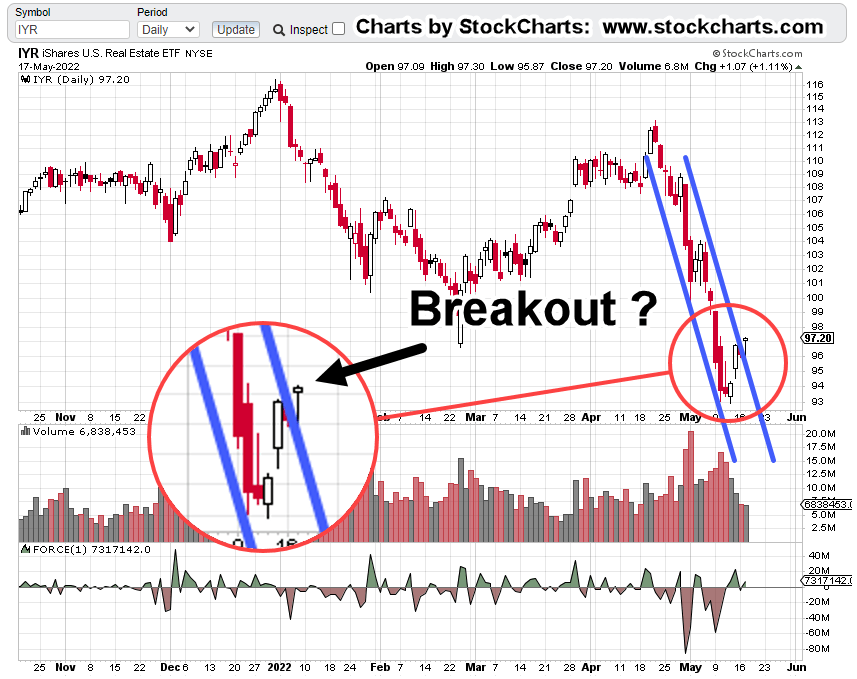
Even while we get reports like this one, where sentiment is so bad, a rally is imminent, the trading objective must be to remain focused on the data … price bars and volume.

That’s what we’re going to do as outlined below.

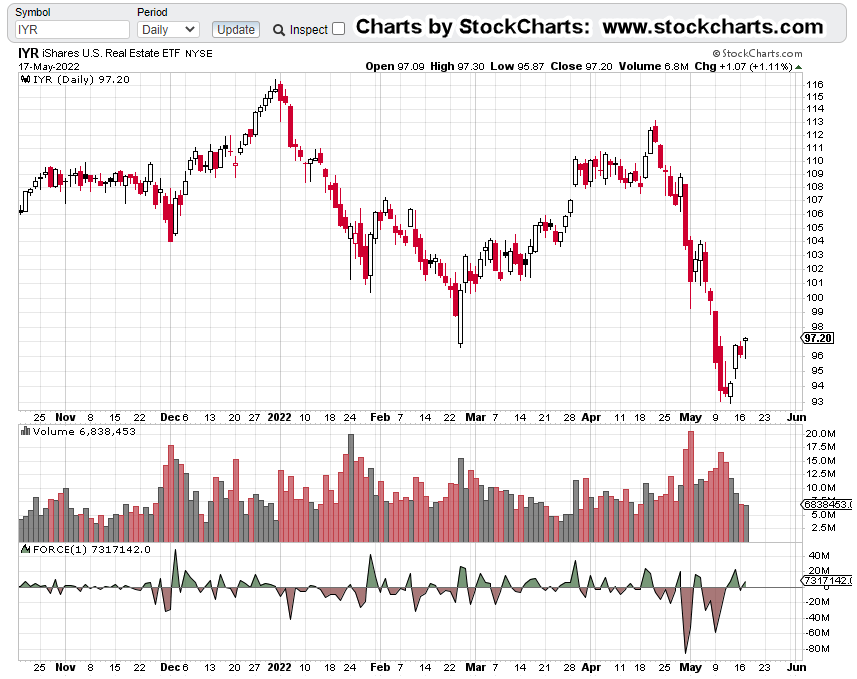
Real Estate IYR, Daily Chart

The un-marked chart.

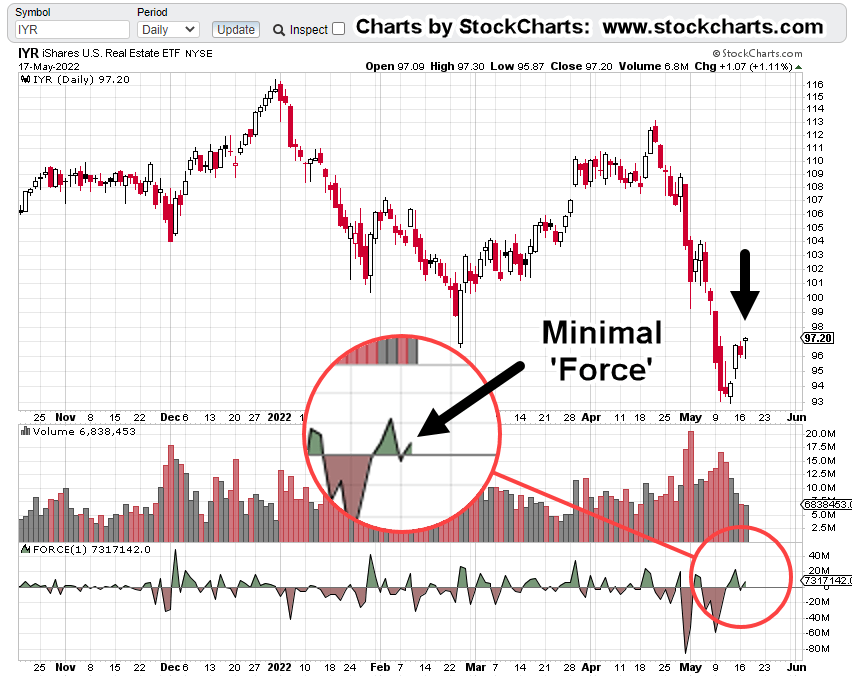
Now, let’s get to the ‘force’ behind the rebound of the past four trading days.

The tiny blip circled, was all there was for upward energy from yesterday’s move.

Price action inched up just over 1%.

Looking at the situation from a trading channel standpoint, we see yesterday’s action got just outside the well-established trend lines.

So, we have a little ‘blip’ outside the trendline on minimal volume and force.

The news story linked above (repeated here) says a ‘short squeeze’ is imminent … at least for the tech stocks.

What about the rest of the market? Is real estate going to breakout as well?

That actual (IYR) data says, anything can happen; however, with such anemic upside performance, the expectation is for IYR, to resume its downward trend.

Positioning

It’s about forty-minutes before the open and we already have DRV, pre-market activity.

Because the (bid/ask) spreads are so wide in both IYR inverse funds SRS, and DRV, pre-market activity is rare.

Nonetheless, 3X inverse DRV, is trading higher at +0.79 points or +1.71%, indicating that IYR will have a lower open.

That means, the DRV low of yesterday (DRV 45.64) would make a good stop location for any positioning (not advice, not a recommendation).

Summary

Wyckoff analysis is independent of the news or the financials. He discovered as early as 1902, that prices are moving from a ‘force of their own’ having nothing to do with fundamentals.

The action itself will point to the next likely outcome.

Stay Tuned

Charts by StockCharts

Note:  Posts on this site are for education purposes only.  They provide one firm’s insight on the markets.  Not investment advice.  See additional disclaimer here.

The Danger Point®, trade mark: No. 6,505,279
Real Estate … Test & Reverse

Probabilities Are High, For Lower Action

Real estate’s in the … well, it’s in the outhouse; we’ll leave it at that.

Today was the day where IYR had the opportunity to build on any momentum gained over the last two trading sessions (Thursday, Friday).

Today, the index posted a new daily high within about fifteen minutes after the open.

Then, it spent the rest of the day trying to move higher.

Additional new highs weren’t happening; about a half-hour before the close, price action began to fall away.

That’s where we are now.

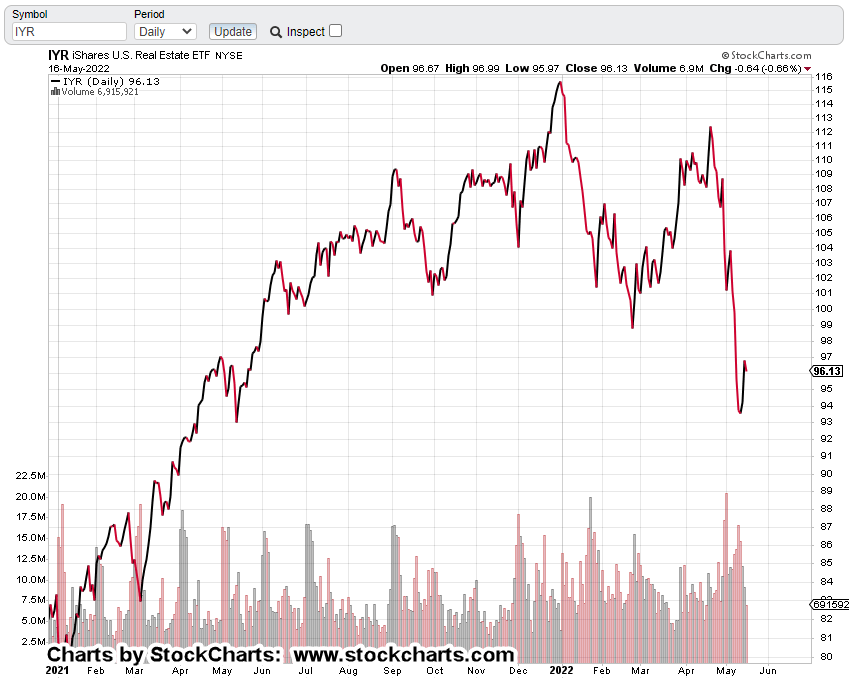
IYR Daily Close

The next chart makes the situation more clear.

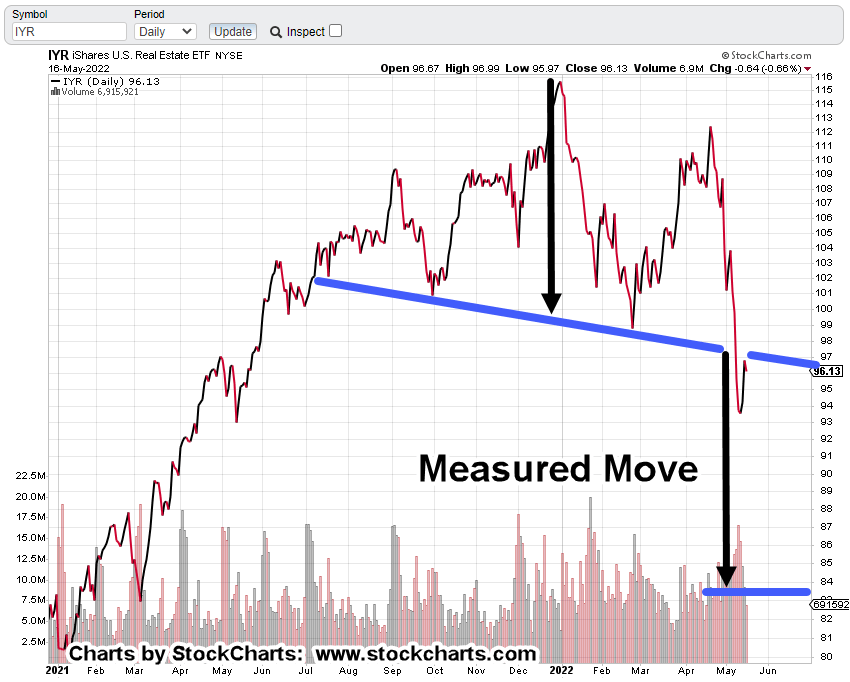
There’s a Head & Shoulders top, a neckline, break of the neckline, test and reverse.

The fundamental pressures continue to build.

Interest rates remain elevated but even if they come down, it’s already in the works; buyers don’t qualify, layoffs are starting in earnest and it’s all unraveling … very, very fast.

This very same scenario has been played out in history; over and over, bubble after bubble.

We’re now in a multi-year, to multi-decade decline (if it ever recovers).

Measured Move

The chart above shows a measured move target in the area of 83.5, for IYR, providing that price action continues its decline.

The chart in the prior post, had a Fibonacci projection to the 80.5 area. So, the targets are similar.

Actually, this is what we want.

If we can use different analysis methods to come up with essentially the same target, it increases the probability of meeting that target (not advice, not a recommendation).

Positioning

The DRV position remains active; DRV-22-02.

If IYR posts a new daily high at tomorrow’s session, it points probabilities to either a protracted choppy test, or a rebound to higher levels; if either of those scenarios take place, the position will likely be exited.

Stay Tuned

Charts by StockCharts

Note:  Posts on this site are for education purposes only.  They provide one firm’s insight on the markets.  Not investment advice.  See additional disclaimer here.

The Danger Point®, trade mark: No. 6,505,279

Weekly, Wrap-Up

The Usual Suspects

Bogart

No. 1

Airplanes Dropping Like Flies.

A very brief search of the most recent crashes or incidents are here, here, here, here, here, and here.

It’s all just a coincidence or maybe it’s because of this.

The repercussions of on-going events are just getting started.

This is a long-haul chess game.

No. 2

Americans Take Up The Gauntlet … Go To Vegas

What a pathetic bunch of cowards.

If you’re blowing whatever’s left of your money (or credit), it’s likely you have no real marketable (high pay) skills, no talent, lazy, obese; so, we’re off to Vegas.

Add to that, we’re just at the start of the depression.

Patera, from Appalachia’s Homestead (time stamp 4:24) addresses the problem a little differently but her final assessment is the same.

It’s true, there are some barriers to learning a new skill.

Dan from i-Allegedly points out the high cost to get a CDL, to be a trucker.

However, those who are awake, those with their nose in the KJV Bible, those leaving the corrupt church (in droves), knew that current events were coming; they took action way before it became obvious.

Remember this post?

It’s been nearly two years, to the day.

No. 3

Deflation Indicators

Not all prices are rising.

As the real estate sector gets vaporized, we have the natural fall-out, building materials dropping in price.

Uneducated Economist reports here, that’s exactly what’s happening.

Price reductions as we’re going into the summer building season, is a massive indicator of evaporating demand.

No. 4

Food First … Then Gold & Silver

Everything is going according to (their) plan.

Yet another indicator of the current strange weather (warfare) that’s going to strain the system.

Here’s the link to the very first post that specifically referenced Genesis 41; posted on December 31, 2020.

As with the ‘Mask on, Mask off (linked above), how has the post aged?

Is it still relevant?

What about this quote … seemed extreme at the time.

They paid for the corn first, with gold and silver.  Then they paid with their livestock.  Then they paid by selling themselves into life-long slavery. We can equate that last part (slavery) as getting the vax.

No. 5

Chess Board Strategy

It’s a bitter pill to realize we’re in the long game. ‘Normal’, is not coming back … ever.

That does not mean there’re no opportunities. There are.

Those opportunities (if we survive) are/will be potentially life changing for the good.

The Sunday futures market opened about two hours ago and we’re up around +0.40%, in the S&P.

Let’s see if that spills over to the Monday open; remembering that we’re short the real estate sector with the finger on the sell trigger (not advice, not a recommendation).

Stay Tuned

Charts by StockCharts

Note:  Posts on this site are for education purposes only.  They provide one firm’s insight on the markets.  Not investment advice.  See additional disclaimer here.

The Danger Point®, trade mark: No. 6,505,279

Weekly Wrap-Up

The Usual Suspects

It’s about two hours before the Sunday futures open and we’re about to see what happens next.

In the meantime, the links below are from the week just past or of special note for our bear-market conditions.

Like Mike Tyson says …

‘Everybody’s got a plan ’till you get hit in the face’.

The following are not in any particular order.

No. 1

The ARKK Takes On Water

It can probably be safely stated, this ARKK, was not likely built to Biblical specifications.

Maybe they used the wrong Wood. 🙂

No. 2

Hold The Narrative At All Costs

If one lives long enough, eventually you may reach the point where you’re tired of being played.

Once that happens, eyes are opened, you see the narrative clearly; that’s it’s everywhere.

Take this link for example … oh so many narratives.

Like defining ‘investor’ and ‘trader’; defining how each of those two behave in the markets.

The article surmises that investors think traders are not as smart as they because … well, investors have more letters after their names (CFA, CFP, CTA, and on … maybe even PhD … whooo).

Traders, well, they’re just circus monkeys and volatility junkies.

This narrative is beat into the collective conscious incessantly as far as can be remembered. It keeps the herd (investors, traders alike) firmly in the box.

Remember this link?

However, the great speculators back in the day, Livermore, Wyckoff, Loeb, were none of those things.

Their actions were determined on what the market was saying about itself.

Obviously, if you’re isolated, focused on what price is actually doing, not watching the news, then you’re not part of the herd.

You’re going against the (established and approved) narrative, a dangerous animal indeed.

No. 3

Bear Market Links

It’s time to brush up on bear market strategies.

Links are here, here, here, and here.

No. 4

Collapse, Baked-In

When you have stupidity like this … who needs earnings?

No. 5

Who is Shooting at Whom?

Here’s a story you won’t see on the mainstream news.

No. 6

Tulip Bulb Mania, is Over

When millions of people are starving to death, I’ll sure be glad I invested in a ‘tweet‘ … Not.

Way back in Middle School history class, I could not understand the mania.

I thought to myself … “It’s just a bunch of flowers, right?”

It would have been nice for the teacher to say:

“When you get to adulthood, you’ll be surrounded by morons”.

No. 7

Canada’s Mandates Explained

At last!!!

Here is an easy-to-follow, scientific explanation.

Stay Tuned

Charts by StockCharts

Note:  Posts on this site are for education purposes only.  They provide one firm’s insight on the markets.  Not investment advice.  See additional disclaimer here.

The Danger Point®, trade mark: No. 6,505,279