‘Now, We See The Violence …

… Inherent In the System’

It may as well be a Monty Python skit.

The number of opinions forecasts, pontifications and gesticulations have reached levels beyond the absurd.

Everybody’s important and has some intellectual and/or philosophical missive to promulgate.

We have great levels of insight like the selected items below. As promised, these comments were taken from the article linked in the last post.

“I don’t need to pay some 78 year old to hold 1/2 my money in cash”

“What a joke. We’re heading for multi-year blow-off top”

“78 year old fund manager loses his azz … markets going nowhere but up”

“Parabolic increase to nosebleed levels and an epic explosion 3 years from now.”

Seems our idiot/lazy Boomers, Gen-X-rs, Millennials, Gen-Z-rs, and just about everybody else, is the genius in the room; except for the 78-year-old.

He’s just a buffoon.

If someone has no real skill, experience or initiative, they resort to trash-talk like we see above.

Getting the right experience is the hard part.

Having experience in the markets involves many years of education (i.e. losses).

Just for documentation’s sake, let’s take a look at two examples of what experience looks like; each in their own respective industries.

Exhibit A:

Go ahead, check out this Bubba from Amarillo, Texas.

His customers drive from neighboring states, hundreds, if not thousands of miles away to have him rebuild their transmissions.

Within the first 5-minutes of the video above, there’s probably 30-years of experience on display.

I would suspect his rebuilds go for top-dollar; rightly so.

Then, we have this:

Exhibit B:

Yesterday’s market action, and today’s, has happened before.

That is:

A sharp multi percentage point, headline grabbing spike higher (within a down market), that’s immediately reversed the very next day.

Not only that, but the reversal also signified a bear market had started in earnest.

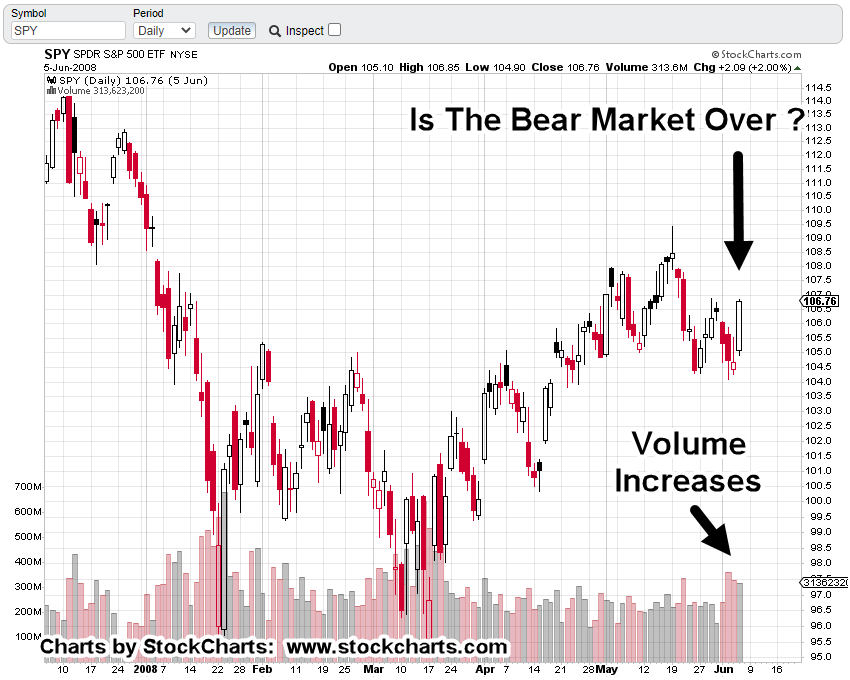
S&P 500, SPY, Daily Chart

Let’s set the stage.

In our example, the S&P had already topped and reversed.

It spent the next seven months heading lower and then retracing upward to an eventual downside reversal.

The next leg down continued, but then a few days later, there’s a massive, headline grabbing, upward spike.

Is the bear market over?

Is this the signal to buy the dip like our ‘experts’ above think for the current situation?

The next day, price action reversed the entire gain (like it has done today).

The chart shows the result.

From a personal standpoint, a 78-year old that’s still mentally sharp enough to provide his services and is not an obvious (globalist) sell-out the likes of which are on CNBC, then I’m very keen on what he would have to say.

His message: It’s the biggest bear market of his life.

Secondly, as Dr. Elder has said, ‘Trading is an old man’s game’. A good memory is critical to creating an edge.

In our example, I remember that upward spike well.

It was a Thursday.

The next day, price action reversed hard to the downside.

It never looked back for nine months.

Summary:

Is the S&P scenario described above, where we are now?

History never repeats itself exactly.

However, one can propose with some level of confidence, if today was the kickoff to the next leg, it has potential to be the fastest, farthest down price action in market history (not advice, not a recommendation).

Stay Tuned

Charts by StockCharts

Note:  Posts on this site are for education purposes only.  They provide one firm’s insight on the markets.  Not investment advice.  See additional disclaimer here.

The Danger Point®, trade mark: No. 6,505,279

A Day To Remember

Was Today The Inflection Point?

There were so many comments on the ZeroHedge article (linked here) about the musings of a 78-year-old money manager (effectively saying he’s an idiot … a dolt), we’re going to use those comments for reference on a go-forward basis.

Everybody has an opinion but nobody’s actually looking at what the market is saying about itself.

That’s where the answers will be found … no matter one’s personal bias.

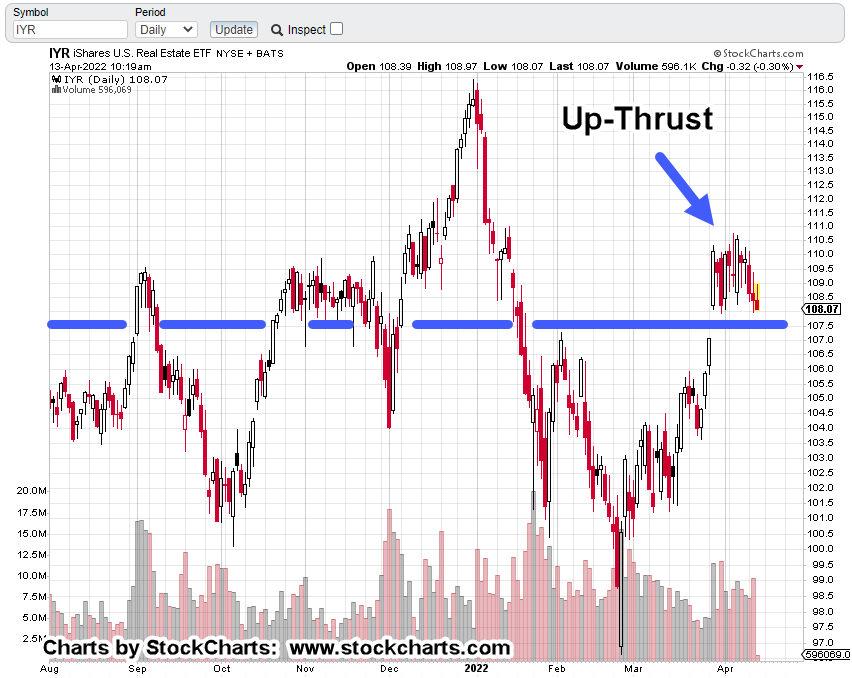
Looking at real estate IYR, we see that price attempted to get above the axis line shown but did not make it.

Before we go further, a correction: The last post said the stop on DRV-22-02 was located at DRV 32.71.

The stop is actually located at DRV 37.21. Numbers got swapped.

Real Estate IYR, Daily

It’s interesting to note, ProLogis (PLD), the largest cap in the sector did not close higher for the session.

If IYR, with other indices do not have a decisive follow-through (stopping out DRV-22-02, in the process) at tomorrow’s session, the Ponzi scheme’s in serious trouble.

As already stated, events may happen faster than anyone expects.

Summary

We’ll leave off with this just out from ice-age-farmer; linked here.

The collapse of the entire food supply has been building (sorry, in the planning stages) for years.

It’s intentional.

Does anyone think that ‘raising rates into weakness’ is not also intentional?

Stay Tuned

Charts by StockCharts

Note:  Posts on this site are for education purposes only.  They provide one firm’s insight on the markets.  Not investment advice.  See additional disclaimer here.

The Danger Point®, trade mark: No. 6,505,279

Gold To Rally ?

In Position For Upside Test

As long as almost no-one catches on to the Fibonacci time correlations playing out in real time, they’ll continue to have validity.

First, some housekeeping.

The downside action in Junior Miners GDXJ, was a vicious move; from top to bottom (thus far) it dropped over – 17.5%, in just six trading days.

This type of collapse was not really expected as YouTube and ZeroHedge are still filled with the manic bulls.

The short position, JDST-22-04, launched higher as a result.

Taking advantage of the hysteria, that position was closed out today (not advice, not a recommendation).

The expectation is for some type of relief rally in gold and the miners.

Gain on the whole event, which included three entries and three exits was around +24.1%

Moving on to the chart.

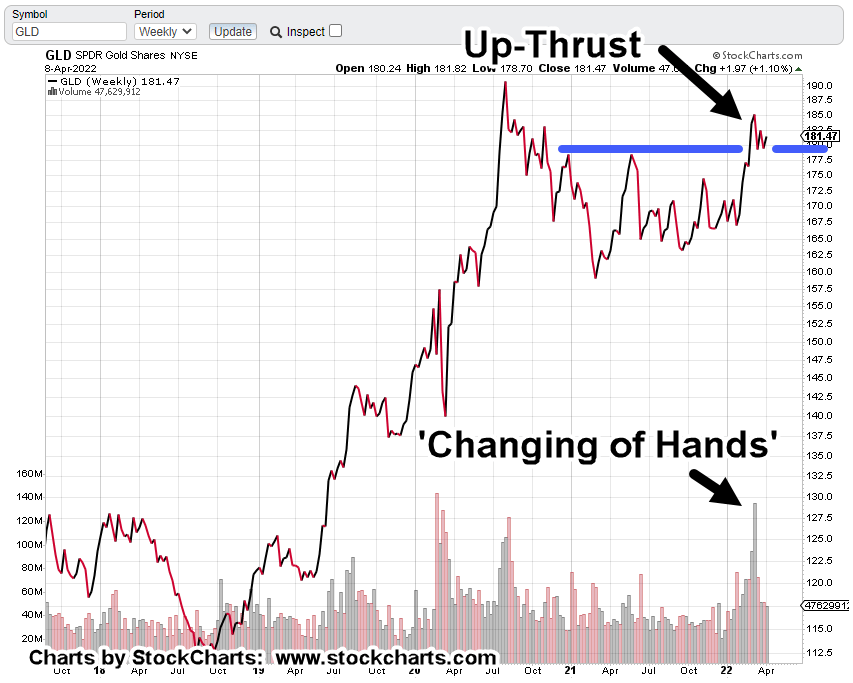
Gold (GLD) Daily

We’re at Fibonacci Day 34 and have just slightly penetrated support (blue line).

That puts GLD, in Wyckoff Spring position … although the push below support was not really enough to expect a rally (if it occurs) to go very far.

Today’s action opened up a significant gap and it just so happens, the close of Friday’s bar (April 22nd) is right at 23.6%, retrace.

Stay Tuned

Charts by StockCharts

Note:  Posts on this site are for education purposes only.  They provide one firm’s insight on the markets.  Not investment advice.  See additional disclaimer here.

The Danger Point®, trade mark: No. 6,505,279
Real Estate (IYR) To New Highs ?

If The Bond Market Reverses

The previous bearish analysis was overwhelmed by the larger, upward trend.

Instead of continuing lower, real estate IYR, moved higher. It’s now at another inflection point.

The position in DRV (DRV-22-01) was exited at 32.66, when it was obvious the trade was going to fail.

Taking a hit like that gets one’s attention; there must be something else going on … something on a larger timeframe.

There’s nothing wrong, with being wrong.

However, there is something wrong with being wrong and staying wrong.

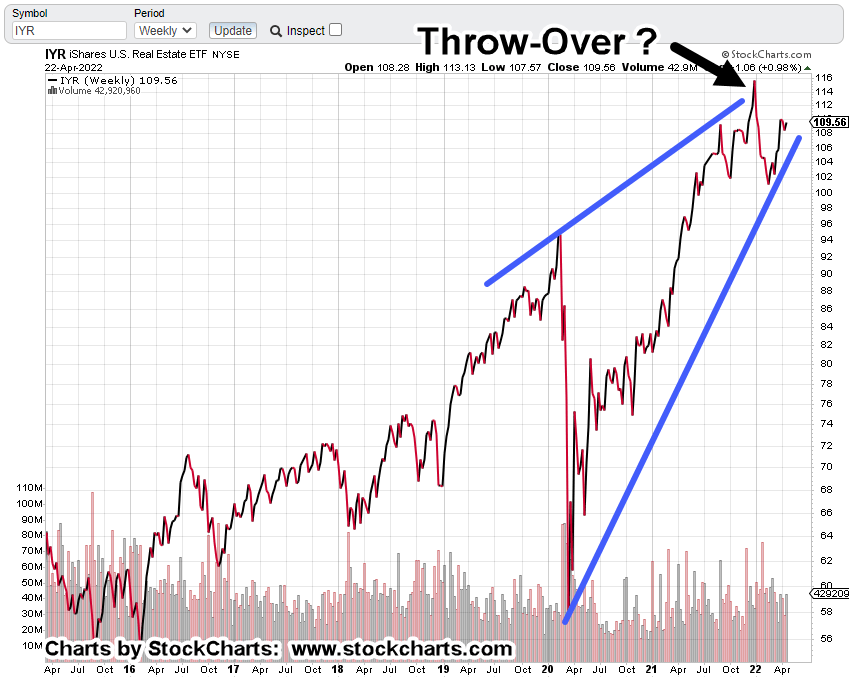
If we pull farther out to the longer, weekly timeframe, it looks like there’s danger ahead; possible new all-time highs and Wyckoff upthrust (potential reversal).

Real Estate IYR, Weekly

As with the Junior Miners, GDXJ, it looks like we have yet another Fibonacci time correlation.

During the financial crisis, IYR, posted its low the week of March 6th, 2009.

Thirteen years later, another major inflection point?

Shown below, is a terminating wedge that may have already completed a throw-over.

One probability suggesting new highs instead of a reversal at this point (which seems like even odds) is the repeating tendency of markets to go from ‘spring to upthrust‘.

This site has presented over and again, it’s a common market behavior.

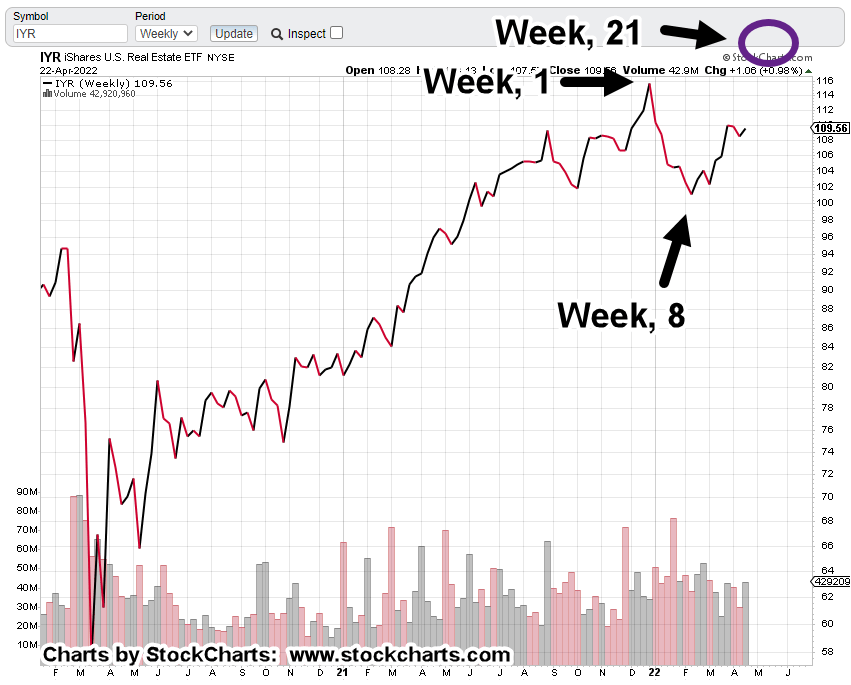
Getting closer-in on the weekly, the spring set-up is identified.

Now, comes the Fibonacci time correlation.

From the all-time highs, the market closed at the lows on Week 8. The print low came one week later.

Using that information and projecting forward, if this correlation is in effect, if it’s valid, we can expect an up-thrust high somewhere during the week of May 20th, to May 27th.

The Bond Connection

The economy is collapsing. The food supply is being destroyed. The consumer is tapped out and using credit to survive.

What on earth could be a catalyst to move real estate, the most illiquid market of all, to new highs?

Bring in the clowns … sorry, the financial press.

Word on the street is the bond market, may be in position to reverse higher.

No doubt, there’s a good technical reason for reversal, linked here.

It’s the financial press and their real estate narrative that will (may) be preposterous.

That is: If bonds (TLT) move higher, mortgage rates will come down, consumers will jump on the opportunity and therefore, she’s a witch !!!

Summary

We’ll see if IYR meets the price and Fibonacci time correlations for potential reversal.

Once there’s a reversal in this market, it tends to do so with a vengeance.

Rising rates have already cut off deals in the works. Prices are coming down and houses are on the market longer. The consumer is priced out.

The pig is already in the python … once that happens, this market sets up a dynamic of its own, a succession of lower prices and sales collapsing.

Stay Tuned

Charts by StockCharts

Note:  Posts on this site are for education purposes only.  They provide one firm’s insight on the markets.  Not investment advice.  See additional disclaimer here.

The Danger Point®, trade mark: No. 6,505,279

Same Then, Same Now … Gold

Common Characteristics

Every market has its own personality, its own characteristics.

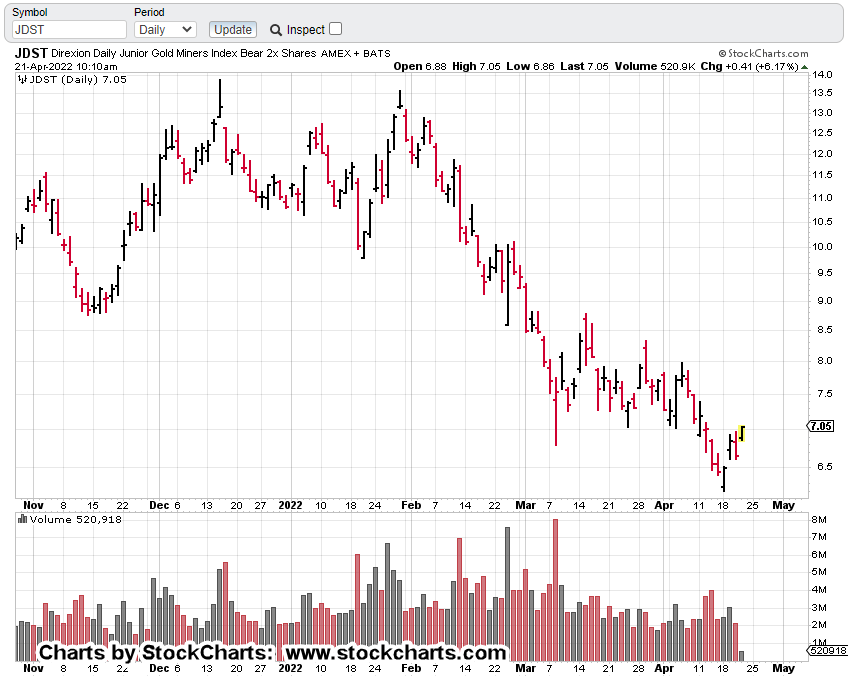
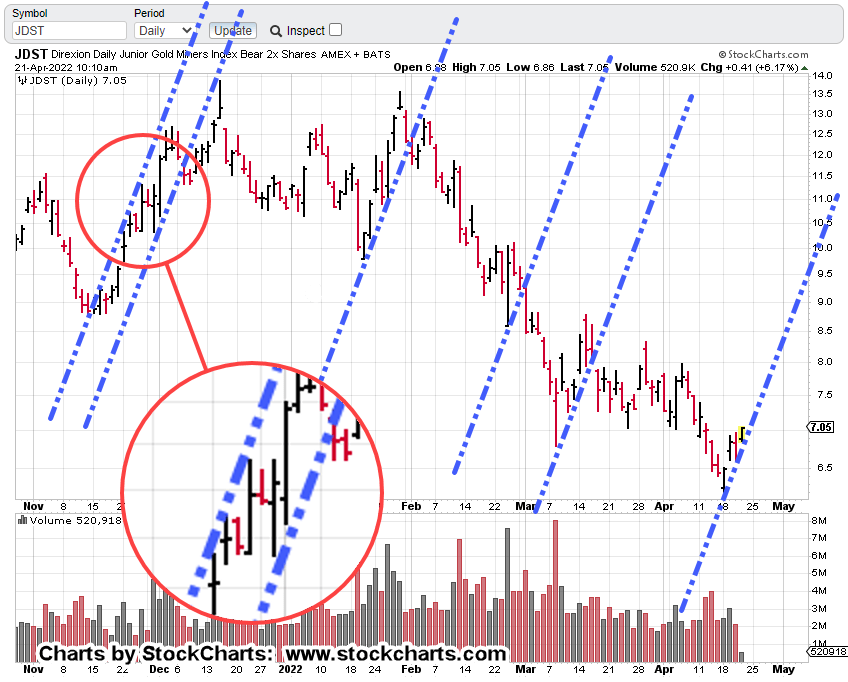
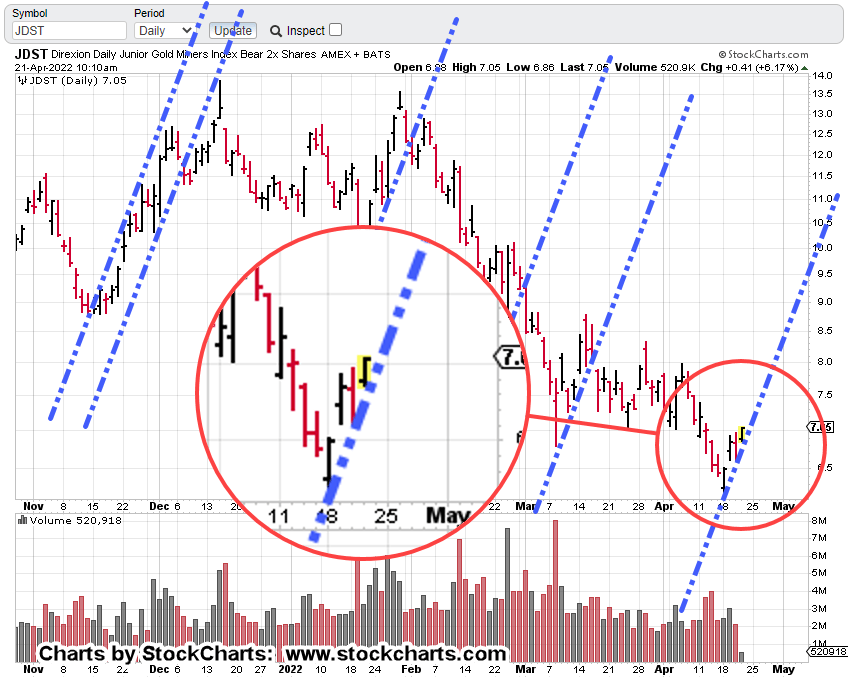
After working the gold mining indices GDX, more specifically GDXJ, a repeating trendline tendency was observed in leveraged inverse, JDST.

That repeating market behavior, shown below.

Junior Miners, Leveraged Inverse, JDST

The un-marked daily chart, first

Repeating trendlines

The next several charts zoom-in on specific areas.

Set The Stop

And walk away …

As the tagline in this post shows with JDST-22-04, we’re already short the Junior Miners via JDST (not advice, not a recommendation).

The current stop, is set at yesterday’s low of 6.61.

Depending on price action today, that stop will be moved up to the recent low (presently @ JDST 6.855).

Summary

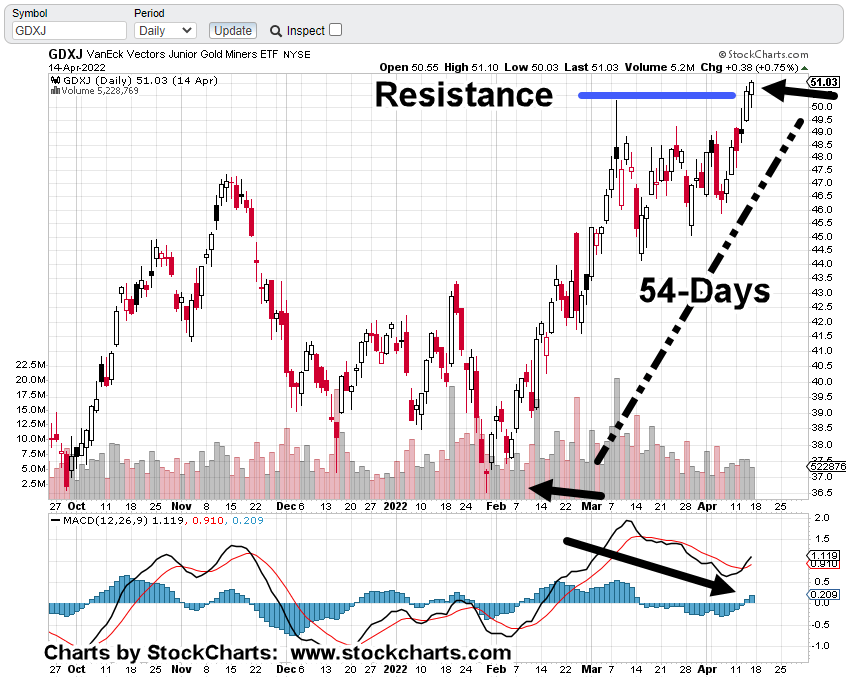
GDXJ, reversed at Fibonacci 55-Days, 13-Weeks from the January 28th, low.

As presented in this update, we’re also Fibonacci 89-Weeks (+1), peak-to-peak.

Time correlation coupled with price action, along with incessant financial press ‘gold standard‘ narrative, gives a near perfect backdrop for a significant downside reversal.

The trade may or may not work out … price action is the final arbiter. However, we’ve already shown the trend characteristic of the market.

A simple but effective way to manage the trade is to follow that trend, raise the stop accordingly and exit when stopped out (not advice, not a recommendation).

Stay Tuned

Charts by StockCharts

Note:  Posts on this site are for education purposes only.  They provide one firm’s insight on the markets.  Not investment advice.  See additional disclaimer here.

The Danger Point®, trade mark: No. 6,505,279
Corn Train Wreck, Continues

One Way Or Another …

The food supply is, and is going to be destroyed; one way or another.

The latest in this ‘planned’ series of events, can be found here and here.

More information on the first link, is here. The initial paragraph says it all.

That second link calls the news a ‘Black Swan’ event.

Really?

It’s been known for years and reported by those who are brave (moving forward despite ridicule, threats, bank account closures), and who had insight, times like these were coming.

As a result, (i.e., since the Derecho) the commodities, specifically corn, have risen dramatically.

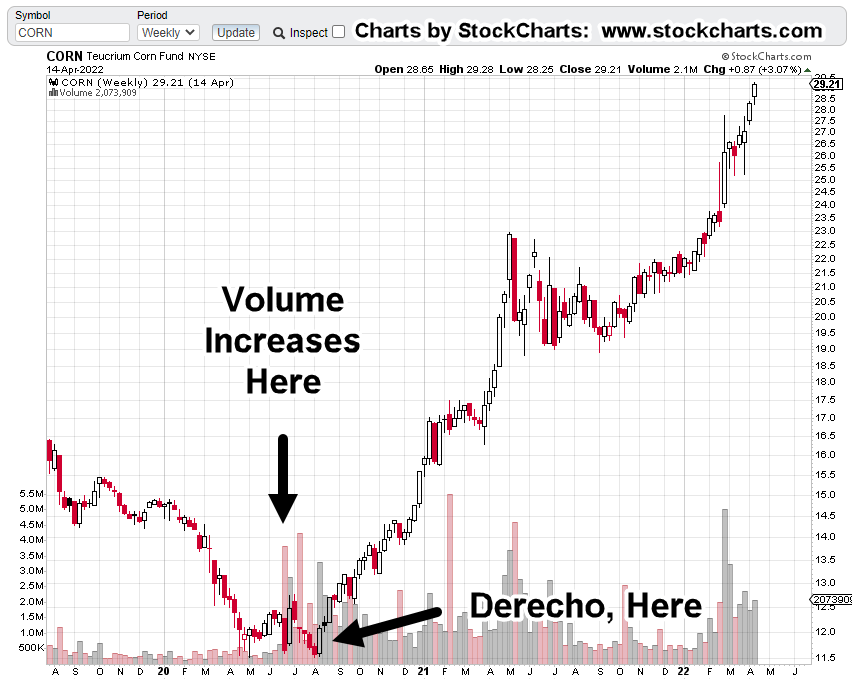
Teucrium tracking fund, CORN, Weekly

Looking and the chart, several items of note.

First: Volume picked up markedly in the fund, before the Derecho of 2020. Almost like someone knew something was about to happen … which it did.

Wyckoff said it best a century ago … those in the know, will have their actions show up on the tape.

Second: We’re currently in Fibonacci Month 21, since the Derecho. Does that mean we’ll have another market event?

Let’s see how the fertilizer news affects the futures market at the next open.

However, more specifically as posted in this update, we’re looking for some type of ‘administration’ announcement that temporally crashes the price of corn.

Third: Getting back to the chart of CORN, the right side is showing signs of potential distribution.

We’ve had the largest weekly volume, ever, during the week of March 4th.

After that, volume has remained elevated … a possible changing of hands and distribution.

Summary

Markets like to test wide high-volume print areas. There’s always a potential for that type of test in any market.

For CORN above, the high-volume area is around 23.00 – 23.50; an approximate drop of -21%, from current levels.

If we get some type of ‘export restriction’ announcement, a (temporary) 20-plus percent drop in CORN, is not unreasonable.

Stay Tuned

Charts by StockCharts

Note:  Posts on this site are for education purposes only.  They provide one firm’s insight on the markets.  Not investment advice.  See additional disclaimer here.

The Danger Point®, trade mark: No. 6,505,279

Gold & Silver, Timeline’s End ?

Government, Is Always Last

The laws enacted by the Government to prevent the crash of 1929, were passed in 1934.

So, now we have at least two states (here and here) eliminating sales tax on the purchase of gold and silver.

Where were they way back in 2001, as the metals were bottoming?

Interestingly (then again, not) it’s a Fibonacci 21-years, nearly to the day, from that 2001 bottom.

That’s not the only Fibonacci correlation being observed.

Let’s take a look at Junior Miners GDXJ, and see if it too, has a Fibonacci event.

Junior Miners GDXJ, Weekly

We’re just one week short of Fibonacci 13-Weeks, from the late January 2022, bottom.

One extra week is well within margin of error when considering the 89-Week timeframe as shown.

But wait, there’s more.

Looking at the daily chart, not only is there a bearish MACD divergence, we’re also just one day shy before it’s a Fibonacci 55-Days, from the 1/28/22, bottom.

Junior Miners, GDXJ, Daily

Can it all line up this perfectly?

Well, it can if no one is watching; that’s where the crowd and the government come in.

Summary

It’s a fairly safe assessment, nobody expects a downside reversal … nobody.

Even though time and again, we have clues that opportunity for precious metals may come later not sooner (not advice, not a recommendation).

The lockdowns in Shanghai with subsequent starvation and bartering (here and here), show under such conditions, precious metals are nowhere on the list.

Closer to home, the Texas Freeze of 2021, exposed that (lack of metals demand) as well.

Housing prices are starting to ease-off as well as prices for used cars.

Gold (GLD) may have reached its peak, March 8th, this year. Let’s see what happens next.

Stay Tuned

Charts by StockCharts

Note:  Posts on this site are for education purposes only.  They provide one firm’s insight on the markets.  Not investment advice.  See additional disclaimer here.

The Danger Point®, trade mark: No. 6,505,279

Bonds Down … Real Estate, Next ?

Visions of 2008 ?

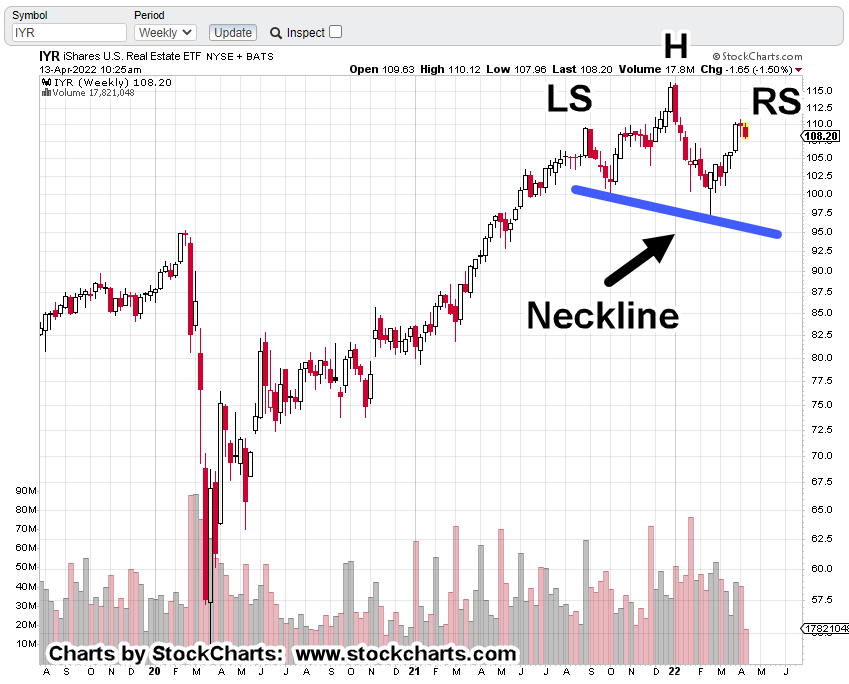
The Head & Shoulders pattern on the weekly chart of IYR, could mean reversal ahead.

Price action’s been attempting to move higher over the past twelve trading days.

‘Attempting’, because it’s not making any significant net progress.

Essentially, we’ve got what’s called ‘evidence of a struggle’ where the bulls may be exhausting themselves.

The last update on bonds (TLT), said they’re at the danger point where an upside reversal was possible.

That update also said:

“At this juncture, there’s either a reversal and much higher levels or down, with rates higher; in turn, leading to the subsequent collapse of real-estate, a-la 2007 – 2008.

Since then, bonds are lower, rates higher. Housing affordability has collapsed.

Real Estate, IYR, Weekly

At this point it’s a clear H&S, pattern.

The daily chart shows IYR, oscillating around an axis, support/resistance line; struggling to move higher (in up-thrust condition) with no real progress.

As with bonds in the April 3rd, update, we’re at the danger point with IYR.

A decisive move below the axis (blue) line would indicate the bulls may be exhausted.

Because price action’s been in this range for over two weeks, lends support to the possibility any breakdown (or breakout higher), may be a sustained, directional move.

Stay Tuned

Charts by StockCharts

Note:  Posts on this site are for education purposes only.  They provide one firm’s insight on the markets.  Not investment advice.  See additional disclaimer here.

The Danger Point®, trade mark: No. 6,505,279

Putin’s Gold … Paradigm, Not

‘Nothing New Under The Sun’

Remember the ‘Silver Short-Squeeze‘?

How the little guy was finally going to ‘put it to the man’; forcing the SLV, ETF, to admit they don’t have enough physical silver to cover?

How did that work out?

Same as it always has … it was a non-event.

Now, we have a supposed paradigm shift the ‘world’ has yet to fully process.

Paradigm, Not

The ‘paradigm’ link above, promulgates the intended or mistaken notion, there are two sides to world events.

Sorry Charlie, operations at world government level(s) are working in how shall we say, ‘lockstep’?

Nothing is a surprise.

So it is with gold. At least it is at this juncture while always keeping in mind, anything can happen.

Gold, GLD, Weekly Close

The message of the weekly close, is straightforward.

We’re at the danger point. The location where it won’t take much to move price in either direction.

If we really are in a ‘new paradigm’, by definition, gold (GLD) must move to new highs.

If other governments world-wide are shifting to gold-backed currencies, by definition, demand will increase and move prices higher.

Higher by not just a one-day blip of 10 – 20 points or even a hundred … but thousands.

It could happen.

In the longer time frame, that may indeed be the case. However, at this point, we have something else afoot.

The Famine, Cometh

Gold has never been the same since the Derecho of 2020.

In fact, that was the pivot point for both gold and corn which are now, inversely correlated.

Here are just a few recent links concerning the food supply; here, here, here and here.

That last one … what a great way to cover the outcome of this link.

It’s a slow-motion train-wreck that’s obvious to anyone that can see.

Summary

Just like there was no ‘new economy’ during the Dot-Com bubble, there’s no ‘new paradigm’, now (not advice, not a recommendation).

The focus remains on what the price action, the market, is saying about itself.

At this juncture, GLD, is at the danger point.

The presence of huge volume during the week of March 11th, suggests a changing of hands from strong to weak.

That in turn, points probability to weak upside (if any) and more likely sideways, or down.

Stay Tuned

Charts by StockCharts

Note:  Posts on this site are for education purposes only.  They provide one firm’s insight on the markets.  Not investment advice.  See additional disclaimer here.

The Danger Point®, trade mark: No. 6,505,279

Russell 2000 … Hit & Run ?

Up-Thrust And Test

Shorts Covered ?


Russell 2000, attempts to break through resistance; reverses and then tests (Monday), just as ZeroHedge says the short squeeze is over.

There’s a lot of trying-to-make-everything-look-complicated, wording in the link above but the take-away is, the market may be finished with the recent short squeeze.

At this juncture, Russell 2000 (IWM) looks like it’s hit long-time resistance around the 211, area and reversed.

The past two trading days may have tested that reversal.

IWM, Daily Close

The support (blue line), now turned resistance has been in-effect for over a year.

The zoomed version below shows it’s clear, at this juncture, price action’s not penetrating resistance.

As with bonds in this report, we’re at the danger point.

This is where risk is least for either short or long (not advice, not a recommendation).

Naturally, with the ZeroHedge report (above) saying that shorts have been effectively covered, price action direction favors the downside.

Stay Tuned

Charts by StockCharts

Note:  Posts on this site are for education purposes only.  They provide one firm’s insight on the markets.  Not investment advice.  See additional disclaimer here.

The Danger Point®, trade mark: No. 6,505,279