According to this, just out on ZeroHedge, that’s what’s happened.
As we’ll see below, there’s certainly something unprecedented going on, specifically in biotech.
The prior update made the argument, biotech SPBIO, has a unique distinction that’s showing up on the leveraged inverse fund LABD, shorting the sector.
For illustration purposes, we’re going to do a little ‘trick’.
The weekly close of SPBIO, is shown below.
This index does not provide volume but we’re going to ‘fix’ that by putting in the lower panel, weekly volume for leveraged inverse fund LABD.
It’s clear, as SPBIO reached all-time highs and reversed, short activity via LABD picked up significantly.
However, the past several weeks tells us from a Wyckoff perspective, something major could be about to happen.
As SPBIO, has moved counter-trend higher, activity going short (via LABD) has gone off the scale.
Spring-To-Up-Thrust
If the unprecedented volume activity weren’t enough to draw attention, we also have a repeating set-up that’s well, repeating; Spring-to-Up-Thrust.
With the idea originally obtained from the late Daivd Weis, later confirmed time and again, it’s a unique (high probability) characteristic of market behavior.
That’s where we are now.
SPBIO: Up Close & Technical
It may be hard to see in the above chart.
The next one, moves closer-in.
The upward advance of SPBIO slowed dramatically last week, closing up just +1.68%, for the week.
Contrast that move with the week prior at +13.83%, and the slowdown is evident.
All Hands, On Deck
Figuratively speaking, everything’s been dropped to focus exclusively on this sector. It’s obvious, what’s going on at this juncture is unprecedented.
That goes for the rest of the markets as well.
However, this sector alone, is telling us to ‘look here’; potentially setting up for a major reversal.
Note: Posts on this site are for education purposes only. They provide one firm’s insight on the markets. Not investment advice. See additional disclaimer here.
Evidently, according to this out on ZeroHedge, stocks will be a good buy when the Fed pivots; apparently getting back to 2%, inflation.
So many lies, half-truths and pre-suppositions, all in one sentence. Let us count the ways.
Actually, let’s not.
At this point in time, one does not want to draw any undue attention.
A better idea is to see what the market’s saying about itself. This is the crux of Wycoff analysis.
Wyckoff stated a century ago (1902, to be exact), stock prices moved based on an energy of their own; at times, completely disconnected from fundamentals.
Looking at those markets and from my own tracking spreadsheet, 106, indices or equities are currently monitored.
That list will change over time but it’s typically around 100 or more ticker-symbols.
Of that number, the following are those currently in a downward sloping trading channel.
Note: Posts on this site are for education purposes only. They provide one firm’s insight on the markets. Not investment advice. See additional disclaimer here.
In what may be just the beginning of similar actions, is this the pivot point?
Part of a lawsuit’s process is ‘discovery’. That’s probably the last thing any ‘institution’ wants.
ZeroHedge picked up the news, linked here; the comment section is telling.
Potential for a significant reversal in SPBIO, has been on the radar for about three-weeks.
What’s price action saying at this juncture?
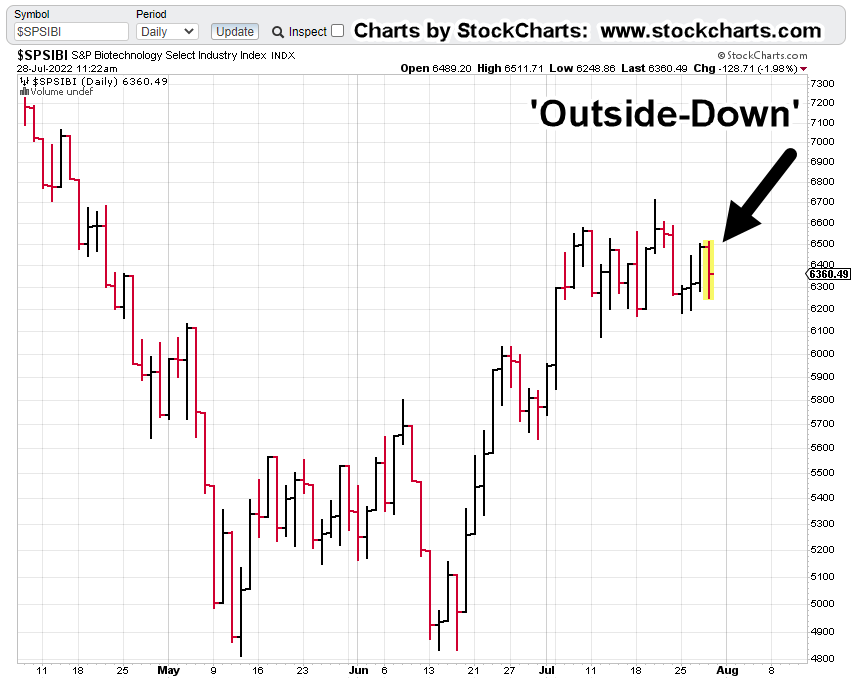
SPBIO, Daily
For starters, within the first hour of today’s session, we’ve already had an ‘outside-down’ print; last session’s highs and lows have been exceeded by today’s action.
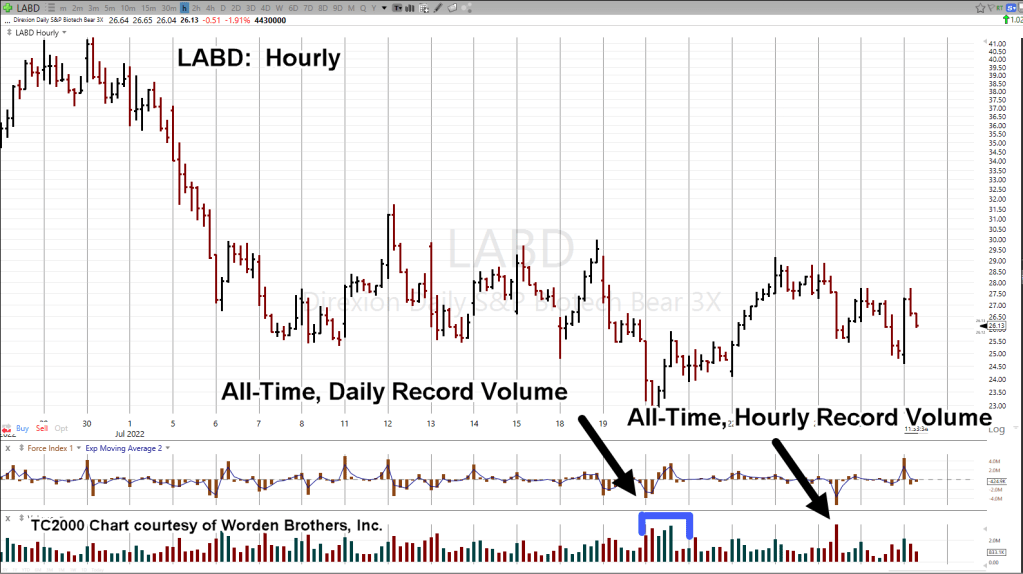
Shifting gears for the next chart, we’re looking at 3X Leveraged Inverse Fund LABD.
LABD, Hourly
The Wyckoff spring set-up is clear. The testing discussed in this update, is per-the-book for Wyckoff action.
‘Tests’ can always fail.
That’s why it’s called ‘The Danger Point’. It’s the location where the risk of being wrong is least (not advice, not a recommendation).
The next chart, also LABD, highlights the record volume on two time-frames, daily and hourly.
This is a potential ‘changing of hands’ from weak to strong for the short-side on SPBIO.
It should be noted, last week’s volume for LABD, was also a record, making it three time-frames.
Summary
As this post was being created, LABD continues to rachet lower into what is now a deep test.
Currently trading at LABD 25.98 (mid-session), we’ll see if the test holds and LABD finishes higher for the day.
Meanwhile, the fundamental backdrop and pressure continues to build.
Note: Posts on this site are for education purposes only. They provide one firm’s insight on the markets. Not investment advice. See additional disclaimer here.
As if on cue to support the prior post highlighting silver’s ‘mysterious’ decline, we have this just out, on Newmont Mining.
Newmont’s in free-fall.
For long-time visitors to this site, today’s events should be no surprise.
These reports, here and here, posted back in April, identified reversals in gold miners GDXJ, and implicitly GDX, to the day.
We’ll include a quote from the first linked report below:
“It’s a fairly safe assessment, nobody expects a downside reversal … nobody”.
And yet, here we are.
As the administration and the financial press, becomes ever more confused and bipolar; even now, re-defining the long-held definition of ‘recession’, we have Wyckoff analysis time and again, cutting through the media trash to determine the highest probability for the market.
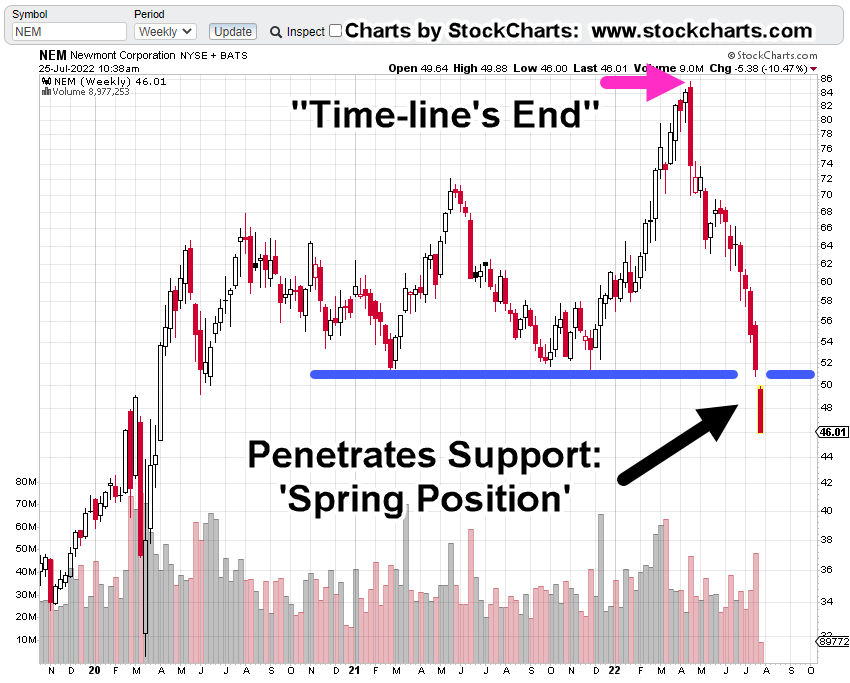
Newmont Mining (NEM) Weekly
The chart below has current conditions for Newmont.
Also shown is the location of the first post linked above, released before Newmont began its decline.
At this juncture, NEM has penetrated long established support; technically it’s in ‘spring position’.
The expectation is for some kind of (weak) rally attempt. We’ll see if it’s able to get back above support.
Note: Posts on this site are for education purposes only. They provide one firm’s insight on the markets. Not investment advice. See additional disclaimer here.
In the weeks and months that followed, dollar updates proposed that because we’re looking at the longer weekly timeframe, ‘any rally is likely to go farther and last longer than anyone expects.’
So now, here we are.
ZeroHedge just acknowledged the obvious, with this report.
At the time of the original dollar analysis, it was (still is) popular to talk about the ‘imminent dollar collapse’.
That (dollar) post was released in the face of overwhelming opposition to any upside.
All of which, brings us to gold and silver.
Gold’s ‘Changing of Hands’
With the passing days and weeks, it looks like the insight of gold (GLD) changing hands (here and here) is proving correct.
It’s not a popular view and it’s sure not getting any ‘clicks’.
However, as we’ll see below, there’s potential for gold and silver to head to much lower levels if not just temporarily.
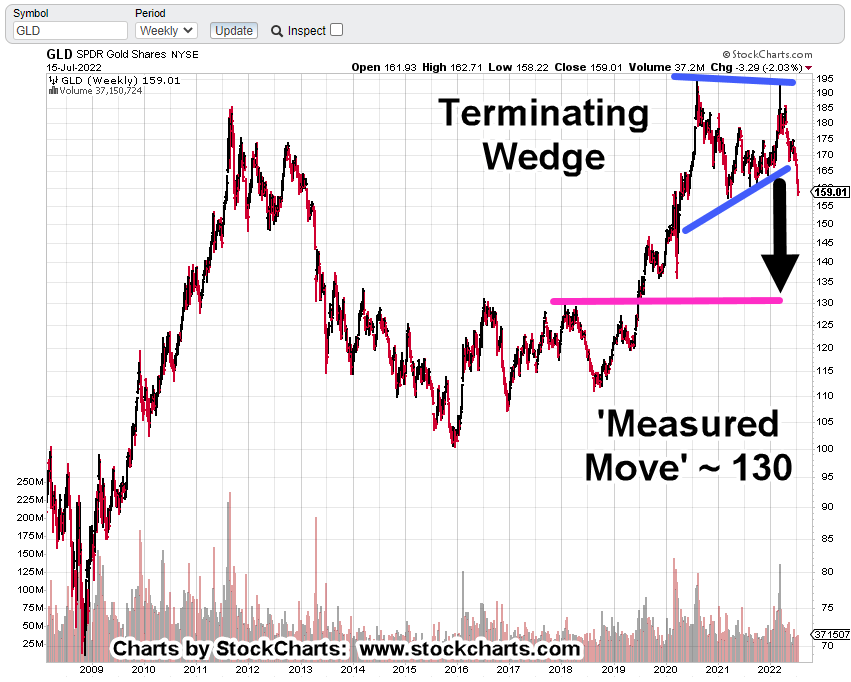
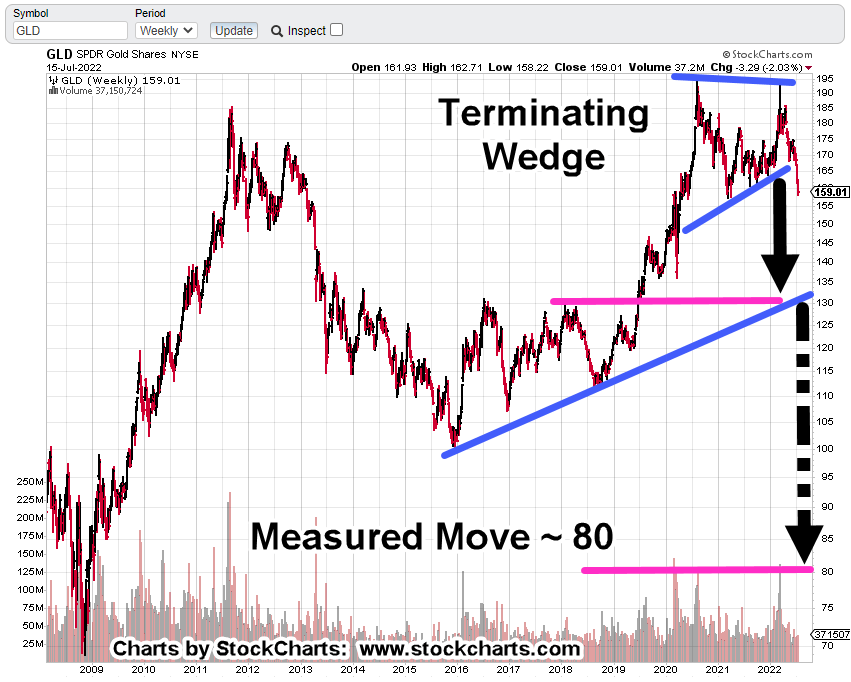
Gold (GLD), Weekly Bar
The wedge breakdown with measured move.
It’s clear, the 130 area, is an obvious support level.
The sticky part, previously discussed here, what if somehow, gold heads lower after the measured move?
We may have something that looks like this:
If that happens, think of the confusion that would result.
From an ‘oligarch’ standpoint, it makes perfect sense.
We’ll not elaborate on that in an open (unsecured) forum.
However, let’s just say, we should keep in mind, it’s the corn and grain first, then gold and silver (not advice, not a recommendation).
Silver (SLV) projections are similar; potential targets at SLV 13 -14, then, if lower to single digits, around SLV 9.0 – 9.5
Summary
First it was, ‘The dollar’s going to collapse’, it’s ‘Imminent‘ (years ago).
Then, when that did not work out, it was the ‘Silver short-squeeze’ and we’re going to ‘Put it to the man!
Then, when that did not work out, it was ‘Gold’s going to $3,000/oz. in months, not years!’
Then, when that did not work out, it’s now ‘The Fed’s going to seize all your money.’
Ah ha! … We may have some truth but not in the way that’s obvious.
If the typical middle-class individual is maxed-out with debt, having overpaid for depreciating ‘assets’ such as cars and housing, there really isn’t much left in the banking accounts, right?
Retirement accounts … now, that’s different.
Covered many times (scroll to No. 3) on this site is just how easy it is (will be) to confiscate the IRA.
Note: Posts on this site are for education purposes only. They provide one firm’s insight on the markets. Not investment advice. See additional disclaimer here.
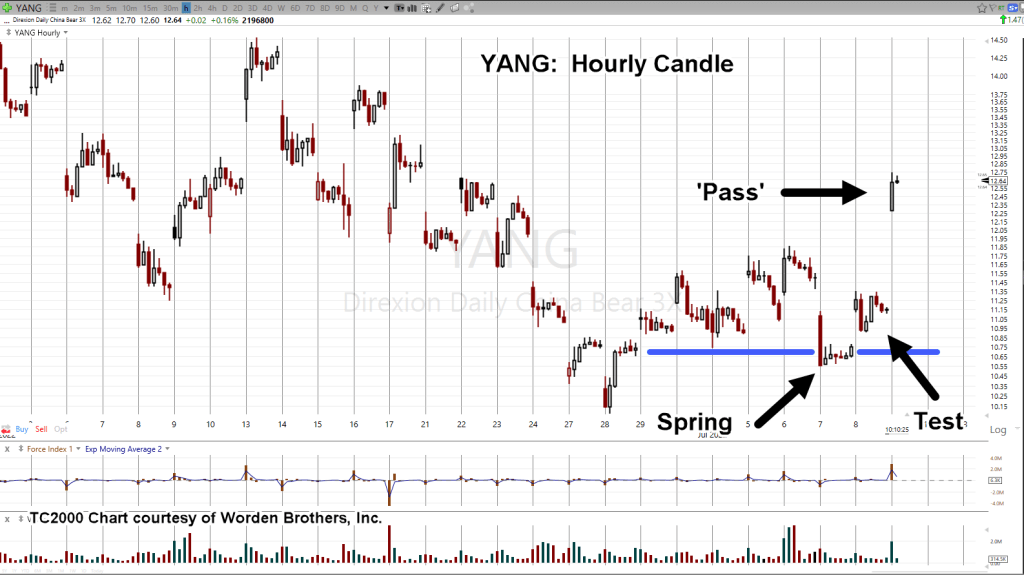
The last report on China, FXI, stated we’re in a Wyckoff set-up that was about to be tested.
More specifically, it said the leveraged inverse fund YANG, was in ‘spring’ position; ‘spring’ is opposite of up-thrust, because we’re looking at shorting the FXI, via inverse fund YANG.
Back then, two charts were provided with the most probable outcome of the set-up. One showed a ‘pass’ of the test and one showed ‘fail’.
Well, it’s obvious now; pass it is.
The original hourly chart is repeated below with the current chart (ninety minutes into the session) following.
Leveraged FXI Inverse YANG, Hourly
Prior to the ‘test’.
And now … ninety minutes into the session:
Back in the day, over a century ago, Wyckoff wrote that ‘somebody always knows something’ and that ‘something’ shows up on the tape.
What we in the Proletariat didn’t know last week, was this week, would bring us this report from ZeroHedge.
The important part is that Wyckoff analysis allowed one to see what was happening (on the tape) and position ahead of time (not advice, not a recommendation).
“Risk on a position short FXI via YANG (not advice, not a recommendation) can be reduced by allowing YANG price action to retrace as much of the opening gap as possible.”
That’s exactly what was done with an entry made near the lows of the day.
For the haters (if any), here’s a reproduction of the entry exactly as it appears in the trade account:
Check for yourself if you like, that YANG was at 10.95, right around 10:51, a.m. EST.
The low of the day occurred several minutes later at YANG 10.90. The stop is set just below that low @ 10.89 (not advice, not a recommendation).
The trade’s identified as TDA-YANG-22-01. The ‘TDA’ references that a separate account (TDA Ameritrade) is being used for this position.
Hopefully, that’s enough ‘transparency’ and we can move on.
The Wyckoff Edge
Properly done (without being skewed by personal bias), there’s nothing else needed other than Wyckoff analysis.
It’s important of course, to understand the context of our (global) environment such as ‘everything’s going according to plan’ but allowing the mainstream to influence the analysis, other than providing a contrarian view, is an absolute waste of time.
Note: Posts on this site are for education purposes only. They provide one firm’s insight on the markets. Not investment advice. See additional disclaimer here.
From a strategy standpoint, we’re now ready for the next round of financial destruction.
If we use this article from ZeroHedge, as the pivot point, consumer credit has maxed out.
The consumer (i.e., middle class) is now on the downward slope, just as the layoffs are about to begin in earnest.
Following the typical corporate model, expect job losses (time stamp 15:18) to start slow, then accelerate into December of this year.
The latest employment numbers provide the perfect backdrop to raise interest rates into a declining economy; all going as planned.
Market Response
As is typical, everyone’s focused on the major indices; The S&P 500, Dow, NASDAQ, SOXX, and on.
However, there’s one sector covered in the past, that’s mostly ignored: Basic Materials, with ticker DJUSBM.
That sector has held up until recently; probably because the thinking was, we’re going to have infrastructure projects to keep the economy going.
Looks like someone got the memo; Basic Materials has broken down.
As of this past Friday, it’s at a critical point.
The prior post from last November, does an excellent job of highlighting the divergences (which have only become worse) as well as downside potential.
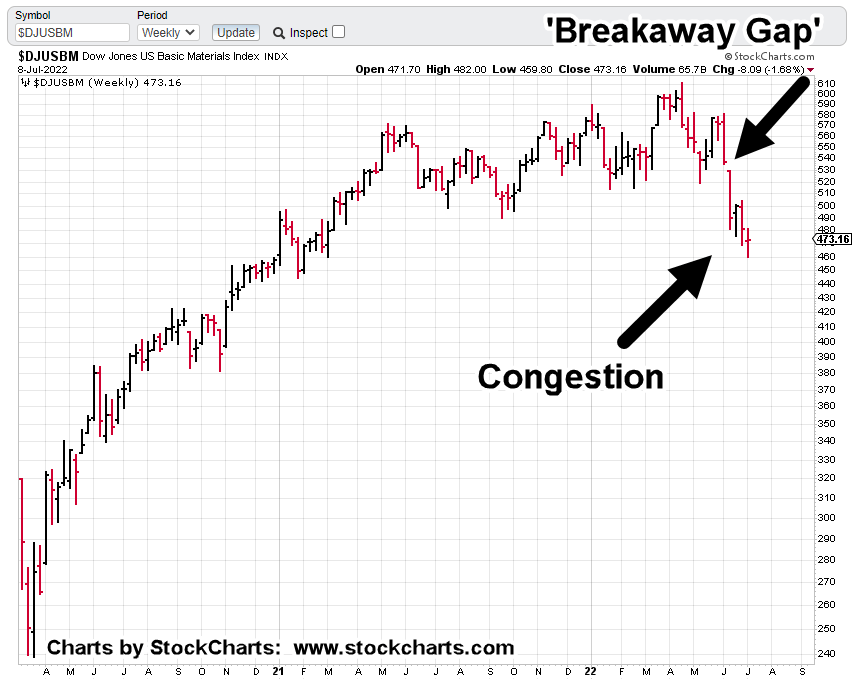
Basic Materials DJUSBM, Weekly
On the chart, we’ve got a breakaway gap that looks like it won’t be filled.
After that break, price action has formed a congestion area over the past three weeks.
However, it’s the congestion area giving us clues; the sector’s set up for an imminent break to the downside.
If that congestion holds true, it’s a stunning revelation of what may be about to happen.
We’ll go to the daily chart and start with a Fibonacci time correlation between pivot points.
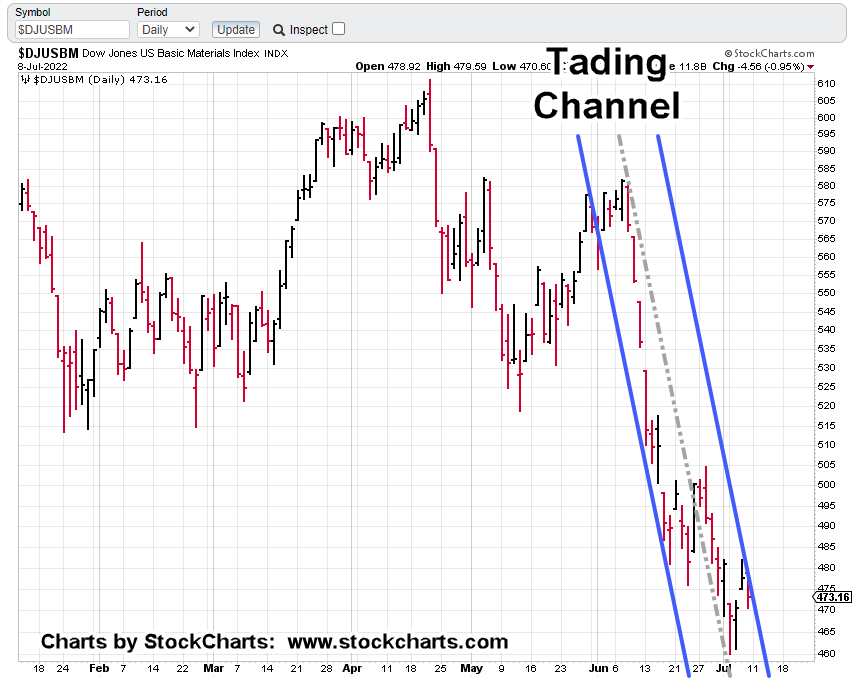
Basic Materials DJUSBM, Daily
Well, it might not look like much.
However, let’s go one step further with another time correlation, shown below.
If you’re reading ahead, then you already know a trading channel has been defined.
The next chart shows the result.
For this channel to confirm Fibonacci ‘Day 21’, Friday’s action had to post lower … and it did.
That lower action also confirms, the channel’s a Fibonacci 13-Days wide.
Even more disconcerting (depending on one’s viewpoint), the channel lines are declining at approximately – 96.5%, on an annualized basis.
It’s not straight down but it’s close.
The next chart has a zoom of the congestion area.
Note how the grey dashed ‘center line’ is perfect in its contact points … further confirmation of the channel.
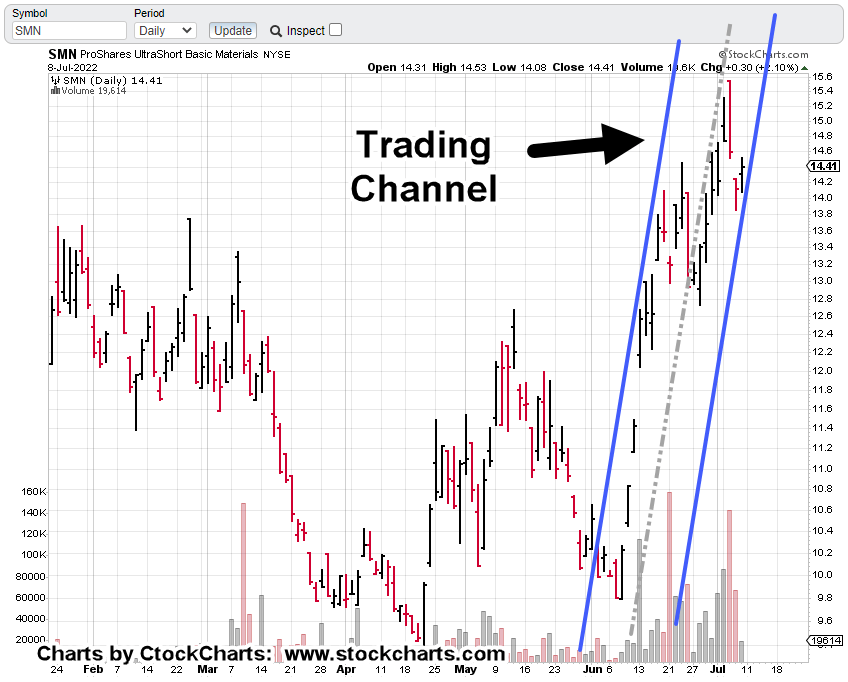
Leveraged 2X Inverse SMN, Daily
Although volume is still light, it has improved dramatically.
On a weekly basis, last week was the second largest trading volume at least going back to the ’07 – ’08, meltdown.
The inverse fund is shown below with the trading channel.
Liquidity is still marginal but has picked up over the last three weeks.
The Week Ahead
Obviously, the expectation for the next open is to post lower for basic materials.
Even with all the analysis, it’s the market itself that’s the final arbiter.
Positioning
As the hyperlink tabs in this post (top-left) show, I’ve positioned one account short the sector via SMN (SMN-22-01), with a stop just below Friday’s SMN, low at around SMN 14.05 (not advice, not a recommendation).
It’s a very tight stop.
The analysis is either in-effect, or it’s not. By this Monday, we’ll find out.
A Decline of Biblical Proportion.
On a strategic basis, we can see how expertly the middle class has been maneuvered into a corner.
For the past two years and probably much longer, that sector has been positioned to not have any recourse when the real decline hits.
We may be there now.
At the same time, if you’re up on Biblical references, you already know that when destruction came, there was always a ‘remnant‘.
The remnant was left to either escape or re-build and was typically 10% of the population.
If you’re reading this, you have already decided at some level, to be part of that remnant.
Note: Posts on this site are for education purposes only. They provide one firm’s insight on the markets. Not investment advice. See additional disclaimer here.
The Danger Point®, trade mark: No. 6,505,279
Active: Short DJUSBM via SMN, as SMN-22-01, stop @ SMN 14.05
Anyone who thinks the Fed’s going to ‘pivot’ because the numbers are weak, does not understand (or won’t admit to) the real purpose of the entity; but I digress.
The Strategy
Way back in December of 2020, this post was released which discussed ‘Genesis 41’, specifically.
It was an intuitive assessment; we’re in a phase where corn and grain (i.e., the food supply) are potentially more important than ‘stacking‘ silver or gold.
Over the ensuing year and a half, how correct, that has proven to be.
Then, nine-months ago, was this post, presenting the ‘elephant’; a massive population decline whose repercussions would last the lifetimes of anyone reading.
Now, we have this. A report that confirms the elephant.
It’s all starting to hit the mainstream, although the language is still being couched to not cause undue panic. Good luck with that.
So, what’s next?
The Danger Point: Real Estate
While mainstream press and money managers alike struggle to figure out the obvious, we have price action itself telling us the next likely direction of the market.
During an economic downturn there are many places not to be such as semiconductors, airlines and other low margin businesses, restaurants and so on.
However, the most illiquid of all, is real estate. It does not matter how bad one wants to sell, if there is no buyer, there is no sale.
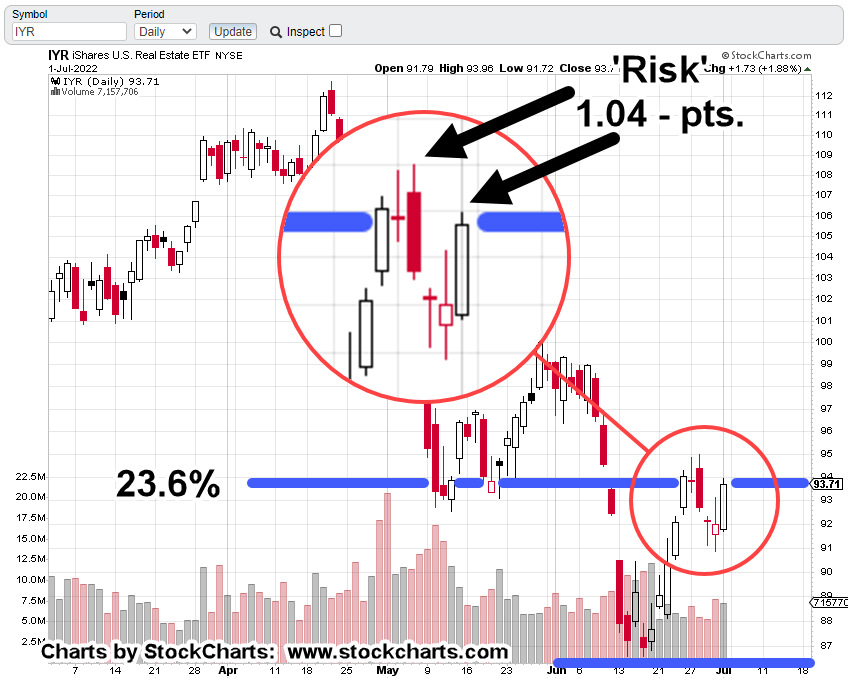
Real Estate IYR, Weekly Chart
Last week, real estate IYR, closed right at the Fibonacci 23.6% retrace as shown.
Getting closer in on the daily, it’s marked up to show the risk from a shorting perspective (not advice, not a recommendation).
Real Estate IYR, Daily Chart
In this case, the risk on a short position is defined as the distance from last Friday’s high (IYR: 93.96) to that same week’s high of IYR: 95.0
Let’s add, Friday’s action saw IYR, retrace a Fibonacci 76.4% (the most available) of the entire move for the week.
The Summary
Amazon (AMZN), ProLogis (PLD), and Real Estate IYR, are joined at the hip.
Now the economy’s imploding, massive warehouse space is not needed.
Ditto that for employees as well.
ProLogis is already down – 31.2%, from its all-time highs set just this past April.
We’ve already shown PLD, has a nasty habit of going straight down during a market route.
Last time, PLD, crashed over – 84%, in just two months.
Note: Posts on this site are for education purposes only. They provide one firm’s insight on the markets. Not investment advice. See additional disclaimer here.
Even before we had gone around the room to introduce ourselves, the instructor at Online Trading Academy, Dallas, said he had a important topic to cover.
He wanted to make sure everyone understood the concept. The rest of the seven-day course hinged on the understanding and acceptance of the idea.
What was it?
You may have already guessed: ‘Short Selling’.
The big money is made on the downside … not after, when the bottom is in, although that may happen as well. No, it’s the downside that has the greatest opportunity for profit.
Fear is a much easier emotion to gauge than greed; in that sense, down is easier than up.
Short Selling: Market Trading 101
You would think it’s a no-brainer; that everyone knows this.
Not so.
Years ago, while discussing the markets with a former broker, he asked me, and I quote: “What’s an inverse fund?”
During a business lunch, I asked another broker if he worked the downside for his clients. The response was “They can’t handle the volatility”.
In his case, he knows the vehicles are there (inverse funds) but he doesn’t use them; only working the upside.
Shorting The Market
My first short sale was back around 1995.
I shorted ‘against the box‘, when you could still do so. The short trade was Alcide.
In the May 1993, edition of my newsletter (see About) ‘Market Order Letter’, published by my firm, Equity Research Corporation, Alcide received initial coverage.
Prior to that edition, I managed to get a phone interview with Mr. John Richards, Vice President, and Chief Financial Officer of the company.
Remember that I was simultaneously employed as Engineering Technical Manager, for an avionics company. So, the interview was performed on my lunch hour.
During the call, I had made it past the receptionist, then secretary, and then to Mr. Richards, specifically.
Initially, the interview was not going well.
I could tell he considered me an annoyance and rightly so. That was, until I mentioned the competition and how they were going to deal with that.
At the time, Isomedix, had a plan to irradiate chicken (carcasses) to prevent salmonella. Conversely, Alcide had a product that was sprayed on (i.e. low-tech) and biodegradable.
When I mentioned Isomedix, the tone of the conversation changed instantly. I had done my work; I knew the market and wasn’t some newbie (even in ’93).
Mr. Richards opened up and gave me a fantastic interview discussing all manner of things. I did not tell him I was on my lunch hour and in the end, had to politely say, ‘You must be busy, so I’ll let you go’; thank you for your input.
Alcide (ALCD) was a ten-bagger that ultimately went from about $3/share to above $60/share (actually, a twenty-bagger) before being acquired by Ecolab.
Which brings us back to the ‘Retail Investor’
Still Buying The Dip
One more thing about the trading class mentioned above.
After the short-selling topic was covered, the instructor went on to say, the fact we were sitting in that room, separated us out from the massive herd of ‘investors’.
At that time, there were about 40,000 – 60,000 professional traders in the U.S. Although still neophytes, we were considered in that group.
That’s 60,000 out of 240-million adults, putting the ratio at around 0.03%
Now, on to ‘the dip’.
This article out from ZeroHedge has the data saying, ‘Retail’, is still buying the dips although the average portfolio is down a whopping -34%, for the year.
Without getting into specifics, the most conservative account managed by my firm is up over 30%, for the year, which includes the LABD, whack from this past Friday.
Note: An updated analysis of Biotech SPBIO, inverse LABD, and LABD-22-03, is scheduled for tomorrow.
Fuel, For The Downside
Over a century ago, Wyckoff wrote about the behavior of those on the wrong side of the trade.
That is, they are the ones who provide the fuel for the next move. In our case, that would be fuel for the downside.
Investors are buying the dip, because that’s all they know how to do.
Note: Posts on this site are for education purposes only. They provide one firm’s insight on the markets. Not investment advice. See additional disclaimer here.
People are offended by him snapping his fingers at the beginning of each video.
You can’t make this stuff up.
But wait, there’s more.
Those same snowflakes go on to say they’re offended that ‘Ninja’ is planning to take advantage of the real estate crash; being liquid at the bottom so he can buy-in, at pennies on the dollar.
I wonder how many of these coneheads are ‘financial advisors’, but I digress.
No. 2
‘Sudden Adult Death’
Yes, ladies and gentlemen, after thousands, if not tens of thousands of years of humanity, we have a brand-new disease.
Note: Posts on this site are for education purposes only. They provide one firm’s insight on the markets. Not investment advice. See additional disclaimer here.