Russell 2000, attempts to break through resistance; reverses and then tests (Monday), just as ZeroHedge says the short squeeze is over.
There’s a lot of trying-to-make-everything-look-complicated, wording in the link above but the take-away is, the market may be finished with the recent short squeeze.
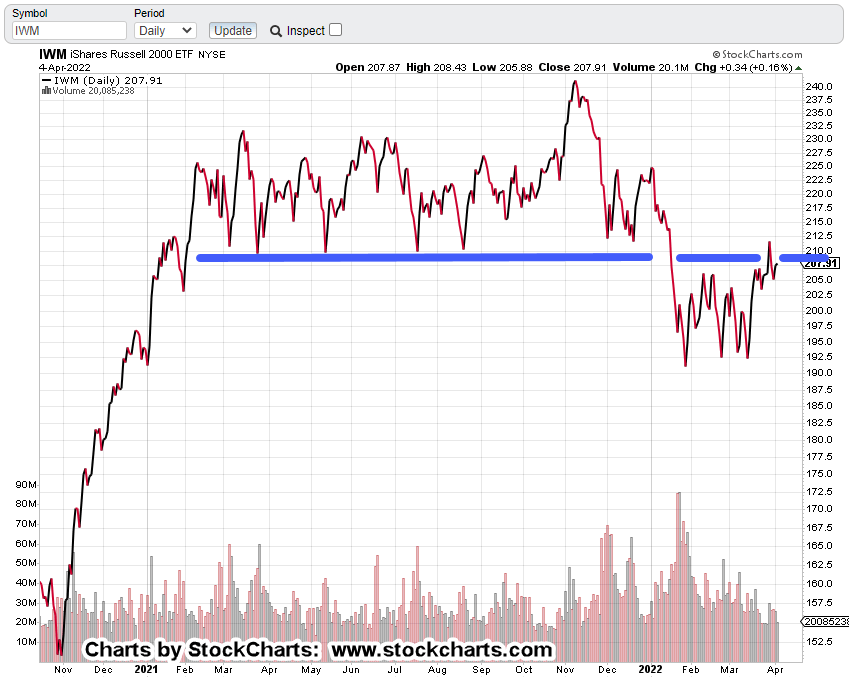
At this juncture, Russell 2000 (IWM) looks like it’s hit long-time resistance around the 211, area and reversed.
The past two trading days may have tested that reversal.
IWM, Daily Close
The support (blue line), now turned resistance has been in-effect for over a year.
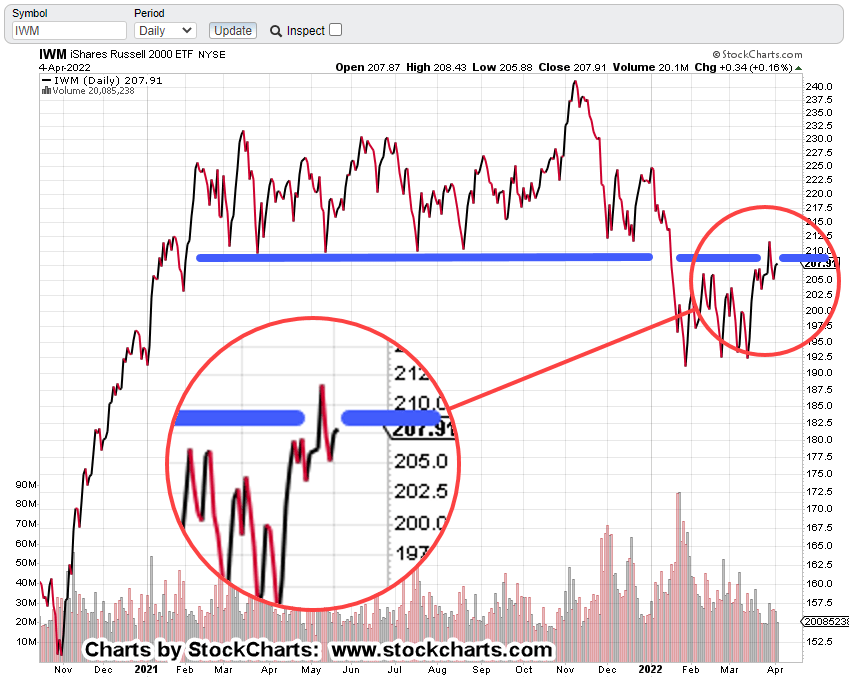
The zoomed version below shows it’s clear, at this juncture, price action’s not penetrating resistance.
As with bonds in this report, we’re at the danger point.
This is where risk is least for either short or long (not advice, not a recommendation).
Naturally, with the ZeroHedge report (above) saying that shorts have been effectively covered, price action direction favors the downside.
Note: Posts on this site are for education purposes only. They provide one firm’s insight on the markets. Not investment advice. See additional disclaimer here.
Note: Posts on this site are for education purposes only. They provide one firm’s insight on the markets. Not investment advice. See additional disclaimer here.
The analysis used in the video is different from what’s on this site … and that’s ok.
The probability conclusion is the same, i.e., EEM down.
The takeaway from the video, is the timeframe. If the cycles in the analysis are in-effect (time stamp 8:04), then EEM potentially bottoms-out, in late June or early July.
Summary
The initial short trade via EDZ (EDZ-22-01) was exited, with profit on March 16th.
Another attempt made, on the 17th – 18th (EDZ-22-02) but exited on the 18th, with a moderate loss (-6.5%).
From the 22nd – 24th, another position was opened.
EDZ-22-03, currently in the green at +1.9%.
Stop is set at EDZ: 10.55 (not advice, not a recommendation).
Parting Shot
A quick check of ZeroHedge, has the usual suspects out fomenting falsehoods; attempting induce more fear and misdirection of the masses.
Note: Posts on this site are for education purposes only. They provide one firm’s insight on the markets. Not investment advice. See additional disclaimer here.
“The truth is incontrovertible. Malice may attack it, ignorance may deride it, but in the end, there it is.”
Winston Churchill
No matter what one may think about Churchill, the truth at this juncture for gold (GLD), is an island gap reversal:
‘There it is’
Longer term momentum indicators, MACD, are pointing higher on both the monthly and weekly.
So, there’s definitely some upward bias.
The ‘Next’ Catalyst
We’ve already had military attack, bombing of a nuclear power plant (so they say) including the actual threat of nuclear detonation … so what’s next?
The (fake) alien invasion?
What if aliens really do invade? My first thought of course will be, “I’m glad I have my stack of gold and silver to get me through. I feel much better.”
No, let’s get real.
We’re all going to wish we had a ‘Ma Deuce’, like this one.
If you’ve got one of those, you can have all the gold and silver you want … plus a few aliens to boot. 🙂
Hyperinflation, Here, Now?
Well, there’s at least one way to tell and that’s by the price action itself.
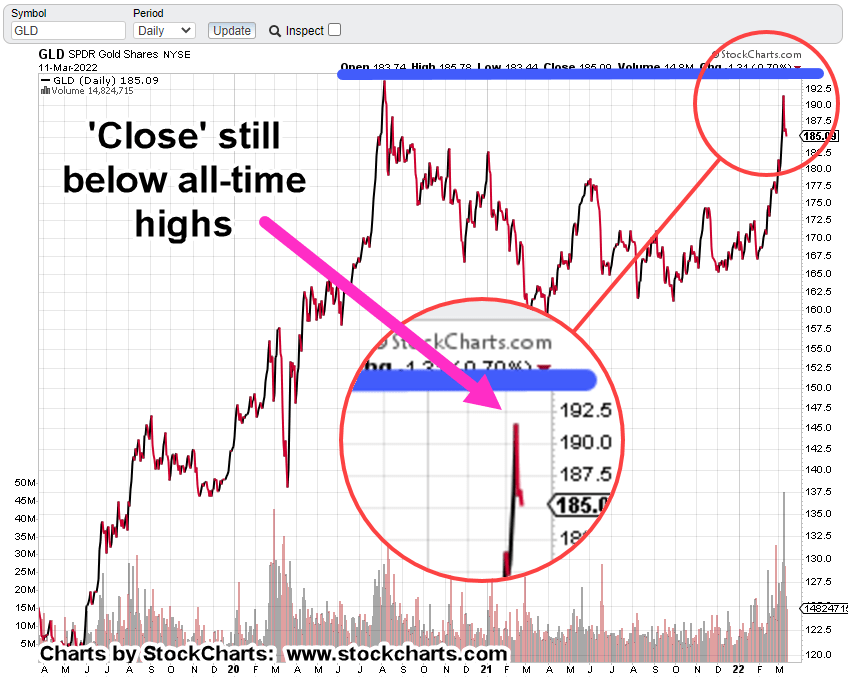
The daily chart of gold tracking fund GLD below, clearly shows the island gap.
Even with all the upward bias on longer-term momentum (MACD) indicators, if GLD can’t fill that gap, there’s something else at work.
On a closing basis, GLD is still below all-time highs, set back on August 6th, 2020.
With the climactic volume and price spike discussed previously, short term expectations are for some type of (continued) downward retrace.
Then, There’s This
It’s still about four hours to go before the Sunday futures open and anything can happen.
Note: Posts on this site are for education purposes only. They provide one firm’s insight on the markets. Not investment advice. See additional disclaimer here.
This post, highlighted the reasoning for a sustainable breakdown in the Emerging Markets, EEM.
The leveraged inverse vehicle for that index is EDZ.
Up until about two weeks ago, that fund was a low volume wall-flower.
That’s all changed … at least, for now.
The ten-day trading period from February 1st to 14th, had average EDZ, volume of 251,000 shares/daily.
Fast-forward, ten days from February 24th, to today, March 9th; average volume is up over 280%, at 955,000 shares/daily.
EEM Weekly Chart
The weekly chart’s orderly lower-trending price action broke to the downside during the week of February 25th.
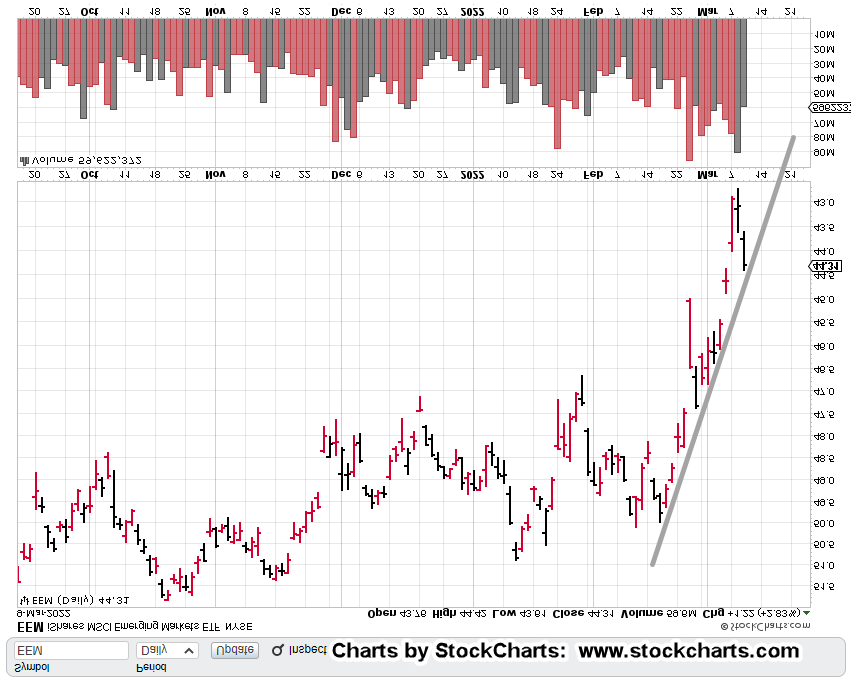
Inverting the chart and noting the apparent trend-line shows this week’s action is closing the breakout gap and testing the trendline.
Closer-in on the (inverted) daily shows just how many hits there are on this trend; looks like about eight so far which includes today, March 9th.
Positioning
This earlier post showed how I worked the sector via inverse EDZ (not advice, not a recommendation).
Depending on tomorrow’s price action, today may have been another low-risk opportunity for entry.
If EDZ makes a new daily high at the next session, the stop, identified previously (EDZ: 10.90) will be moved up to 11.96 (not advice, not a recommendation).
Opinion
This article says, ‘limit down‘ is coming; the opening market drop will be so large, it’ll be ‘limit down’, not allowing sells (for a set time period).
If that happens, the next day is likely to be the same and the next after that.
This is how fortunes are made and destroyed.
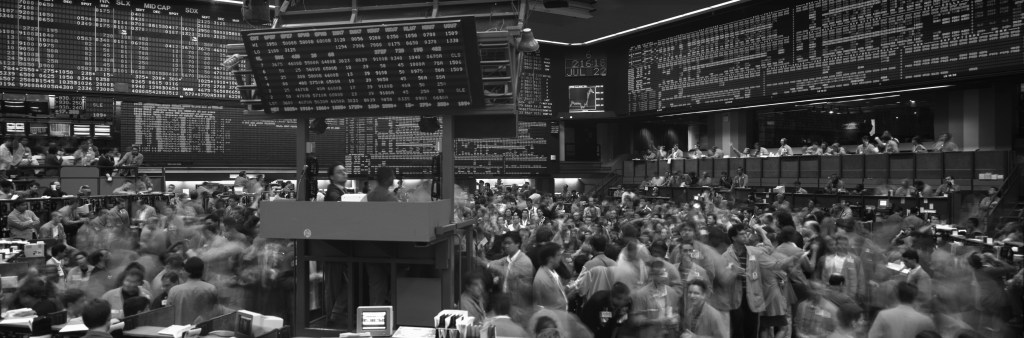
A good documentary on that process can be found here (Floored, time stamp 29:04); back then, it was a limit up.
Note: Posts on this site are for education purposes only. They provide one firm’s insight on the markets. Not investment advice. See additional disclaimer here.
There’s no telling if somehow, Taiwan (the nation) is going to be dragged into the fray.
Note: As this post was being finalized, we have this, just out.
The good news (sort of) is from a Wyckoff analysis standpoint, we don’t have to know the inside scoop on who or what has plans to do next.
To be very blunt, those in the know are so arrogant and greedy, their actions are going to show up on the tape.
That same arrogance and greed was rampant in Wyckoff’s day … why should it be any different now?
Taiwan Semi (TSM) Weekly Chart
As we can see, TSM closed the week just below support on very heavy volume.
Downward thrust pressure is immense.
The coming week could see an attempt to ‘relief rally’ or we could just continue lower in earnest.
If TSM breaks lower, it’s in ‘free-fall’ territory as there’s no real support until the 80-area … down nearly – 24%, from current levels.
Leveraged Inverse Fund: EDZ
As covered earlier, the leveraged inverse fund EDZ, has picked up in volatility as well as trading volume.
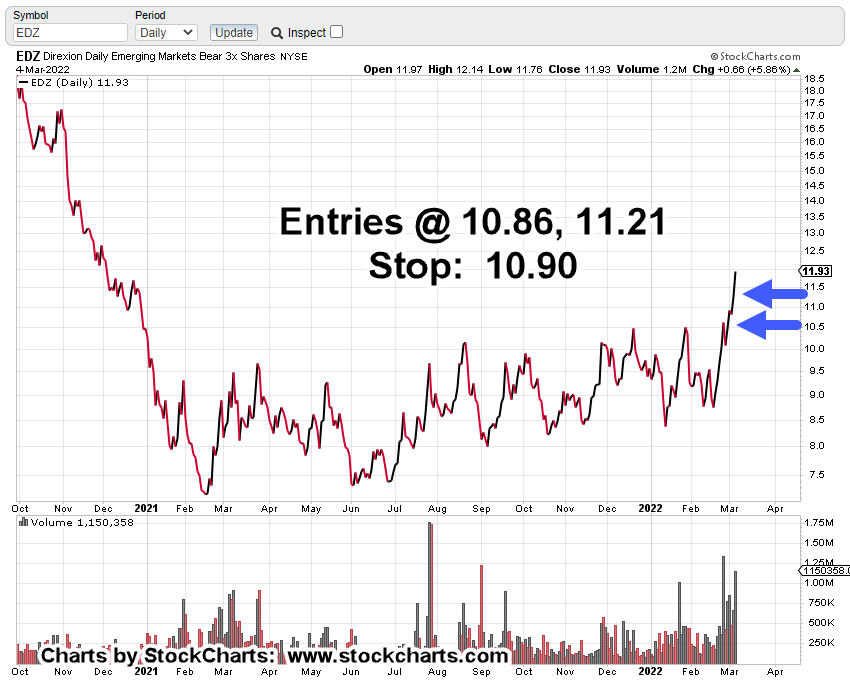
The daily (close) chart showing the breakout is below:
The second chart documents trade entries and current stop location (not advice, not a recommendation).
The entries may look to be at ‘elevated’ levels but recall in the last report, the market tested its breakdown … tilting probability to the downside (upside for EDZ).
Entries were made at support/resistance trendline break and test … ‘the danger point’
The EDZ, fund typically, is not popular and is normally very quiet; however, that all changed in the past two weeks.
The EDZ, Entry
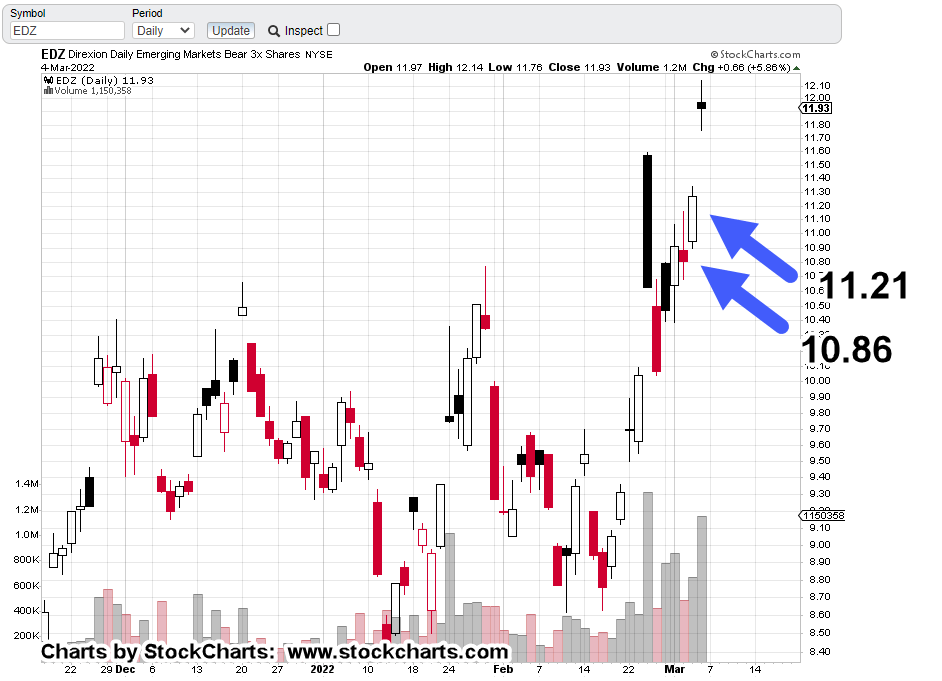
Let’s dig into the nuances of the entry on the two charts below. From the closing chart above, the entry looks like it’s hanging in mid-air.
Looking the ‘prints’, shows the entries made at (nearly) the lowest risk point(s) possible.
The day prior to the 10.86, may have been the best but recall from this update, the entry was made as price action tested the breakdown of support/trend on the EEM.
The trade plan for the next day (March 3rd) was if EDZ made a new daily high, the breakout is likely underway.
Another entry was opened (mid-session) as price action pulled back from that new daily high (new low for EEM).
Note the stop was originally set at the March 2nd, low of 10.69, then moved up to 10.90, the next day.
If stopped out at this juncture, the entire trade would be at break-even (not advice, not a recommendation).
Note in the charts above, there were several false attempts to break to the upside. Each attempt was followed one or more red bars (candle) that negated the attempt.
The current breakout looks like the real thing but it too, was initially followed by a red candle (February 25th).
In this instance, price action reversed and started making higher-highs and higher-lows.
That was the signal to go long.
Summary:
At this juncture, trade EDZ-22-01, is fully positioned (not advice, not a recommendation).
Anything can happen between now and the open on Monday. However, the power of TSM’s thrust lower suggests downside continuation is a high probability.
Let’s not forget, we’re in a market environment where a ‘fat-finger‘ upset is not just a possibility but highly likely.
Note: Posts on this site are for education purposes only. They provide one firm’s insight on the markets. Not investment advice. See additional disclaimer here.
Note: Posts on this site are for education purposes only. They provide one firm’s insight on the markets. Not investment advice. See additional disclaimer here.
A massive four-year top, along with the latest ‘road-map‘, has this one going down; most likely, for good.
While other chip makers, have gone to near stratospheric levels such as Nvidia, with its 23,960% gain from 2009, lows, Intel has languished.
The rest of the markets, S&P, Dow, QQQs, have pushed on higher while INTC, has spent the last four years, in a trading range.
A sideways market is a bear market.
Intel never recovered its luster after the Dot-Com mania of the 2000s. Price action spent eight years heading sideways-to-down before bottoming out in early 2009.
After that, it’s been a long struggle to current levels.
Now, the markets have reversed and the economy’s collapsing. We’ve likely seen market highs that won’t be repeated in the lifetimes of anyone reading.
Friday’s announcement may be the kick-off for sustained price action to the downside.
INTC, Chart Analysis
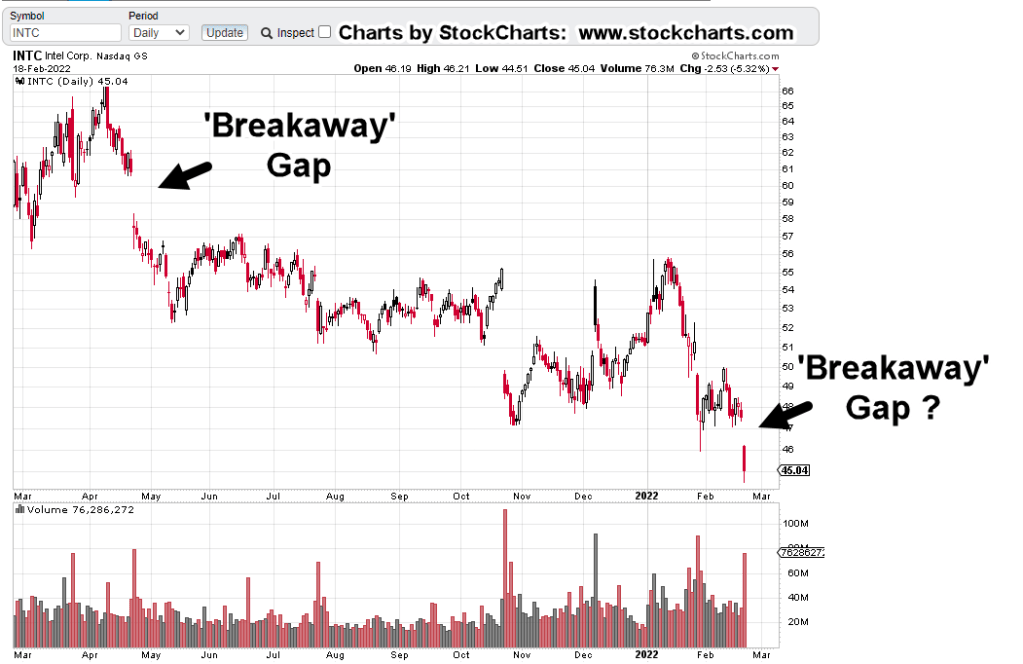
The daily chart shows at least one breakaway gap and possibly two.
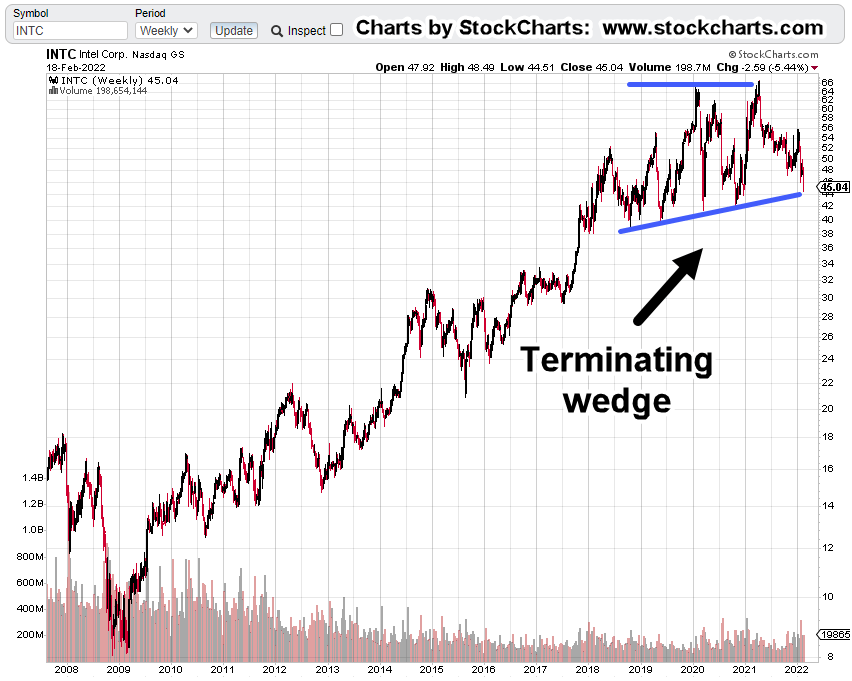
The next chart is on the weekly timeframe and identifies the long, multi-year, topping pattern.
When looking at these patterns, be reminded about the scale of what’s happening.
This wedge is massive … at least four years in the making.
Note: Price action finished the day right at the lower support. There could be a rebound on Tuesday (market’s closed Monday) or we could just keep going lower.
The SOXX Connection
Intel’s fifth in market cap of the SOXX, with Taiwan Semiconductor (TSM) at the top of the list.
Even the leader TSM, may not be immune to trouble.
Here are Fab locations for Taiwan Semi, located just off the coast of mainland China … nothing bad going to happen there, right?
In the case of the ‘wave’ analysis, if it proves correct, we’re possibly in for a sustained ride lower.
The daily chart of SOXX, shows each analysis point where a reversal lower was projected.
It’s clear from the chart and documented links, both methods nailed it … to the day.
Elliott was earliest and caught the exact point of inflection.
Wyckoff caught the test of the up-thrust.
Here’s the important part:
Wyckoff is a practical, bread and butter method. It looks at what the market’s saying about itself … is price action showing pressure to the upside or down?
Elliott Wave looks at where the market could be or is going.
If we’re really in an Elliott Wave Three down, it’s likely to be a decline like no other.
There are other indicators not market related, giving us hints, a massive collapse is ahead.
A Decline of ‘Biblical’ Proportions
Warning:
The following contains scriptural references.
Those who are in ‘it’s all a myth and fairy tales’ crowd, feel free to scroll to the ‘Summary‘.
For the rest of us, the secular world calls it ‘systems collapse’. The spiritual world calls it ‘judgement’.
Stated many times on this site, ‘the church’ is corrupt. Here’s just the latest salvo proving that point.
Along with the corruption, we now have the strong delusions prophesied over 2,000 years ago.
In reference to a Stew Peters broadcast, linked here, on the numerous media lies, is this comment (emphasis added):
“The only people to blame for this Stew are the ones who put on the mask, who distanced, who took the shot, who harassed other people and who advocated for my freedoms being taken away. Without doing five minutes of research.”
It’s not too much of a stretch to say, those who voluntarily injected themselves were (or are) in a place of delusion.
“And for this cause God shall send them strong delusion, that they should believe a lie:”
However, the injections are no lie … but the reasons for those injections are false.
Can this (spiritual assessment) really connect with what’s happening in the markets? How does it relate to actual price action?
Obviously, it can’t and shouldn’t be said that any specific price movement has been prophesied.
However, we can use the scriptural references to point us to the probability of events; the big picture, the situation at hand, the signs of the times.
The probability that we’re at some kind of major inflection point of Biblical proportions, seems exceedingly high.
Summary
Both Elliott Wave and Wyckoff Analysis, support the probability of lower prices ahead for the SOXX.
Because Intel (INTC) has been a laggard in the sector for years, suggests it may be one of the downside leaders.
As if to confirm the assessment we’re past the pivot, that generational highs have been reached, we have this just out, on ZeroHedge.
At the very bottom of the article, is a quote.
No, they’re not quoting from the King James Bible of 1611; they’re quoting from Shakespeare’s Richard III, of 1594.
Note: Posts on this site are for education purposes only. They provide one firm’s insight on the markets. Not investment advice. See additional disclaimer here.
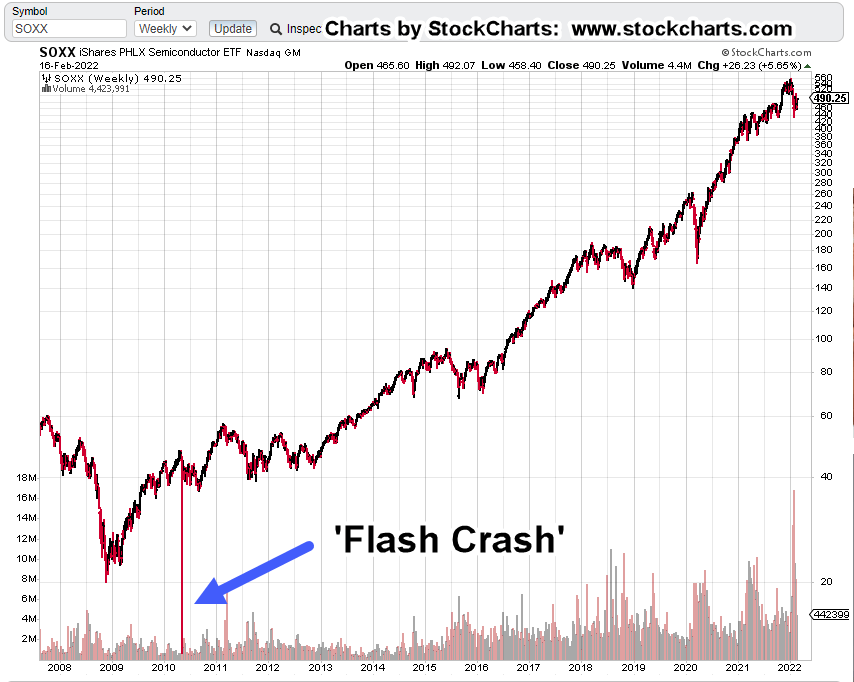
It’s been long enough; most have forgotten the ‘Flash Crash‘ of 2010.
That crash happened in May of that year.
May of this year, would make it 12-years and interestingly, a Fibonacci 144, months.
Normalcy Bias:
As Nissam Taleb said in his book, ‘The Black Swan’, every day is like every other day on the farm, for Mr. Turkey … that is, until Thanksgiving Day.
Let’s take a look at the historical chart of Semiconductor ETF SOXX, and see the effect of a Flash Crash.
Easy to spot … prices did recover by the end of the day.
What about the next time?
This report just out on ZeroHedge, shows liquidity is drying up in the bond market. Actually, liquidity has been drying up ever since Dodd-Frank of 2010.
All of this is working (to increase risk) in the background.
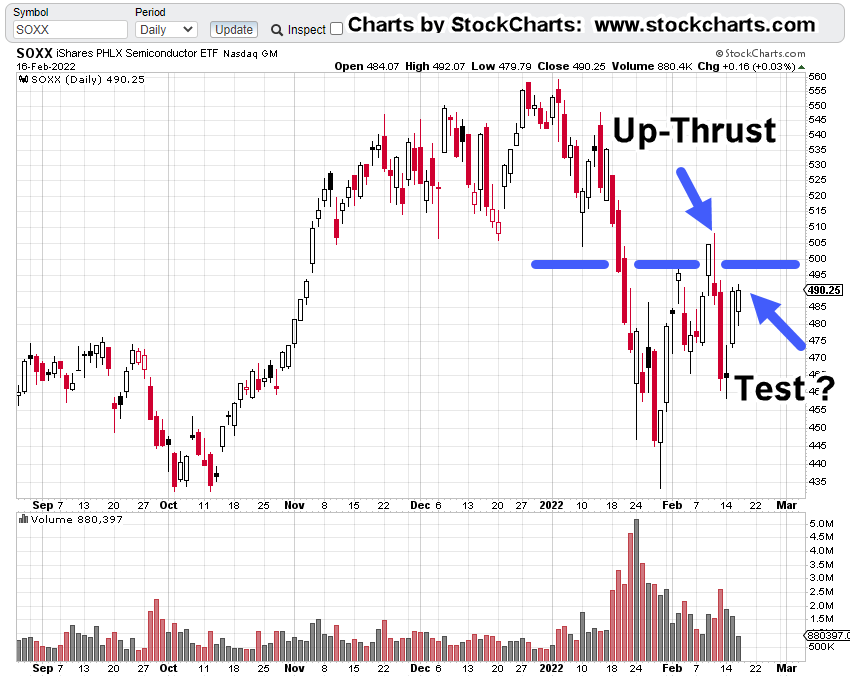
Let’s take a look at another unprecedented event … the downthrust and apparent recovery in the semiconductor index, SOXX.
SOXX, ETF, Daily Chart
First up, is the unmarked chart of the index.
Next, we’ll show the recovery higher is on diminishing volume.
There’s no real commitment to the higher prices …. they are just drifting upward.
We’ve already shown the Elliott Wave assessment of the current structure. Now, let’s look at it from a Wyckoff standpoint; Up-Thrust and Test.
Price action posted an Up-Thrust, declined and now has come back for an apparent test.
Confirmation Bias
At this juncture, both Elliott Wave and Wyckoff Analysis present a price action structure that’s set for downside reversal.
In a way, we’re at the danger point for both methods.
Summary
From a personal and corporate standpoint, going long in this market and all markets for that matter, was abandoned long ago (not advice, not a recommendation).
To borrow a phrase from Dan at i-Allegedly, he repeats over and over in his videos, ‘We’ve had warning, after warning’.
So, we have.
The SOXX, is telling us, it’s ready to resume action to the downside. After-hours, already has the index trading lower.
Note: Posts on this site are for education purposes only. They provide one firm’s insight on the markets. Not investment advice. See additional disclaimer here.
The Danger Point®, trade mark: No. 6,505,279
p.s. The insight of 2010 Flash Crash, anniversary of Fibonacci 144 months in May of this year, is exclusive to this site.
Even though technical conditions show we’re at least in a correction, if not outright reversal or collapse, record inflows for 2022, vs. 2021, present the herd-driven behavior of the public (and funds), to go long.
According to the link above, flows have been out of bonds and lesser performing equities, into equities that have gone down less.
In addition, you can see some of that flow (not addressed in the article) going into gold and the mining sector.
Stepping Back
Pulling away from charts and indicators for a moment, figuratively closing one’s eyes to get a ‘feel’ for what’s happening, it looks like the following:
We’re in a (potential) massive juggernaut reversal that’s been decades in the making; possibly having origins going all the way back to the ’87, crash, the ’95, bull market and then, repeated bubbles of 2000, ’07, and now.
At this point, it looks like the ‘average investor’ is doing the only thing they know how to do … that is, go long.
Those with at least some market knowledge, just got decisively whacked with their ‘put buying‘ strategy as the market has rallied strongly off the lows.
Pavlovian Panic
We’re witnessing the knee-jerk reactions of a public that’s been conditioned for decades, not to ‘think’, but only ‘do’.
Expect this type of behavior to go parabolic if the markets really do turn lower on a sustained, long-term basis.
Prechter has written extensively about crowds or the herd; especially in his text The Wave Principle of Human Social Behavior.
We can see this visceral behavior real-time, in other seemingly unrelated markets. Two examples below:
First, we had oil futures going negative for the first time in history; then we have LNG tanker rates going negative first time as well.
The model seems to be:
“Everybody wants it, and then, they don’t”.
The crowd runs to and fro, effectively leaderless.
With that said, one can make a case we’re just beginning, or already in an economic collapse; now being followed by the early stages of a market collapse.
Meanwhile, The Elephant Gets Bigger
Let’s not forget the massive elephant that’s just now getting so large, it can’t be ignored (time stamp 2:40).
Recall the example at this link … disparate crowds have a tendency to come to the same decision and modify behavior, all-at-once.
You have to wonder, when that crowd is going to simultaneously press the Sell, button.
Hit, In The SOXX
Unprecedented events are everywhere. That includes the massive, ‘never before seen‘, thrust lower in the SOXX.
The uptrend shown in the weekly chart of SOXX, has been decisively broken and with enormous volume.
The week ending Friday January 28th, saw 16.7-million shares traded … the most ever for the index (ETF).
More detail on trend break
Then, There’s Elliott Wave
Before the ‘Elliotticians’ get miffed by the previous (cookie cutter) comments, here’s this:
When this method works … it’s great.
It provides good projection areas and the useful ‘Fourth Wave of Lesser Degree’, targeting.
Note: A quick internet search for this Fourth Wave method (authored by Prechter) turns up nothing.
Logging onto ‘Club EWI‘, putting in ‘Fourth Wave’ has no items found.
One can try contacting Elliott Wave International, to request a copy of this targeting method. It may still be available (for a price).
The data used by this author to target the 4th wave retrace (shown below), is from a hard copy, dated, 1/8/2003. That information was excerpted from The Elliott Wave Theorist, July 9th, 2002.
First, the 2-Hour chart from Thursday’s update is repeated below with the ‘lesser degree’, added in magenta font:
Getting closer-in on the 4th-wave area below:
It’s subtle and difficult to spot. The price action congestion area is the ‘4th wave of lesser degree’.
Summary:
The previous update showed entry points for what is now SOXS-22-01 (not advice, not a recommendation).
Friday’s price action put this position well in the green; getting it to +24%, based on the close.
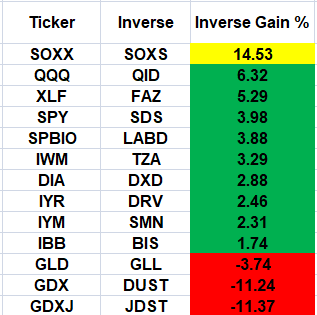
The table below are the ETFs being tracked along with the leveraged inverse fund tickers.
The percentage gain/loss, is for this past Friday’s action and shown for the inverse funds.
Obviously, the semiconductors were hit the hardest on Friday and so, SOXS, had the largest gain.
A good stop level for SOXS would naturally be Friday’s low (not advice not a recommendation). If we really are in an Elliott Wave 3, down … price action’s expected to continue its decline with haste.
Note: Posts on this site are for education purposes only. They provide one firm’s insight on the markets. Not investment advice. See additional disclaimer here.