This site does not use Elliott Wave as a primary analysis tool.
However, to be aware of the technique, will at times provide an additional edge … like now.
Number Two:
Once again, gold and the mining sector have become unbearable to watch.
The amount of hysteria, hype and bloviation serves to make this market all about ego. Ego is a four-letter word for the professional speculator/trader.
We’re leaving it alone for now and moving on to the market at hand: Semiconductors (SOXX).
Semiconductors, SOXX
On a Monthly basis, the chart below is the entire trading history for the sector:
The next chart zooms into the area(s) of interest.
This market, the semis, had its most powerful thrust lower in January, for the entire history of the sector.
The following chart is where it gets interesting.
Elliott Wave labeling as shown. If correct, Wave 3, down has just started (not advice, not a recommendation).
Warning:
My former mentor, the late David Weis, who once worked for Prechter, said the approach is a “cookie cutter” (his words) attempt to force the markets into a pre-defined construct.
With that caveat in hand and the understanding the ‘wave’ could fall apart at any time, let’s see what it would project if price action followed the current labeling and structure.
The daily chart shows a Fibonacci projection based on the Elliott Wave labels:
The projections are in percentiles of the first wave distance.
Elliott Wave rules are that ‘Wave 3’ can’t be the shortest wave. If the structure holds, that means Wave 3 (if that’s what we’re in) would go below the 100%, level and potentially to 161.8%, level.
To Trade, or Not To Trade:
This structure was spotted late yesterday … after abandoning the gold sector. There had already been the pre-requisite hype about CPI numbers and such giving the ‘excuse’ for markets to rise.
That meant risk of a short position (yesterday, early today) was low: not advice not a recommendation.
The chart below of leveraged inverse fund SOXS, shows entry points for what is now: SOXS-22-01
Summary:
Taking a cue from the late Dr. Martin Zweig, on his words during this broadcast, he was very hesitant to use the word ‘crash’.
So, this update is hesitant as well.
However, if the forecasted move of SOXX, to the Fibonacci projected 161.8% level (or more) is realized, it’s a decline over – 37%, from current levels.
It would be significant … crash or not.
Stay Tuned
Note: Posts on this site are for education purposes only. They provide one firm’s insight on the markets. Not investment advice. See additional disclaimer here.
What if the ‘imminent collapse’ of the dollar is overblown by about 50 – years?
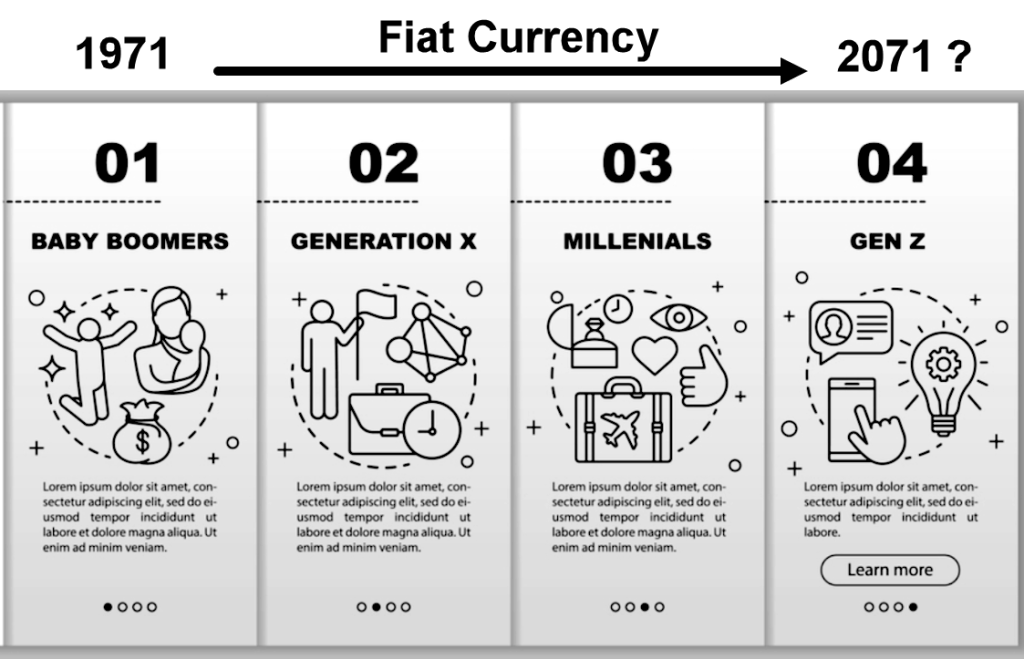
According to this just out, on private gold-filled currency, the article states average life of a fiat currency, is four generations. It goes on to say there are exceptions like the British Pound, continuing on even after hundreds of years.
The Black Swan
In Taleb’s book ‘The Black Swan’, he says it’s an event that nobody expects. It has long lasting repercussions and permanent change.
However, what most if not nearly everybody ignores or leaves out, is his alternate definition. That is:
A Black Swan can also be a future event that’s widely accepted as fact, that does not happen !!!
Is that where we are with the U.S. Dollar?
Even though the dollar has not collapsed and in fact, has rallied as we’ll see below, the ‘collapse’ talk continues unabated.
It’s easy to talk about dollar collapse.
It’s what gets the clicks. No matter that an actual collapse may be years if not decades away.
As of this post, how many ‘monopoly money’ YouTube videos can be found? Seems like it’s the same number or more than, ‘gold to skyrocket higher’.
Well, so far, gold has not skyrocketed higher.
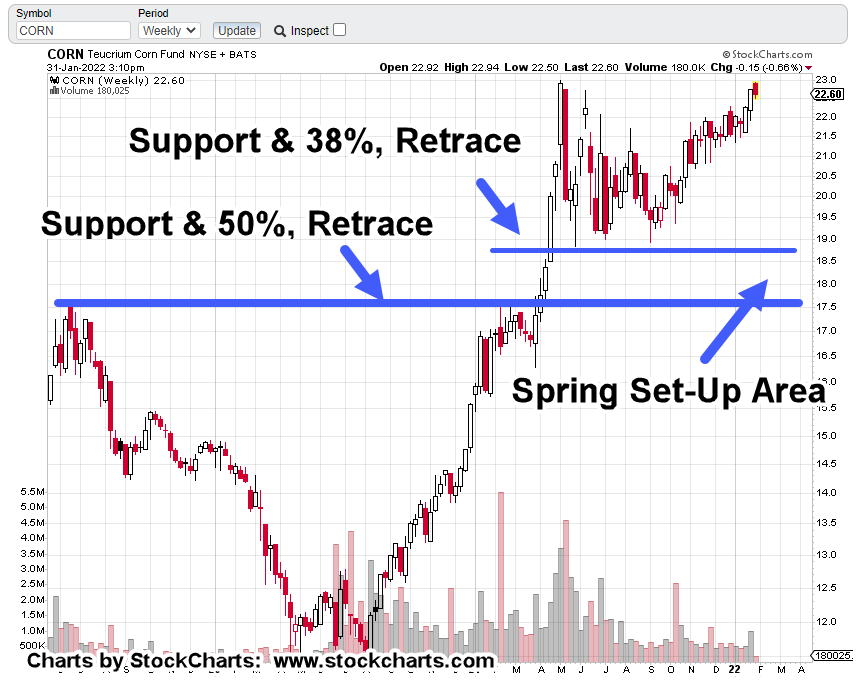
On top of that, this site’s even provided an exclusive correlation that gold’s moving inversely to corn.
See ‘Insight Note‘ at the end of this post.
Ever since the ‘Derecho‘, it’s never been the same.
Back to the dollar.
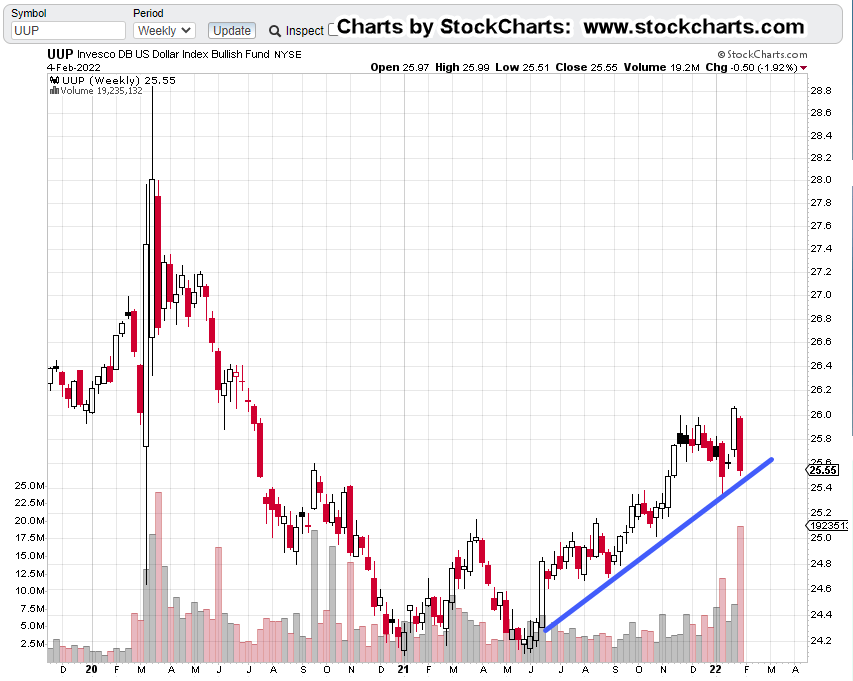
No doubt, the dollar was whacked over the past trading week. Let’s take a look at what the UUP, price action is saying about itself.
Dollar, UUP, Weekly Chart
The unmarked chart shows the dollar oscillating, testing support for six-months at the beginning of 2021.
Then, in mid-June ’21, UUP pivoted decisively higher (gold, GLD, pushed lower) and never came back to those levels.
Of course, this past week The Usual Suspects were out talking about the dollar and ‘monopoly money’.
The chart below shows last week’s bloodbath has served to bring UUP, down to an established trend-line.
It’s important to note, with all that (down) volume, the most since early 2020, UUP was not able (thus far) to break through the trend (blue line).
That leaves the dollar at or near, the danger point.
Continued, sustained selling, risks breaking the uptrend.
If the opposite takes place and UUP starts to rally, last week may have been an inflection point (to the upside).
Gold (GLD) and the dollar appear to still be inversely correlated.
Summary:
Ever since removal of the link to gold in 1971, the dollar has the potential to collapse at any moment.
However, in this case, we at least have some historical precedent that on average, fiat currencies tend to last four generations before becoming worthless.
Wyckoff sates in his writings over and again, ‘somebody always knows something’.
If there’s a collapse afoot, he tells us to look at what the market is saying about itself (not advice, not a recommendation).
Note: Posts on this site are for education purposes only. They provide one firm’s insight on the markets. Not investment advice. See additional disclaimer here.
The Danger Point®, trade mark: No. 6,505,279
Insight Note:
It’s been a strange coincidence over the past year or so, ideas presented on this site make their way to certain YouTube sites either in the titles, or within their content.
The timing of this phenomenon, that within a day or two, ‘post it first here, see it on YouTube there’, has occurred more times than one would consider as just ‘coincidence’.
Admittedly, the insights (making their way to certain YouTubers) have not been exclusive … that is, until now.
Recognition of the Gold/Corn inverse correlation, first posted here, is unique to this site.
As far as is known, this correlation has not been presented on any other financial site or YouTube channel or any other medium.
It may be an important data-point and map into this site’s long-time premise; it’s the corn and the grain first, then gold and silver (not advice, not a recommendation).
For more detail, search for Genesis 41.
When ideas from others are incorporated into the analysis presented on this site, full acknowledgement of the source is cited.
As Dr. Elder said in his book ‘Come Into My Trading Room’:
“I have zero respect for thieves”
He’s talking about the theft of his book title: “Trading For A Living”. He goes on to say, (paraphrasing)
‘Do you really want to use market analysis or input from someone that can’t think for themselves?’
Authorization:
Therefore, this footnote is authorizing the further use of the Gold/Corn inverse correlation by others in the industry if they so choose with the following caveat:
If one of the sites monitored (or some other media) uses this exclusive insight, and does so without referencing the source, it puts this author in the unenviable (but not unfamiliar) position of calling out the thief by name … not unlike what Stew Peters is doing (to the hoax/genocide perpetrators) on his broadcasts.
This market environment’s providing a fantastic public service:
It’s separating out the hucksters, the shysters and the otherwise incompetent from those who are, or who are striving to provide a service or useful insight.
The general investing public may find out soon enough, they’re on their own. Maybe unbeknownst to them, they’ve always been on their own.
For all of us serfs in the banana republic proletariat, it’s near if not impossible, to keep up with the lies.
The latest ‘employment‘ report is just one example.
This video from Jerimiah Babe, posted a few days ago has a different story. Check out the intro and then farther on at time stamp: 9:00.
For a second opinion, we can go to Dan, at i-Allegedly.
On his latest post, fast-forward to time stamp 7:00, where he walks through an outdoor restaurant area that’s completely vacant.
The ’employment’ report is vapor. Judging from the comments (at ZeroHedge) most everyone seems to be aware of the fakery.
Naturally, with all of this uncertainty and rampant inflation, the logical place to go would be the gold market.
Junior Miners, GDXJ
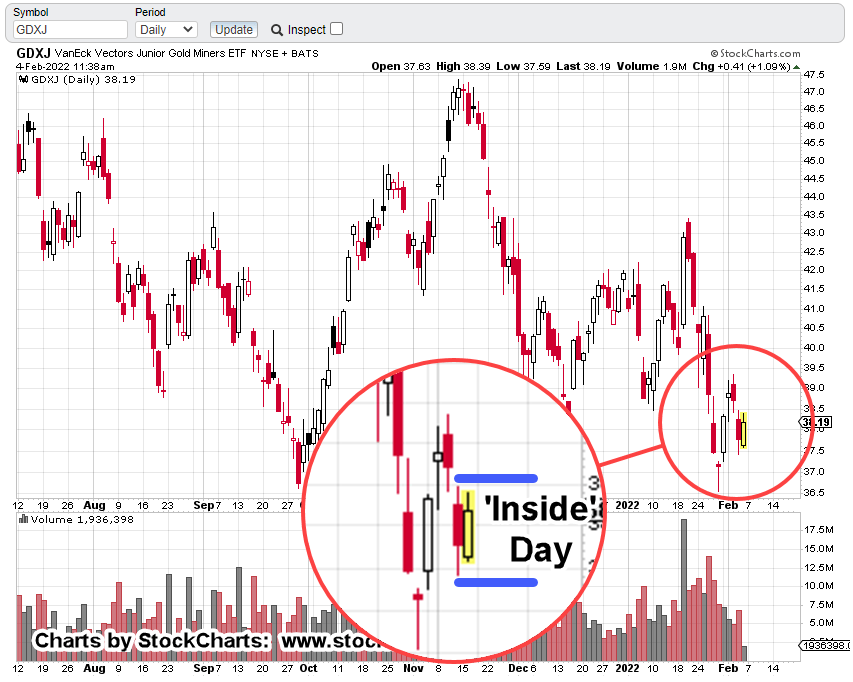
As this post is being created (mid-session), the Junior Miners are at the danger point. Price action’s at a location where it’s decision time.
So far, it’s an ‘inside day’. We don’t have a new daily high or low from the previous session.
The Fib retrace of 23.6%, discussed previously is holding for now. That weights action to the downside.
Posting a new daily high would begin to erode the set-up; potentially indicating GDXJ, is going to attempt a retrace to the Fib 38%, level.
If that higher retrace becomes a more favorable probability, the JDST-22-01, trade will likely be closed out (not advice not a recommendation).
The chart below shows the inside action thus far.
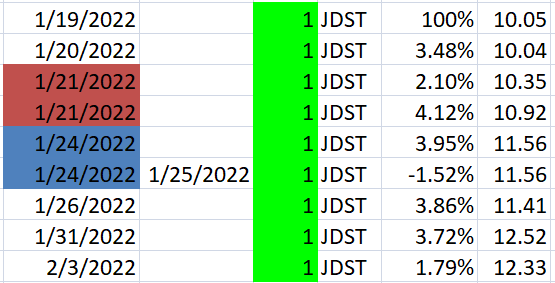
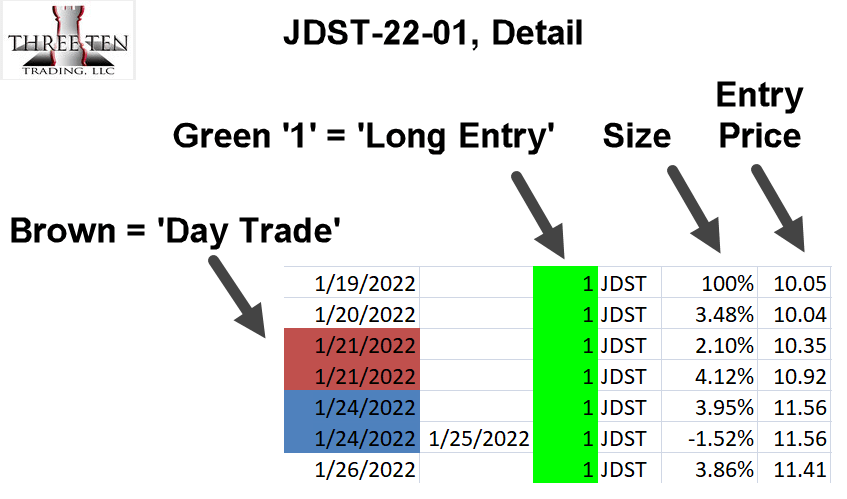
The table below has the current positioning JDST-22-01, via inverse fund JDST (not advice, not a recommendation).
As always, the sell finger is on the trigger. Description of color coding and table layout is in this post.
Summary:
Trade decisions posted on this site are defined by the price action itself (not advice, not a recommendation). Wyckoff analysis does not concern itself with what’s obviously fake.
Wyckoff focuses strictly on what the market is saying about itself.
At this juncture, price action’s saying that both bulls and bears, are at the danger point.
Note: Posts on this site are for education purposes only. They provide one firm’s insight on the markets. Not investment advice. See additional disclaimer here.
What we’re looking for here, is some kind of Jimmy Carter type stunt where corn exports are halted in the name of ‘national security’ or some such thing.
More detail on the Carter grain embargo at this link … scroll down to No. 12
Of course, if that happens, corn is likely to crash (like it did last time) if only temporarily.
More Is Less
A corn embargo means more corn for us, right?
Probably, wrong.
Remember, fertilizer prices are sky-high.
Elevated corn prices (like now) might just cover the cost for the farmers … maybe.
A corn crash in the commodities would likely mean even less corn gets planted … maybe none at all.
Enter, The ‘Bought And Paid For’
It may be that easy (as above), or get complicated because a major consumer of U.S. exported corn, is China.
Exports to China over the last year have literally gone off the scale. Add to that, China is the number two holder of U.S. Debt.
So, one can already see where this may be going.
After the initial fake panic where the politicians realize there’s a crisis (that part being real), which they themselves created, they’ll likely pontificate about halting exports for just long enough, to have farmers throw in the towel with no spring planting.
After all of that, and let’s not forget special investigative news coverage about ‘how all this happened’; blame it on climate change and then keep everything the same.
Exports continue (to China) as much as possible and the U.S. citizens starve … literally.
By the way, go to time stamp 24:04, at this link and look at the clouds in the upper right. For those awake, it’s clear; right angle, cross-hatch pattern.
Right angles are not a natural phenomenon. Whatever climate change there is, is the one being created.
When Corn Takes The Dive
If or when corn takes a hit, price action itself will define the correct trade action.
So, let’s be ready and not surprised, if we see corn in chaos.
Note: Posts on this site are for education purposes only. They provide one firm’s insight on the markets. Not investment advice. See additional disclaimer here.
Hearings on Capitol Hill on what we call ‘The Speck’ (to avoid censorship) and “corruption at the highest levels”.
Those of us who are awake, already know about the corruption … it’s just nice to see it hitting the mainstream.
No. 2
Cowards, To Brave ? … Probably Not
Max Igan in this video seems to think those who have been brainwashed into murdering their own children, will all of a sudden become brave and wake-up.
No, an alternate (more likely) view is, those who have been duped, fooled, the cowards, or just plain stupid, will likely turn their anger, not to the perpetrators … but to those who are even now, being referred to as ‘purebloods’.
In his own video, at time stamp 10:30, he shows the type of behavior that may go to a whole new level.
Does anyone think these people are going to become more sane, when they find out the truth of the injections?
No. 3
Greedy Implosion ?
Another Stew Peters broadcast where the guest, Karen Kingston has sifted through legal contracts, patent application and patent abstract documents.
She may have found a chink in the armor.
Looks like in the haste for profits, one manufacturer of ‘Speck’ protection may have done so outside the umbrella of lawsuit ‘immunity’.
Indeed. We can see how tough (and profitable) they are from Livermore’s attempt to short the market during The Panic of 1907.
As stated in Reminiscences, the story goes that he recognized a huge market break coming but started shorting too early … in 1906, as the market continued to rally.
Eventually, those rallies completely depleted his capital. He went broke.
The book goes on to say he began trading again later on but does not say how he got another capital stake; just that his credit was good at the brokerage office of ‘Ed Harding’.
We have to go to Wyckoff’s text from 1910, to find out that Livermore hocked his car for $5,000 and may have used that to re-establish his trading account.
After that, his trading errors corrected, he eventually covered his short positions at the bottom of the panic, October 24th of 1907, with over one million in profits (around 30 million in today’s dollars).
No. 6
T-Mobile: Set To Implode By April
Is dumb going to get smart? Like in No. 2, above, the answer is probably not.
Data and artifacts are piling up to dam-break levels.
There’s a virtual army of citizen journalism working to discover and sift through databases and documents.
No. 9
The Parting Shot:
What does any of this have to do with the markets?
Well …
Get your popcorn ready, ’cause Kansas is going bye, bye ….
Stay Tuned
Note: Posts on this site are for education purposes only. They provide one firm’s insight on the markets. Not investment advice. See additional disclaimer here.
Note: Posts on this site are for education purposes only. They provide one firm’s insight on the markets. Not investment advice. See additional disclaimer here.
That is, the strategies and research presented on this site are leading actual news events by about twelve months.
Example No. 1: The Dollar Rally
The dollar rally potential (when first recognized) was presented in this post over a year ago.
Since then, about 10 – 11 months later, ZeroHedge picked it up only after it had become a full-blown reversal.
The dollar has continued to rally and is currently (after breaking support), in Wyckoff ‘spring position’.
Example No. 2: The Food Supply & ‘Inflation’
One of the earliest posts discussing the intentional destruction of the food supply, is linked here.
From that update, we had:
“The entire U.S. agricultural food supply infrastructure is being systematically dismantled.”
Those statements looked hyperbolic at the time.
Obviously, at this point, it’s becoming common knowledge; at least for anyone that’s listening.
Example No. 3: The ‘Speck Effect’
In what may have seemed like a brutal rant, has now become fact.
This rendition of ‘The Night Before Christmas’, posted over a year ago, had no links to support the intuitive assessment of what was to come.
That post has now been updated with the facts.
Warning Note:
Obviously, not everyone injected, is a coward.
Children are rightly terrified. Let’s be realistic.
However, the idiot parents and enabling Doctors and Pharmacists are (eventually) likely, as Dr. Vernon Coleman puts it, to be arrested and tried/convicted for either murder or attempted murder.
Summary
There are other research examples like gold and the gold miners but the three above, cover the picture fairly well.
From the data presented, it’s apparent at least two things are happening simultaneously.
No. 1: Strategic Analysis
World, market, and local (within the U.S.) events are researched and analyzed for potential impact.
No. 2: Market (Wyckoff) Analysis
Those events from No.1, are then linked to market action if any. Potential opportunities are identified.
The Path Forward:
This update is a very brief description of the site’s go-forward objectives.
What’s here, is a long-term (documented) track record of situational awareness; coupled with reading price action which in turn, is used as a case for market positioning.
Stay Tuned
Note: Posts on this site are for education purposes only. They provide one firm’s insight on the markets. Not investment advice. See additional disclaimer here.
No fan, and no endorsement of Buffett but the quote is applicable.
If yesterday’s Newmont analysis holds, meaning, it’s the last stand before another leg-lower, gold bulls might start acting irrationally.
Is it even possible to be more irrational?
Remember their manic prediction of $3,000/oz, gold in months, not years?
Barring a major reversal, the tide’s going out.
From the comments section of this ZeroHedge article, some in the herd are figuring it out as well.
As one of them says … ‘another year to wait before the Great Pumpkin’ (i.e., gold moving higher).
As this post is created, comments continue to pour-in.
Gold bulls are frustrated, confused, pontificating, crypto loving/hating, central bank blaming, it’s all there.
Thus far, there’s not one comment on what price action is actually doing.
Public Service Announcement
This whole business with the financial media and its attendant hucksters (recent examples, here and here) is actually a fantastic public service.
For anyone who’s still able to think (an act of rebellion in itself), it’s clear, or should be, if you’re on TV, or the mainstream media, you’re a shill until proven otherwise.
The good part?
All of this media, podcast, carpetbagging and corruption, plays right into the hand of Wyckoff analysis.
Wyckoff focused on what is … not what should be.
Even back in the early 1930s, he was adamant about ignoring the financial press. ‘You’ll never be successful’, he said if you listen to the hype.
Mixed Messages
On cue to support that statement, is Dan, from i-Allegedly; he reports ‘we’re getting mixed messages‘ in the economy.
Proving the point.
The (Trade) Plan Forward
With the caveat, anything can happen; gold could rally in a couple hours when the futures open, the short via DUST (not advice, not a recommendation), is as follows:
Even if the trade fails at the next session, it would still provide valuable information.
With that in mind, no matter what happens it’s likely to be referenced in the future; so, it needs a name (or number).
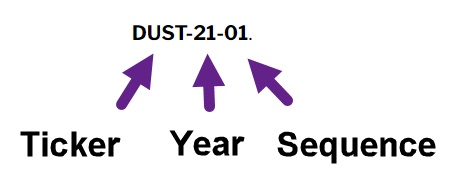
Taking a cue from prior engineering work (creating numbering schemes), the current trade will be identified now, and in future posts, as: DUST-21-01.
Seems straightforward.
The ‘First’ Correction
No. 3, above is titled ‘The first correction’.
This labeling is borrowed from a trade discussed by William Doane, in Dr. Elder’s book: Entries & Exits.
Price action permitting, we’ll discuss how this first correction may be a brief one as opposed to a drawn-out choppy affair.
Stay Tuned
Note: Posts on this site are for education purposes only. They provide one firm’s insight on the markets. Not investment advice. See additional disclaimer here.
Following the corporate media (always a mistake) and YouTuber’s alike (sometimes a mistake), only to find out it’s all been a lie.
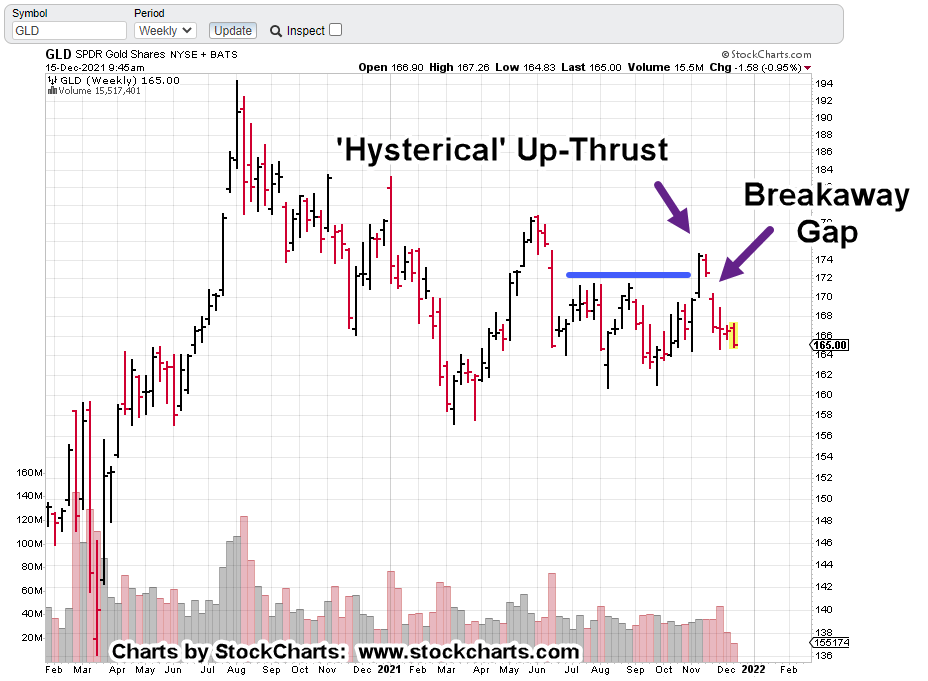
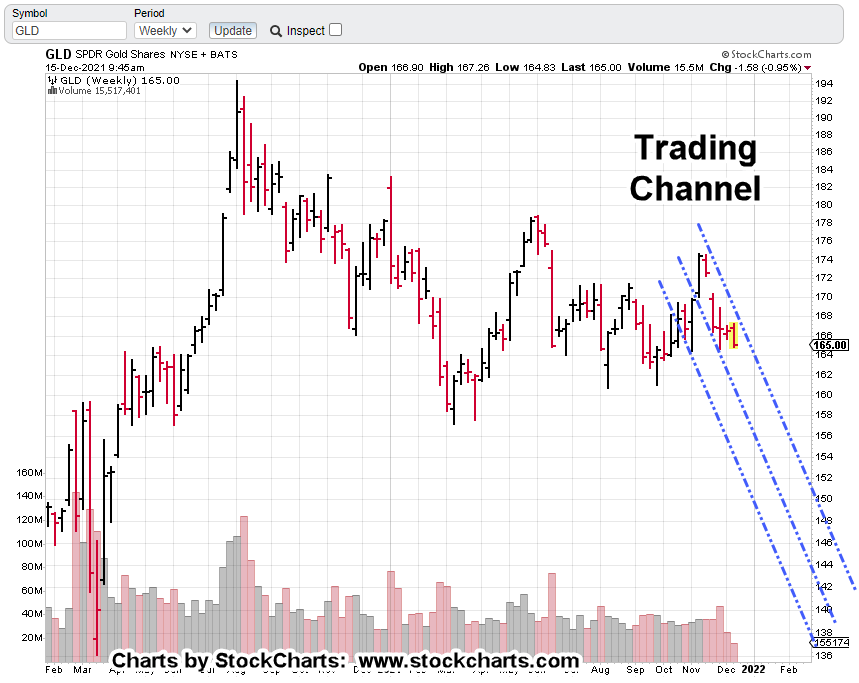
Gold (GLD), looks like it’s solidifying its breakaway gap (chart below) and simultaneously confirming a potential trading channel.
In what may be related news, ZeroHedge reports some of the internet is down … again.
Note the websites having problems involve food, payroll services and of course, entertainment.
Separately, the dollar (UUP) just made a new weekly high as its rally continues. In Steven Van Metre’s Sunday Night update (time stamp: 18:01), if the dollar breaks higher above UUP 26 or 27, then “… all the wheels come off ….”
Which brings us to the gold market.
Gold (GLD), Weekly Chart
The chart reviews the recent up-thrust (reversal) that was accompanied by hysterical … bordering on unhinged insane press coverage of an imminent break higher.
Obviously, that didn’t happen.
Zoom version
In addition to the reversal and breakaway gap, there could be a trading channel as well.
That’s a good thing for the bears as it gives a more clear exit area … negation (or break) of that channel (not advice, not a recommendation).
Zoom version
Of course, anything can happen. The Fed announcement is about two hours away.
However, it looks like gold and miners alike, are not waiting around … potentially beginning their decline in earnest.
Note: Posts on this site are for education purposes only. They provide one firm’s insight on the markets. Not investment advice. See additional disclaimer here.
Steven Van Metre, in his Sunday Night Charts (time stamp 12:20), shows the precarious situation of GDX.
There’re about 90-minutes left to go in this session.
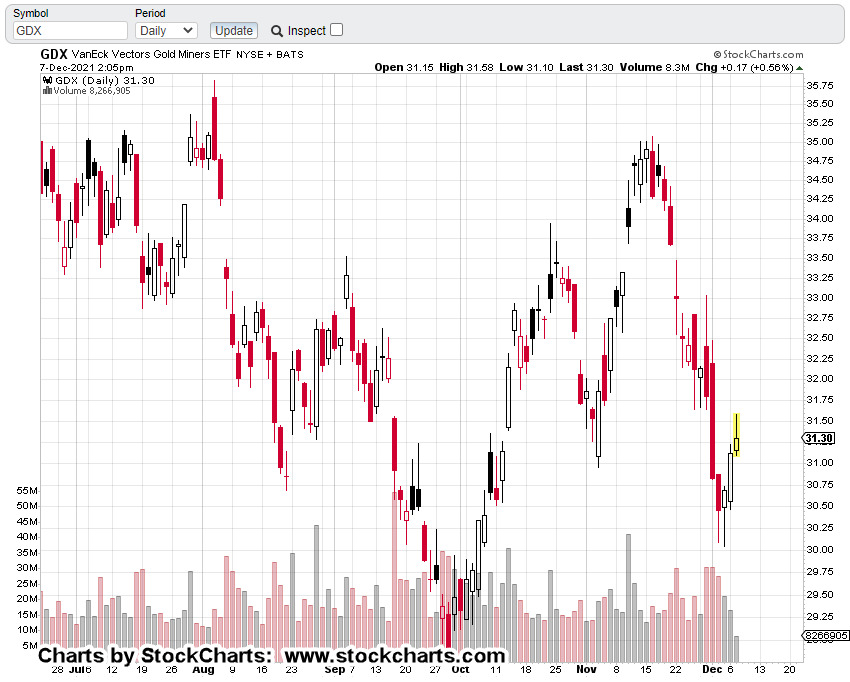
It looks like GDX is/has tested underside resistance and down-trend simultaneously. For GDX to break higher, it would have to get through that resistance.
As always, anything can happen but we need to remind ourselves, the gold bulls are already trapped … having bought at the mid-November breakout.
If still holding, they’re now deep in the red.
Under such conditions, each down move serves to set the (bear) hook even more.
If we use this just released article from ZeroHedge, we’re nowhere near any kind of capitulation and upside reversal.
Senior Miners, GDX
The un-marked daily chart
And now …
With zoom
We’re at a confluence of resistance; the downtrend and the underside of price action.
Let’s keep in mind, the overall markets (S&P, Dow, Nasdaq) are still oscillating around their all-time highs. Volatility has increased as the trend appears to be changing.
Gold and the miners are nowhere near all-time highs.
A century ago, Wyckoff showed how to spot markets that would decline the fastest and farthest under bear market conditions (not advice, not a recommendation).
It’s not the high-flyer we’re looking for … no, it’s the laggard.
That’s the one to pick.
It’s already weak and once the buoyancy of the general market evaporates, the bottom may fall out.
Note: Posts on this site are for education purposes only. They provide one firm’s insight on the markets. Not investment advice. See additional disclaimer here.