Note: Posts on this site are for education purposes only. They provide one firm’s insight on the markets. Not investment advice. See additional disclaimer here.
Note: Posts on this site are for education purposes only. They provide one firm’s insight on the markets. Not investment advice. See additional disclaimer here.
Note: Posts on this site are for education purposes only. They provide one firm’s insight on the markets. Not investment advice. See additional disclaimer here.
Since Wyckoff analysis doesn’t care about the press, we’ll use it to discern the (potential) truth.
Let’s see how it did in the recent past. The Nat-Gas (UNG) low, was identified to-the-day,link here.
From that post, was this:
“Downward thrust in Nat-Gas UNG, appears to be exhausting itself after a 20-month, bear market.Risk is never zero, but currently appears to be at a low … “
So, it was. Afterwards, UNG bounced near, but never touched that low.
Twelve trading days later (Fibonacci 13 days, from low), it reversed decisively to the upside.
The Same, But Not
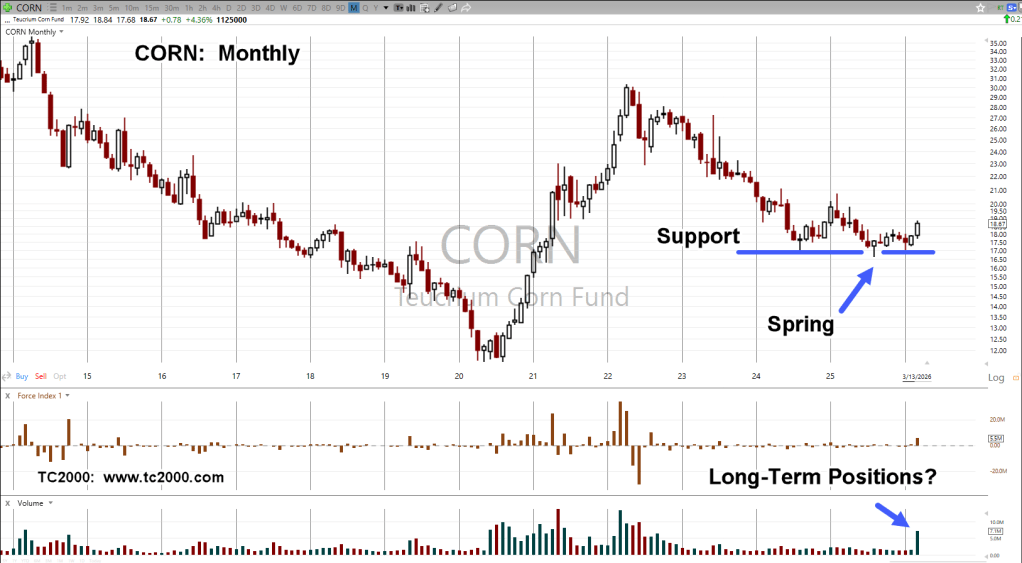
On the medium, to long-term, CORN action is the same as biotech (XBI), but opposite.
Instead of an up-thrust two-years in the making, we may have a spring set-up, taking just as long if not longer.
Note: Posts on this site are for education purposes only. They provide one firm’s insight on the markets. Not investment advice. See additional disclaimer here.
It’s been a while since rounding up The Usual Suspects.
However, like last time, the stupidity, misdirection, misinformation, outright falsehoods, overall grift and schtick, has got to the point where an update is needed.
We’ll start off by repeating No. 1 from the prior ‘suspects’ as it encompasses the whole genre of ‘non-thought’ by the public and financial press alike; readers of this post excepted, of course. 🙂
No 1. There (still) is no Fed Pivot. Seriously, have rates really, actually been lowered? Everyone has a huge case of ‘normalcy bias’. i.e., what the Fed did last time will happen this time.
The 40-year bond bull market from the ’80s, ended in 2020. We’re in a different paradigm now.
We’ll add in this updated post, James Grant, of Grant’s Interest Rate Observer.
He second’s the motion: The 40-year bond bull market, is over. Period.
Note: Posts on this site are for education purposes only. They provide one firm’s insight on the markets. Not investment advice. See additional disclaimer here.
“What we’re looking for here, is some kind of Jimmy Carter type stunt where corn exports are halted in the name of ‘national security’ or some such thing.”
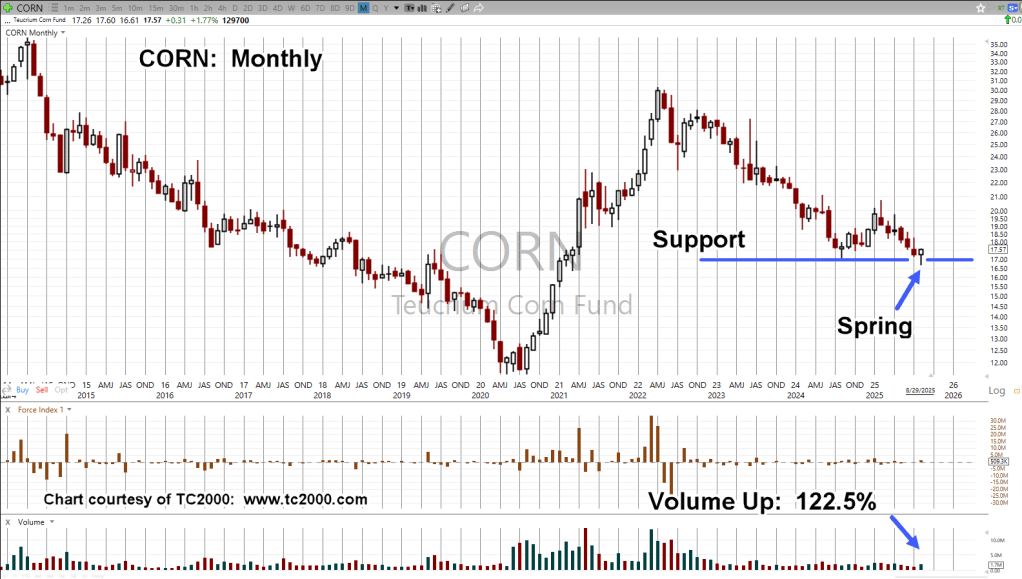
Corn Tracking Fund CORN, Weekly
Two Fibonacci projections are overlaid on the chart.
First, a simple retrace starting near ‘Derecho’ lows, to highs set during the week of April 29th, 2022.
Second, a counter-trend projection from those highs to the intermediate lows set during week of May 19th, 2023 and highs of June 23rd, week, the same year.
CORN has retraced 61.8%, which is also the 1:1 counter-trend projection. In addition, it’s the measured move from the wedge break.
The market has effectively confirmed the support area.
Oil Goes Negative … And Corn?
Remember that ‘anything can happen’. Oil futures made history by going negative.
We’re in a new construct, a new paradigm, our strategy should match accordingly.
Everyone has their own perspective and plan for the markets; fair enough.
From here, CORN could continue to new, all-time highs.
However, for my accounts, I’ll wait until such time it appears the downside risk is removed as much as possible.
One potential area for that ‘removal’ is the 76.4%, retrace in the vicinity of CORN @ 16 (not advice, not a recommendation).
Note: Posts on this site are for education purposes only. They provide one firm’s insight on the markets. Not investment advice. See additional disclaimer here.
Bridge in Baltimore collapses after container ship strike; major port is ‘paralyzed’.
Harvard to screen a movie about blowing up pipelines, and then:
Nat-gas rachets down; volatility is low, all quiet, for now.
Strategy First
It’s been almost a year since the first post, discussing the potential for a disruption to the nat-gas supply.
A lot of things have happened since then.
For example, large speculators have likely been forced-out of the UNG, proxy. Quoting from the link above, August of last year, we have this:
“If everybody’s ready for it … it won’t happen at all or not when it’s expected to happen.”
So, the crowd and the crowded trade, is probably gone.
Then, we have continuing infrastructure disconnects, like the bridge collapse above, the aviation sector, and cattle (the food supply), to name just a few.
Looking at the weekly of UNG, with Force Index (lower panel), we see downside pressure is dissipating.
Natural Gas UNG, ETF, Weekly
Weekly thrusts lower, have less energy (magenta arrow)
In addition to weakening downside force, the weekly range is also becoming more narrow (blue arrow).
So far, there’re no signs of increased demand, and UNG can continue on its way to lower levels.
However, we’re already at multi-year lows; indicating, with each net downside move, downside risk is also being reduced (not advice, not a recommendation).
Note: Posts on this site are for education purposes only. They provide one firm’s insight on the markets. Not investment advice. See additional disclaimer here.
How long have we heard incessant rants, gold and silver hyper-launch is imminent?
Sure, I like gold as much as the next guy. It feels good when you hear the ‘clink’ of real money in your hands.
However, one has to remain unbiased and look at what price action, the market is actually telling us.
Strategy First
Since December 2020, this site has proposed, we’re in a situation similar to Genesis 41; it’s the food supply first, then gold and silver (not advice, not a recommendation).
In this post (two years ago), an observation, ‘stackers’ may be forced to liquidate just to survive.
Now, we have this and this. On that second link, the comments tell the real story:
‘… people are selling their silver because they need cash.’
With that, let’s look at the chart of gold, GLD.
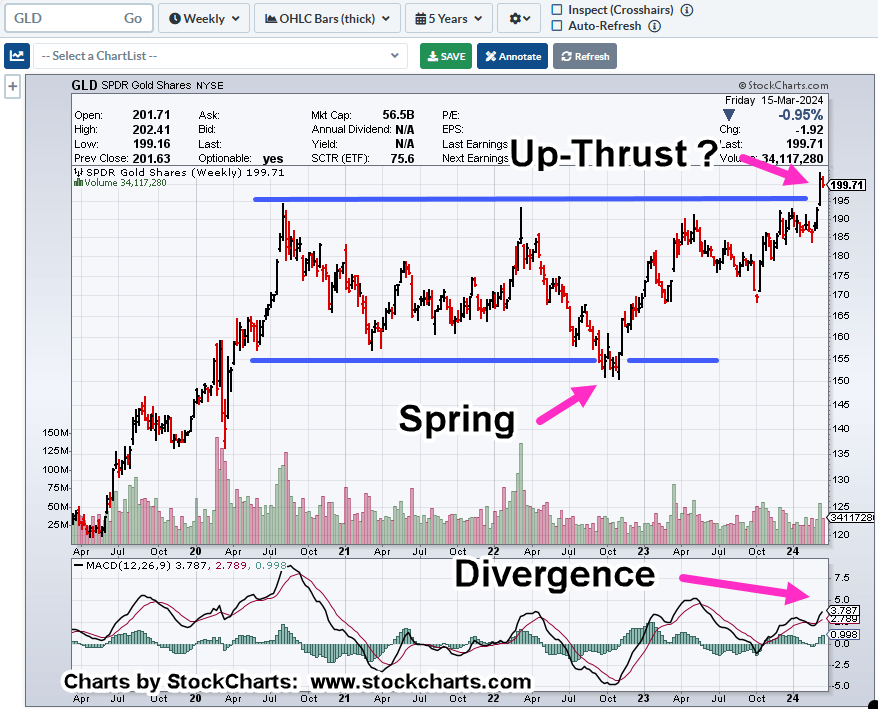
Gold GLD, Weekly Bar
We’ve seen it before, the set-up, The Danger Point®
Let’s add some insight to this picture, hidden in the chart; we have the following:
Look at how much time it’s taken GLD, to go from the bottom of the range to the top; longer each time and with less energy, shown by the decline in (upside) volume.
Longer & Less
Takes longer and less energy.
Still, that does not guarantee anything. Gold cold just keep on grinding higher.
However, probabilities suggest (the chart itself) we may be at or near, a pivot to the downside (not advice, not a recommendation).
Note: Posts on this site are for education purposes only. They provide one firm’s insight on the markets. Not investment advice. See additional disclaimer here.
Not in any particular order; not advice and not a recommendation.
No 1. There (still) is no Fed Pivot. Seriously, have rates really, actually been lowered? Everyone has a huge case of ‘normalcy bias’. i.e., what the Fed did last time will happen this time.
The 40-year bond bull market from the 80’s, ended in 2020. We’re in a different paradigm now.
No. 2 Natual Gas UNG, is reversing. We’ll see whether or not there’s going to be a supply disruption.
No. 3 The semiconductors SOXX, now have a monthly bearish MACD divergence; daily and the weekly indicators posting even to prior tops (as of Friday’s close).
No. 4 Components of biotech index XBI, are being shuffled around faster than deck chairs on the Titanic … or, the Olympic 🙂
Seems like a mad dash to add/remove, increase, reduce equities to prop things up. We’ll see how that turns out. Currently, XBI is right at resistance level, 86.50 – 87.0
Here’s just one example from an index, riddled with equities that have no P/E.
No. 5 Carvana is very close to posting new highs and potentially, running the stops.
No. 8 Gold, GLD, is currently not going higher (look at the divergences); silver (SLV) is in a major non-confirmation, down nearly – 55%, from all-time highs.
During the 1980s inflation, precious metals moved (upward) together.
Silver looks like it’s responding to the destruction/collapse of (economic) demand.
No. 9 American Tower (AMT), number two in the IYR index, posts a clear false breakout and reversal.
If rates really are going (materially) lower, interest rate sensitive real estate should continue going higher, right?
No. 10 Which brings us to the bond market, TLT.
Price action broke above established resistance, currently hovering above that level.
It’s at The Danger Point®
We can see the set-up, a price action pattern repeated time and again, between the lower and upper blue lines, called a ‘Spring-to-Up-Thrust.
While the media laughs at the bears, let’s just see how this all works out.
Note: Posts on this site are for education purposes only. They provide one firm’s insight on the markets. Not investment advice. See additional disclaimer here.
From a long-term strategy standpoint, this site has been consistent; it’s the food supply first, then gold and silver (not advice, not a recommendation).
The next shoe has yet to drop on how or what’s going to be used to extract (or confiscate) precious metals from the (stacking) proletariat.
So far, it’s been three-for-three (here, here and here) identifying recent significant technical conditions and turning points for gold, GLD.
At this juncture, the dollar collapse, and the silver/gold bull launch are just not happening. It’s not there … something else is going on (not advice, not a recommendation).
We’re in the middle of a massive sovereign bankruptcy (Time Stamp 7:10) that’s never happened before.
What’s going on behind the scenes is not visible to us.
However, from a Wyckoff analysis standpoint, those (hidden) actions and decisions show up on the chart(s).
Constantly giving press conferences discussing the strength of the military campaign when the exact opposite was true.
It may be so with gold as well (not advice, not a recommendation).
The local supermarket has decided, after a 22-year long bull market, it’s ‘safe’ for profit.
The hapless public is now standing at the gold kiosk; with face-mask firmly secured, arm bandaged from the latest booster, EV FOB in hand (or pocket), hypnotized into yet another mania.
Note: Posts on this site are for education purposes only. They provide one firm’s insight on the markets. Not investment advice. See additional disclaimer here.