The Market Set-Up … This Week

What To Watch

First off, it’s nice to know, traders at J.P. Morgan, don’t have clue as what to do.

They say it themselves; Not One Person

On top of that, I’m supposed to pay money reading about how clueless they are. 🙂

No thanks. Let’s see if we can do better than the average ‘investment firm’.

Before we get started, a reminder; as Michael Cowen says:

‘It’s the bear market that reveals those who really understand’, not the bull market ‘geniuses‘.

With that, let’s get into it; first up, is silver.

Silver: Wyckoff Analysis Results

The downside reversal was identified to the day.

Adding to that post, Europeans could not only be freezing or starving this winter, but also subject to radiation poisoning.

Surely, they’re all thinking that ‘stack’ of silver is going to save them.

Silver (along with gold) remain trending lower.

Silver (SLV) is currently at support levels; therefore, some upward action (staying below SLV: 18.5) is normal behavior.

Bonds: Are They Ready?

Hold your nose … bonds could be setting up for a rally.

As Steven Van Metre reports here, the Fed ‘shenanigan’ meter is pegged.

Bonds, TLT Weekly

Note, the bullish TLT, set-up is not confirmed until MACD ticks higher (not advice, not a recommendation).

Also note the repeating pattern of ‘spring to up-thrust‘.

Last up, biotech

Biotech SPBIO, Hourly (Inverted)

We’re going to use the chart from yesterday’s post to set the stage for getting closer-in.

This past Friday’s early morning ‘spike’ is barely visible; the 30-minute (inverted) chart below, has more detail.

SPBIO, 30-minute (Inverted)

Price action rejected the lower levels (higher on SPBIO) and pulled away throughout the session. That ‘pulling away’ continued on, all the way into the close.

That’s a clue there may be follow-through at the next session.

If the early session opens ‘gap-higher’ (SPBIO, lower), into the resistance area (four magenta arrows, hourly chart), it would be the fourth time pressuring at this area; markets rarely hold a fourth attempt.

Summary

Of course, other markets are being watched like real estate (IYR), Tesla (TSLA), and even Basic Materials (DJUSBM), a potential sleeper for significant downside.

Updates are planned if/when low risk shows up.

Positions: Current Stance (courtesy only, not advice).

The following is the positioning of my firm’s main (largest) account.

LABD-22-08:

LABD Entry @ 25.1278, 24.735, 26.025, 22.99, 22.29***, Stop is @ LABD 21.23***

***, Indicates change

Note: Positions may be increased, decreased, entered, or exited at any time.

Stay Tuned

Charts by StockCharts

Note:  Posts on this site are for education purposes only.  They provide one firm’s insight on the markets.  Not investment advice.  See additional disclaimer here.

The Danger Point®, trade mark: No. 6,505,279

Real Estate Crash … Exit Targets

The DRV, Exit(s)

Well-calculated stops, (mostly) take care of trade implosion. So, where’s the exit?

The answer is there’s no set answer.

We’ll explain that by using the current plan for DRV-22-04 (not advice, not a recommendation).

Questions

First question to determine an exit in this case, is to ask:

“What are the media pundits, and/or ‘experts’ talking about right now?”

Well, that’s easy.

Just like the ‘silver squeeze’ idea that won’t go away (even as SLV continues downward), the ‘Fed pivot‘ is another delusion that keeps holding on.

As parts of the market (like IYR) continue their free-fall, all eyes are on the next Fed meeting; waiting for them to pivot and ‘save us’.

Right around November 1st, or 2nd, seems like it can’t help but be some kind of emotional cathartic set-up.

Unless stopped out ahead of time, the plan, is to plan an exit within that window.

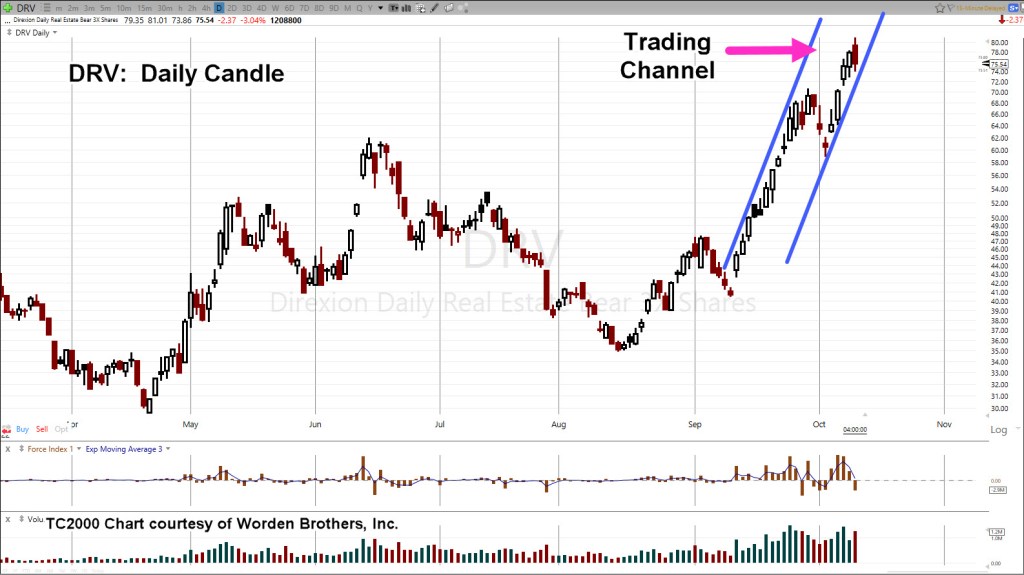
Let’s go to the IYR, 3X Leveraged Inverse fund DRV.

IYR, 3X Inverse, DRV, Daily

At the end of today’s session DRV has posted a downside reversal candle.

The next session will be important.

We either have follow-through to the downside, thus validating the reversal (and exit of the position) or we have some variation of an inside day or new daily high.

If the trading channel remains valid, the compressed chart below shows a potential exit range: DRV 140 – 200.

During the next session(s), if DRV, posts a new daily high (unless stopped), the DRV-22-04, stop will be moved to this session’s low @ 73.86

Positions & Current Stance (courtesy only, not advice).

The following is the positioning of my firm’s main (largest) account.

DRV-22-04:

Entry @ 66.463, Stop @ 63.98

ZSL-22-01:

Entry @ 28.08, Stop @ 28.53:

Discretionary exit (today) @ 31.5513***

Trade Closed

LABD-22-08***:

Entry @ 25.1278 (yesterday) and 24.735 (today), Stop @ 22.59

***, Indicates change

Note: Positions may be increased, decreased, entered, or exited at any time.

Stay Tuned

Charts by StockCharts

Note:  Posts on this site are for education purposes only.  They provide one firm’s insight on the markets.  Not investment advice.  See additional disclaimer here.

The Danger Point®, trade mark: No. 6,505,279
Silver … Sold Out !

… And The Bulls Are Trapped

How is it possible to have silver stocks sold out here and here, yet silver bears have trapped the bulls.

As we’ll show below, this morning’s action in SLV, has confirmed the reversal; a Wyckoff up-thrust, pointing silver’s probability to lower levels.

For starters, let’s recap on how this (trading) game is played.

That is, the public i.e., the masses, need to be led to and fro so they are continuously on the wrong side of the trade.

That’s it.

So it is with precious metals and specifically silver.

The media came out recently, effectively telling everyone ‘Now is the time to buy gold’.

Where were these guys in 2001, when gold bottomed around $271/oz.

No, they show up at the end of the move … not the start.

Public Buys Hype, Not Facts

So the public has bought into the hype and run the silver coffers dry. Everyone excepts an immediate currency collapse and certainly anything can happen.

However, as Undedicated Economist points out, the dollar strength (first identified in this post) can last for years.

The original (bullish reversal) analysis is now supported by the facts; it’s been nearly two-years since that post and the dollar (UUP) is still headed higher.

So, let’s find out where silver is likely to go. For that, we go to the weekly chart.

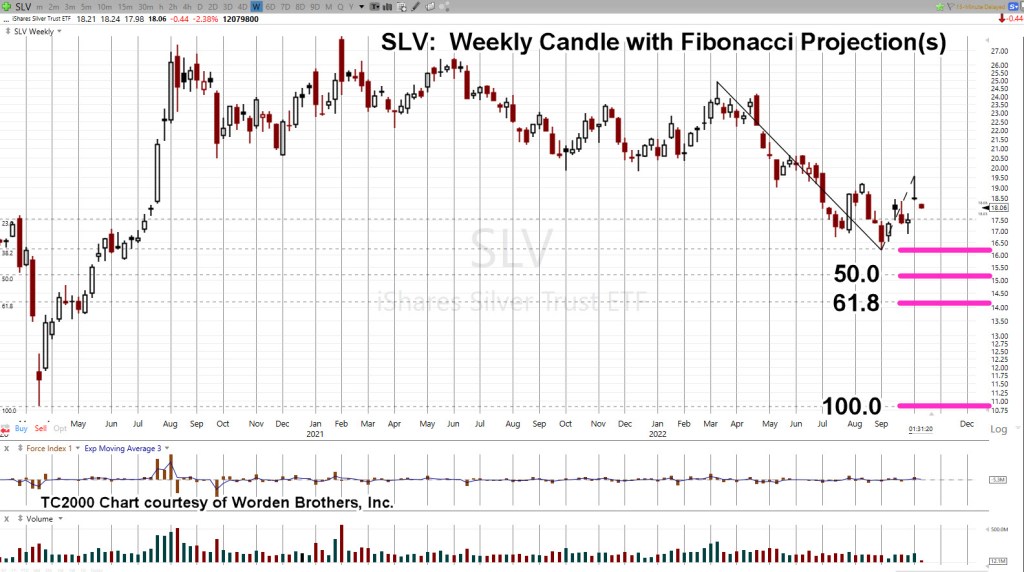
Silver SLV, Weekly

The set-up, already posted; Spring-to-Up-Thrust.

It’s a repeating pattern found across the markets.

Price action gets itself into a spring condition by penetrating support which subsequently sets up the reversal; the up-thrust.

Next, we’ll use the Fibonacci Projection Tool, showing likely areas for downside destination.

A full 1 : 1 projection gets us right back to where we started the whole ‘short-squeeze’.

If SLV, gets back down to the 10.50 – 11.0, level, one can only imagine what type of hype will be in vogue.

However, at those levels, it’s reasonable to expect the local bullion dealer will be begging for sales … they might even offer their product at, or near, spot. 🙂

Stay Tuned

Charts by StockCharts

Note:  Posts on this site are for education purposes only.  They provide one firm’s insight on the markets.  Not investment advice.  See additional disclaimer here.

The Danger Point®, trade mark: No. 6,505,279

Trading A Silver Collapse: Part 3

No One Expects A Long Term Siege

This time is different.

This is not 1987, or 1998, or 2000, or 2008.

In those cases, once the market reached bottom, the recovery was sharp (’98, ’09) and if not, was steady as in ’87 and ’03 – ’04.

In each case, interest rates were high enough to allow ‘fiddling’ that would in turn, result in the desired (i.e., up) market response.

Ammo Is Spent

This time, we’re in another melt-down and there’s no ammunition left to save the market.

That all got spent in ’08.

Back then, those witnessing firsthand, efforts like TARP, could feel in their gut, ‘there won’t be a (save) next time’.

So, here we are.

Always Fighting The Last Battle

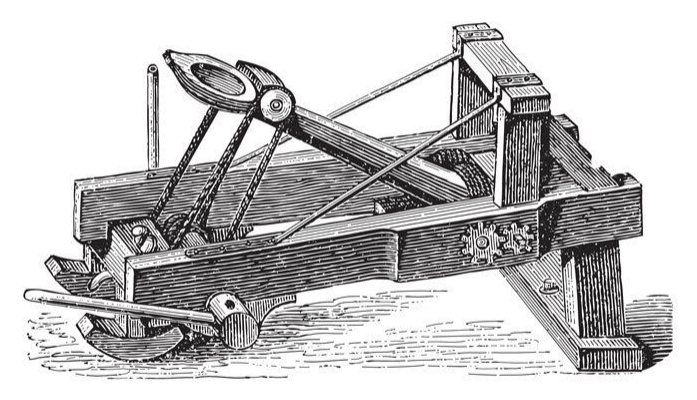
It’s been said, Generals are always fighting the last battle; that is, what happened last time.

In line with that thinking is the (YouTube) idea, once we get a ‘collapse’, it will be time to rush in and scoop up ‘assets’ at fire sale prices.

That idea would have worked quite well in ’08 – ’09, which was last time.

On The Brink

Last time, there was no threat of nuclear war.

There was no infrastructure collapse or crop failures and looming world-wide famine (just to name a few).

There was no ‘elephant’ either.

This article, just out, has California front running the elephant with ‘composting’ signed into law a few days ago.

Silver, The Collapse of Demand

It’s not the metal itself that’s the problem. Having some is always a good idea.

It’s the idea of trusting in these ‘things‘ to be one’s savior.

There are larger forces at work that will likely overshadow owning something you can’t eat.

Once again, this just out: World’s largest produce market (Paris) goes up in flames.

At some point, there will be a collective world-wide realization … it’s the food supply.

When that happens, the expectation is, all ‘assets’ will be heavily sold off, including precious metals.

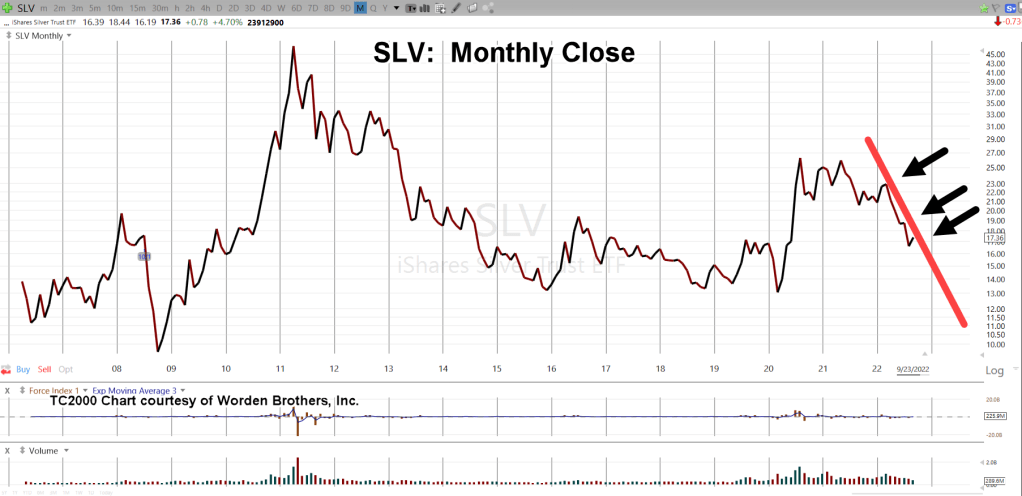
Silver (SLV), Monthly Close

The monthly chart shows the line to watch; the downtrend that started in late March of this year.

If SLV maintains its current rate of decline, it will be April of next year before we get to the support level shown below.

Pushing (and closing) below well-established multi-year support (orange line), is no easy task.

We would likely need to have some sort of catalyst to help price action get to those levels.

Once below support (‘Target Area’), SLV would then be in Wyckoff spring position.

Summary

As always, anything can happen; precious metals could rally starting at the futures open in a couple hours.

Price action itself, is the final arbiter.

Most ‘investors’ are not prepared for a long-sustained siege-grinding rachet lower, possibly to single digits.

If that happens, then will be the time to assess the potential for a significant long-term rally.

Stay Tuned

Charts by StockCharts

Note:  Posts on this site are for education purposes only.  They provide one firm’s insight on the markets.  Not investment advice.  See additional disclaimer here.

The Danger Point®, trade mark: No. 6,505,279

‘Tipping Point’ For Gold ?

“Sentiment Is Negative” … So What?

No sooner had the bearish report on silver been released, than we have a bullish report on gold at ZeroHedge; linked here.

We’re going to address the bullish view briefly but succinctly, with the weekly chart of gold (GLD) below … but first.

When ‘Sentiment’ Works

One little trading nugget that took about 25-years to find out (your mileage may vary), was that in a sustained up or downtrend, sentiment is largely, irrelevant.

In the ZeroHedge report linked above, the ‘little guy’ (i.e. sentiment) is bearish or negative. We all know the little guy is nearly always wrong.

Not to worry.

If gold and silver move decidedly lower from here, our ‘little guy’ will think he’s a genius.

He’ll begin (or continue) to post all kinds of philosophical memes on twitter and Facebook; then set himself up for the big whammy farther down the road. 🙂

The pros will get their money no doubt; they’re patient.

Now, on to the weekly chart for gold (GLD).

Gold (GLD), Weekly Close

We’ve already discussed how penetrating support will put gold (GLD) in Wyckoff spring position.

It’s clear we are there now.

As it says in the chart, support penetration was preceded by a very weak bounce.

The difference between Wyckoff analysis and others is that Wyckoff focuses on what the market’s saying about itself.

At this juncture, price action to the upside (the bounce) is weak; suggesting that momentum remains to lower levels.

The following chart is a zoom of that bounce area.

Summary

This update’s several hours before the 2:00 p.m., EST, Fed announcement … likely to be a non-event, anyway.

Nonetheless, if there’s a significant change in price action, we’ll review it at that time.

Stay Tuned

Charts by StockCharts

Note:  Posts on this site are for education purposes only.  They provide one firm’s insight on the markets.  Not investment advice.  See additional disclaimer here.

The Danger Point®, trade mark: No. 6,505,279

Trading A Silver Collapse: Part 2

No One Expects The Bulls To Fail

How can the bulls fail with all the ‘money printing’ and rampant fiscal irresponsibility?

It’s a sure thing … a slam dunk.

That is, until it’s not.

The day for silver and gold to start a sustained rally, was yesterday.

Yesterday, both GLD and SLV closed slightly higher and left the window open for a follow-on move upward.

It didn’t happen.

However, neither index has posted a new weekly low; that leaves an ever so miniscule chance, price action could mount a rally.

At this juncture, it’s still possible we’re in a move up to the SLV 19.50-area; that appears to be low probability based on the monthly chart of SLV, below.

Trading Vehicles

Other than owning the physical metal (discussed in the last post), the most common trading vehicles are Futures, ETFs and Leveraged ETFs.

Of those vehicles, futures contracts and especially the micro-contracts, are illiquid.

The futures market for silver is thin; that makes getting impaled by a low-liquidity spike a very real possibility.

For the purposes of trading an extended or sharp decline, the vehicles of choice (for my accounts) will be leveraged ETFs (AGQ, ZSL) and the physical.

Follow The Money

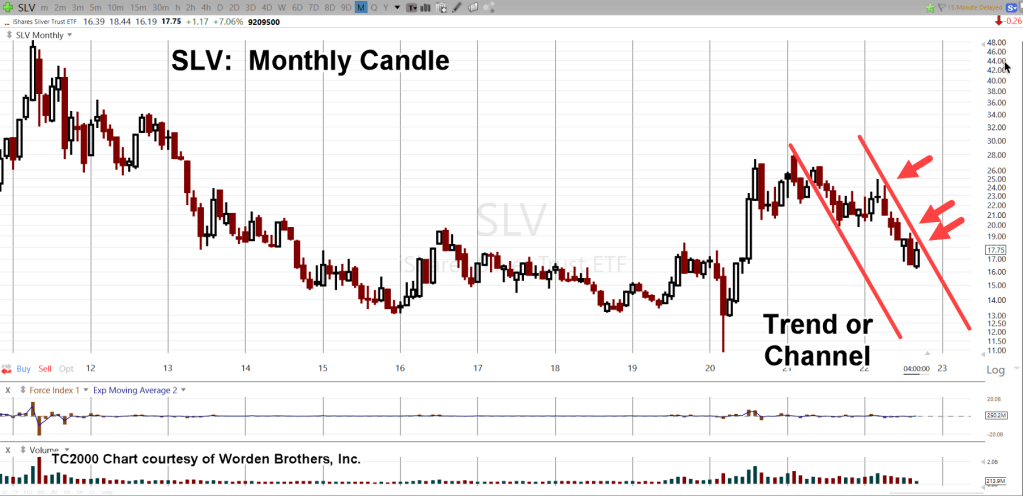
Depending on how you look at the monthly chart of SLV, price action’s either following a down-trend for the past seven months or has been in a trading channel for the past 17-months.

Zoom Chart

Summary & Strategy

It’s generally agreed, having some amount of precious metals is a good idea.

What’s being presented here and potentially on a go-forward basis, is strategy to position for windfall profits (or to acquire physical) during a mass-psychosis event; where it looks like (albeit temporally) precious metals and specifically silver may be of no value.

We’ve already seen over the past two years, how a wide swath of the public can be easily manipulated. Why not manipulate them to think they need (or will be forced) to dump precious metals?

Next Update

We’ll discuss how precious metals could be heading for a sustained or sharp decline, Fed announcement notwithstanding.

Stay Tuned

Charts by StockCharts

Note:  Posts on this site are for education purposes only.  They provide one firm’s insight on the markets.  Not investment advice.  See additional disclaimer here.

The Danger Point®, trade mark: No. 6,505,279
Trading A Silver Collapse

No One Expects The ‘Spanish Inquisition

No one expects the Spanish Inquisition like no one expects a collapse in silver.

From a contrarian standpoint, just because it’s not expected does not in itself, mean it’s going to happen.

However, this site’s been building a strategic premise for years, food supplies come first then precious metals (not advice, not a recommendation).

Here are links that span over two-years; successively building on the case, we’re (potentially) in a ‘Genesis 41‘ situation first more than a Wimar Republic event.

Corn Flattened

“Ten percent of the U.S corn crop was instantly wiped out last week during what’s described as an inland hurricane.”

‘Stacking’ … Strategic Error ?

“As we continue on, it’s becoming clear that single-mindedly stockpiling inedible metal in hopes of surviving what’s here now, and what’s coming, is a major (if not potentially fatal) blunder”.

Putin’s Gold … Paradigm, Not

Gold has never been the same since the Derecho of 2020.

In fact, that was the pivot point for both gold and corn which are now, inversely correlated.”

Corn Train Wreck, Continues

“The food supply is, and is going to be destroyed; one way or another.”

… And This, Just Out

As if to drive that last bullet item home, we have:

Turkey Shortage This Fall? | “Bird Flu”

The ‘Right Side’ of The Trade

Being on the right side of the trade means by definition (nearly) everyone else, is on the wrong side.

The last report said that both silver and gold are at The Danger Point®; The location where risk is least for positioning either long or short (not advice not a recommendation).

Based on prior analysis, the expectation is for a continued decline in the precious metals.

Silver Trading ‘Vehicles’

There are many ways to work the silver market.

Several trading vehicles are silver futures (mini futures), silver ETFs, options on ETFs, leveraged bull and bear ETFs and lastly, the physical metal itself.

As of this date (9/18/22), quotes for a typical bag of ‘junk silver’ are below:

SD Bullion

$100 Face Value Bag: $2,006.44

Apmex

$100 Face Value Bag: $2,064.92

Kitco

$100 Face Value Bag: “Out of stock”

This is not an endorsement. The purpose here is to have ‘place-holder’ quote(s) going forward.

Summary

The post is already lengthy.

Next up on the ‘Silver Collapse’, we’ll discuss the other trading vehicles; futures, options, ETFs and leveraged ETFs.

Stay Tuned

Charts by StockCharts

Note:  Posts on this site are for education purposes only.  They provide one firm’s insight on the markets.  Not investment advice.  See additional disclaimer here.

The Danger Point®, trade mark: No. 6,505,279
Silver … Cue The Hype

What If Europe Abandons ‘Green Energy?’

The ‘Texas Freeze‘ laid bare the farce that is ‘renewable’ energy.

Will this coming winter do the same for Europe?

Like a limpet on an ocean liner, the ‘silver squeeze’ idea won’t go away.

Here we have yet another report; linked here.

The data in the report’s not in dispute. If that data is to be believed (no reason not to), silver stockpiles are shrinking.

Even so, the major trend-change (down) in silver was identified way back in February of 2021; reports are linked here and here.

The second report stated silver had ‘changed hands’ from strong to weak.

It’s been nearly 20 months since then; silver remains below that February 1st, 2021, level and is down -35.7%, as of Friday’s close.

I like silver as much as the next guy but what we’re discussing here, is strategy.

Silver To Single Digits?

Is that even possible?

Well, was oil going negative possible?

Not until it happened.

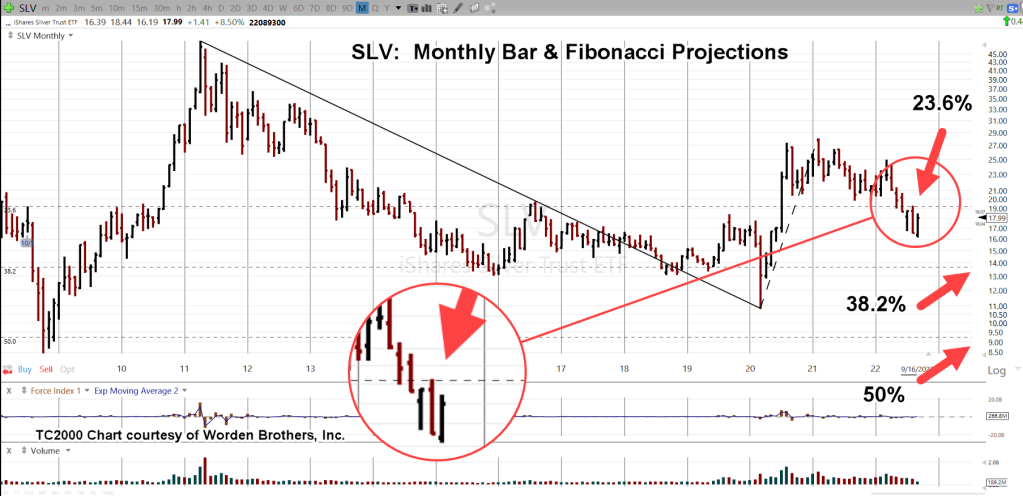
The monthly chart of SLV below, has a standard Fibonacci projection shown. Note how at 23.6%, the projection shows price action tapped and reversed down.

Next up is 38.2% at around 13.75, and then 50%, below the 10-area.

Silver SLV, Monthly Chart

Zoom version

And then, a trading channel.

Both silver and gold, are at The Danger Point.

Gold has pushed below support and is currently in Wyckoff spring position.

Silver is below the 20-area, which is established support.

If a rally is in the cards, this is the place to start.

A failure to move decisively higher at this point signals the potential for much lower prices ahead.

Summary

The next update will discuss various tactics that could be used if/when there’s a major downdraft.

Stay Tuned

Charts by StockCharts

Note:  Posts on this site are for education purposes only.  They provide one firm’s insight on the markets.  Not investment advice.  See additional disclaimer here.

The Danger Point®, trade mark: No. 6,505,279
GDX, Down 5-Months, & Counting

Way Back, To 2012

We have to go all the way back nearly ten-years, to find five consecutive down-months.

The bear market in the miners GDX, and GDXJ, is not any news to those accessing (or following) this site over the long-haul.

Nearly two years ago, this report pegged the bear market before it was even a blip in anyone else’s pineal gland. 🙂

That fact’s proven-out by the listing of no fewer than ten links to other analyst’s super-bullish posts on gold and gold miners.

It’s safe to say at that time, everybody else was pointed in one (bullish) direction.

So, what’s happened to GDX (and GDXJ) since that October 25th, 2020, report?

GDX, is down approximately – 38.2%, and GDXJ, has declined – 47.6%.

Not exactly a bull market.

Senior Miners, GDX, Monthly Bar

Looking at the chart, it’s obvious; the prior ‘five-months’, distance traveled, was much less than our current situation.

Add to that, there’s no real support until lower levels. The decline’s free to continue, unabated.

Summary

This site’s primary focus is strategy. The longer term, the better.

Including the October 25th, 2020, report on the gold miners, we’re coming up on several other significant two-year anniversaries:

Bitcoin to Replace Gold?

Dollar Reversal; Ready

Corn Goes Vertical

Let’s not forget, ‘The Speck’, as we call it, was identified as a hoax well over two years ago; documented with this post.

The intuitive assessment of only partial data (at best) was, and probably will remain, the most important post of all.

Stay Tuned

Charts by StockCharts

Note:  Posts on this site are for education purposes only.  They provide one firm’s insight on the markets.  Not investment advice.  See additional disclaimer here.

The Danger Point®, trade mark: No. 6,505,279

Silver’s Bull-Fight

Wedge Breakdown, Imminent?

Like a stubborn mule, silver’s just not going along with the ‘hyperinflation’ narrative.

How many years of mainstream ‘breakout’ forecasts, has it been?

‘Silver upside breakout just around the corner’. ‘Silver to launch higher because of inflation’. ‘Silver physical shortage to expose futures manipulation’ … and on.

It’s not happening. Why?

Silver, more so than gold, is an industrial metal. In that sense, more like copper than gold.

That said, silver’s price action alone, tells us (along with copper) we’re in an imploding economy.

Before we get to the charts, let’s review what was said at the last update on silver (emphasis added):

“Since gold (GLD) is in position for an upward test of its wedge breakdown (chart not shown), it’s reasonable to expect another bounce off support for silver.

Using the ‘rule of alternation’, we already had a brief move off the first support level before reversing.

The next contact at lower support, will likely bounce for longer or not at all.

Well, ‘bounce for longer’, is exactly what we got.

The prior bounce from low to high lasted 11-trading days (5/13/22 – 5/27/22). The current bounce lasted nearly twice as long; 20-trading days.

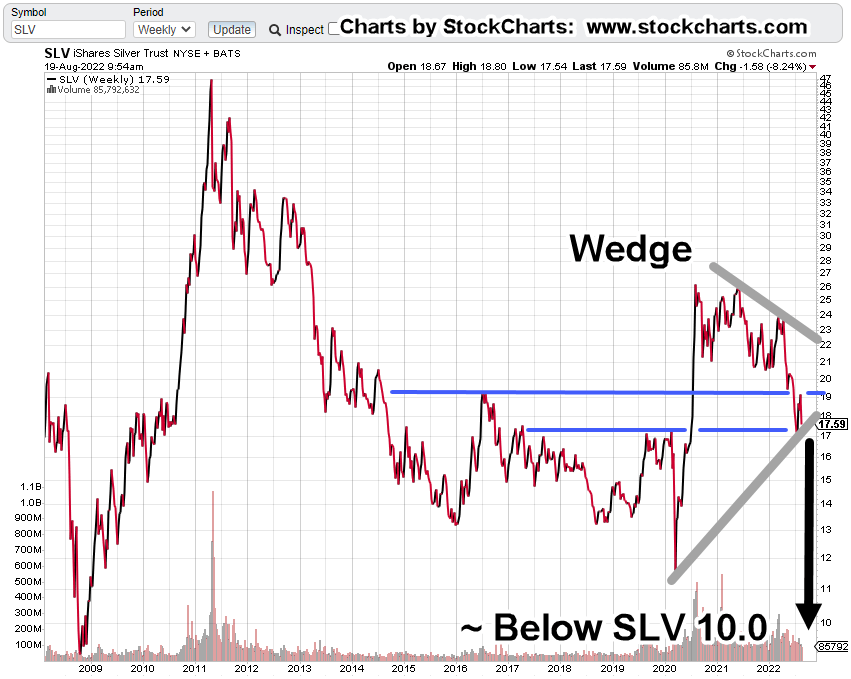
Silver (SLV), Weekly Close

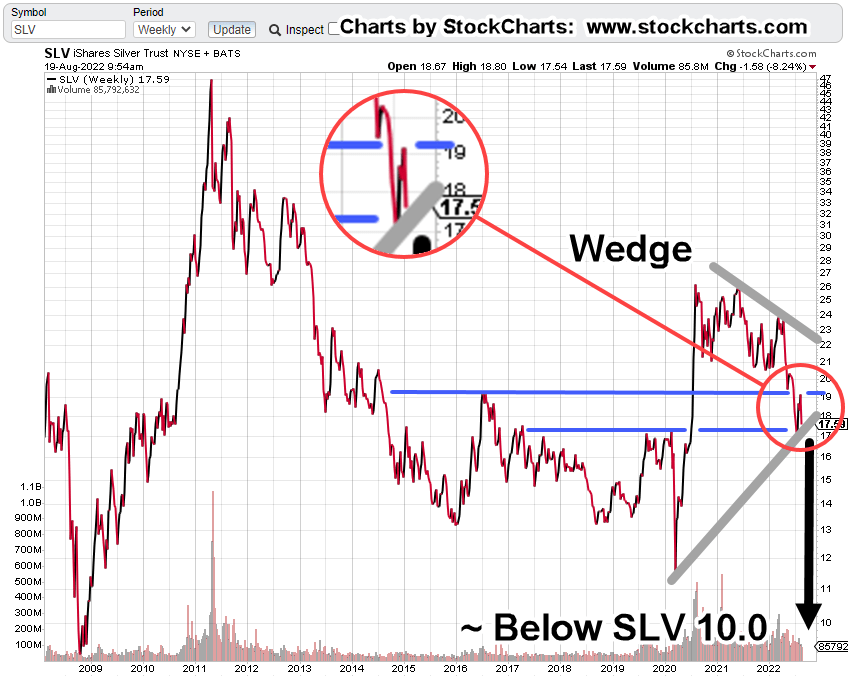
Since the last update, price action bounced off support, confirmed the wedge, tested upside resistance and now, back down to the wedge boundary.

The zoom chart below shows the detail of the resistance test and reversal.

If SLV posts a decisive break below the wedge boundary, standard traditional charting technique provides a downside target in the vicinity of SLV 10.0, or slightly below.

Summary

As always, anything can happen. If silver decides to start posting bullish action, the analysis will be changed.

At this point, with growing fundamentals of economic collapse, i.e., Great Depression 2.0, silver’s price action is fighting the bulls (and winning), thus, confirming the economic decline (not advice not a recommendation).

Stay Tuned

Charts by StockCharts

Note:  Posts on this site are for education purposes only.  They provide one firm’s insight on the markets.  Not investment advice.  See additional disclaimer here.

The Danger Point®, trade mark: No. 6,505,279