Note: Posts on this site are for education purposes only. They provide one firm’s insight on the markets. Not investment advice. See additional disclaimer here.
If there’s any one interview that details what’s really going on, it’s this, link here.
The 48-mintue Kitco session with Bert Dohmen, is much needed straight talk.
It’s all there:
Official data is fake. Markets will (likely) ‘trap’ bulls with massive gap-down. It’s 1929 (again). Crypto is an illusion. Silver/Gold will correct (temporarily) along with the markets. We’re surrounded by bought off media. The population (masses) don’t think or can’t think.
Adding to that are ideas and sources discussed for years on this site, like ShadowStats having ‘real’ data on unemployment and inflation.
The list goes on.
With all that said, let’s look at one of the sectors (retail brokers), that could be hit hard during a surprise downturn.
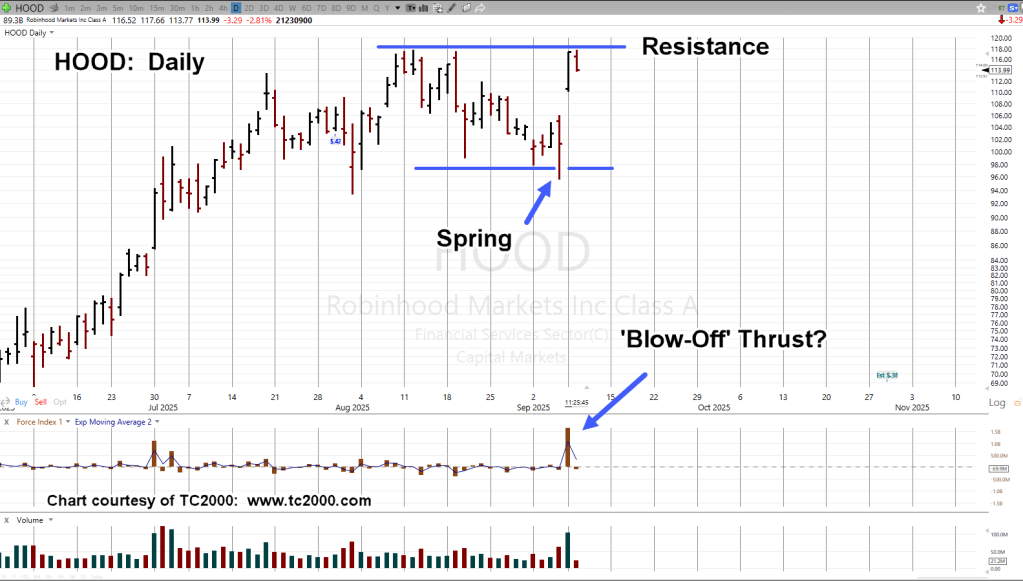
Robinhood HOOD, Daily
It’s important to note, price action late Friday, began to pull away from the lows … rising into the close.
Just after that close, the announcement, HOOD made it to the S&P.
Wyckoff said a century ago:
‘Somebody always knows something. That ‘something’ shows up on the tape’
Well, there it is.
Was yesterday (the start of) a blow-off?
Froce Index (thrust) was the largest since the IPO, trading on August 4th, of 2021.
Price action is currently (as of 11:58 a.m., EST) retreating off the highs.
Note: Posts on this site are for education purposes only. They provide one firm’s insight on the markets. Not investment advice. See additional disclaimer here.
So, here we are nearly on the eve of the most significant reversal, ever:
September 3rd, 1929
That is, maybe, until now.
Today’s downside action may turn out to be just a blip; much ado about nothing.
Or it could be the harbinger of a top. Maybe the top (not advice, not a recommendation).
Biotech sector XBI, appears to be losing steam while at the same time, being in up-thrust (potential false breakout) condition.
As of this post (12:10 p.m., EST), XBI is down -0.63%, and has posted a new daily low. Short position XBI-25-03, remains active (not advice, not a recommendation).
We’ll discuss this index and others over the long weekend.
Note: Posts on this site are for education purposes only. They provide one firm’s insight on the markets. Not investment advice. See additional disclaimer here.
Remember, markets typically move in the opposite direction first after the Fed, then resume their main trend.
On Friday, markets were generally higher on interest rate hopes. It’s called ‘hope’, as the Fed’s not actually done anything.
Let’s word that more accurately. The bond market has not (yet) told the Fed to lower rates. When it does (if it does), they will follow and present their case as if they are leading the market.
Decades ago, Robert Prechter Jr., in a research paper, proved this point. More recently, Ed Dowd repeats the fact, link here (time stamp: 37:48).
Markets were higher, including the SOXX, covered here, and in this update, airline sector Delta (DAL).
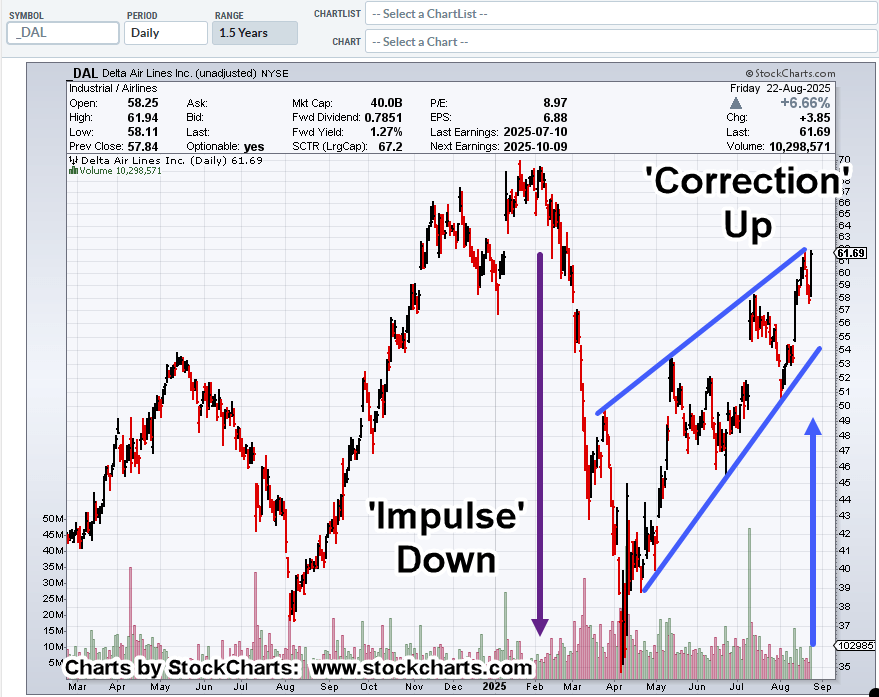
Delta Airlines, DAL, Daily
If there’s any one chart showing why this site primarily works the short side, this is it.
The last major move was an impulse downward, taking less than three-months.
The corrective move against the trend, has so far been nearly five months in choppy overlapping action.
DAL, finished on Friday at the Fibonacci 78.6%, retrace level (not shown). Unless the market decides otherwise, we’re in a terminating wedge.
Currently short DAL, as DAL-25-03, with stop just above Friday’s high (not advice, not a recommendation).
Weekend Wait
Now, the worrying starts … we can almost write the mainstream media script for the next few days.
Why will the Fed need to lower rates? Is unemployment going to continue higher? What about all the mass layoffs? How will the consumer be affected … and on and on.
As a reminder, ‘alternate’ (real) unemployment numbers are here. We’re already at 25%, Depression era levels.
Note: Posts on this site are for education purposes only. They provide one firm’s insight on the markets. Not investment advice. See additional disclaimer here.
It says, we’re already at ‘depression era’ levels of 25% unemployment.
If anyone’s skeptical of alternate numbers, the official numbers have already been proven to be ‘in-question’.
One of the best examples of ‘official’ data, or lack thereof, is this report.
What’s a million jobs or so, between friends. 🙂
With mass layoffs starting, also, here and here, that 25% number above, is likely to increase significantly.
We can even add some anecdotal evidence, link here.
Strategy, Tactics, Focus
The price action of the market itself, is telling us where to go for opportunity.
Upside may still be there, if one wants to position in the A.I. bubble (not advice, not a recommendation).
However, for over eighteen months, this site’s been profitable only positioning to the short-side (UNG, the exception) and sees no reason to join the crowd buying into the A.I. mania (not advice not a recommendation).
The current focus is on WMT, a sleeper, not-doing-much, for years, that may be about to get interesting.
Currently short as WMT-25-03, with stop at last week’s high (not advice, not a recommendation).
Note: Posts on this site are for education purposes only. They provide one firm’s insight on the markets. Not investment advice. See additional disclaimer here.
Note: Posts on this site are for education purposes only. They provide one firm’s insight on the markets. Not investment advice. See additional disclaimer here.
Market reversals tend to occur just before, during, or just after a holiday week.
Is that where we are now?
Semiconductors (SOXX), and it’s chief cook and bottle washer, Artificial Intelligence (NVDA), may have already decided the next direction … down.
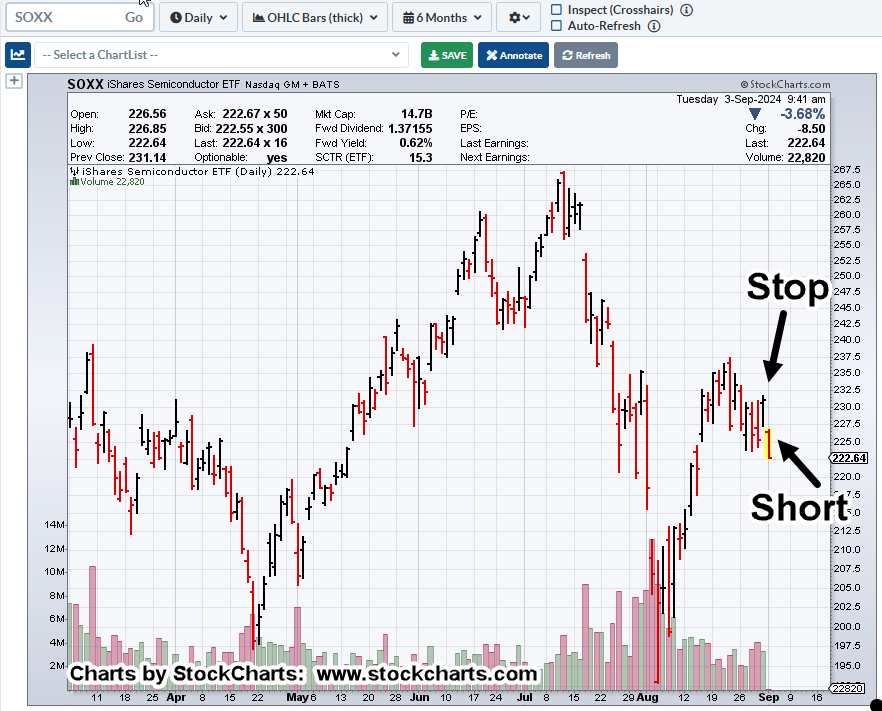
Semiconductors, SOXX, Daily
It’s just after the open and this is where we are.
“What do you see?”
Marking up the chart, we have a sell-short indicator (not advice, not a recommendation) right along with a hard stop location (as shown).
From yesterday’s update, those that watched the presentation by Robert Prechter Jr., were challenged with the idea, we’re in the largest bubble ever or at least since the 1720s South Sea Bubble (not advice, not a recommendation).
Positioning
In the sidebar, we can already see a short position was opened during last Friday’s session: SOXS-24-15 (not advice, not a recommendation).
Everyone has their own style and for me, I detest ‘chasing’ the market.
I’d rather make several attempts, get stopped out, then enter again, than watch the opportunity take off because I was too afraid to pull the trigger.
It’s only 20-minutes after the open and we can see the SOXX, is down hard.
Note: Posts on this site are for education purposes only. They provide one firm’s insight on the markets. Not investment advice. See additional disclaimer here.
Best Buy’s breaking a trendline that’s been in effect since December 1991.
The weekly chart (below) has zoomed-in to the last 13-years or so, showing the magnitude of the breakdown.
While the financial press plies their trade, this just out as the latest effort to confuse whoever is still listening, anyone with two BBY gift-cards rubbing together feels in their gut, we’ve gone straight past ‘recession’ and into ‘depression‘ (not advice, not a recommendation).
The chart of BBY, itself, is telling us there’s been a (potential) massive change of direction.
Best Buy (BBY), Weekly Close
The lower dashed trend-line continues all the way back to December 1991.
The wedge ‘throw-over’ lasted an incredible Fibonacci 21-months, from July of 2020 to the ‘test’ in March of 2022.
Lower price action confirmed that reversal and now, we’re breaking down from the 32-year long formation.
Positioning
From a personal standpoint, I have no plans to short BBY at this time.
However, BBY price action can, and is being used as confirmation to remain short (of not stopped out) via the biotech trade LABD-23-11 (not advice, not a recommendation).
Note: Posts on this site are for education purposes only. They provide one firm’s insight on the markets. Not investment advice. See additional disclaimer here.
The prior analysis of biotech SPBIO, had expectations for price action to rise into the 6,400 area: the location of the 200-Day Moving Average.
It did that, and more …
Back in late April, SPBIO, was in a Fibonacci time sequence. Shown below, that time structure may still be intact.
But First … The List
Note: This is not “The List“, as has been compiled (still on-going), covering the horrors of this sector but rather a list of reasons why SPBIO, is likely to head lower from here.
Here it is, not in any particular order:
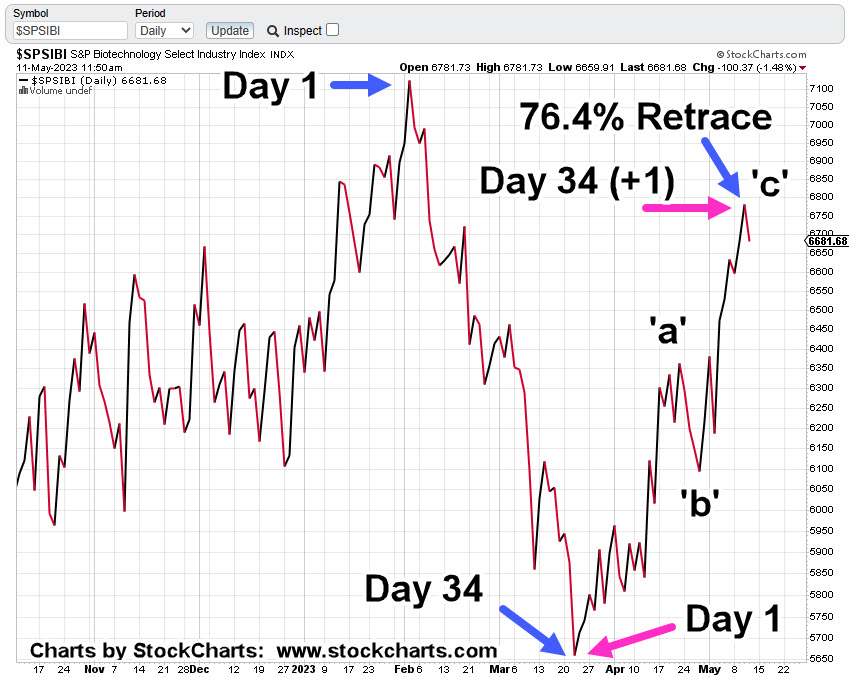
Price action has reached a Fibonacci 76.4%, level
From the March 24th low, price action has retraced upward in an ‘a-b-c’ corrective move, with wave ‘a’ distance equal to wave ‘c’. Note: Equal distance ‘a’ and ‘c’, on a print basis.
At the last session, as the action pushed to a new daily high, there was ‘evidence of a struggle’ during the session to either reverse lower or move higher. Action was undecided and closed slightly below the open.
Looking at the first chart below, the daily close for the past three-years has the trend decidedly down; this sector is the weakest of all the major indices.
On the chart below, there’s a series of lower highs, lower lows that have oscillated into a massive bearish wedge.
Yesterday (Wednesday) was a Fibonacci 34 days (-1), from the print lows set on March 24th. That day was also a Fibonacci 34 days (+1), from the closing low set on March 22nd. We’re still posting a Fibonacci Time correlation.
From the highs set on February 2nd, to the lows on March 24th and then to the highs set yesterday May 10th, is symmetrical; separated by a Fibonacci 8-weeks lower and then Fibonacci 8-weeks higher.
Fundamentally, this sector is a disaster. None of the top ten equities have a P/E. All are losing money.
No P/E and operating at a loss; interest rates rising, credit standards being tightened. How are these outfits going to secure more Venture Capital (or any additional funding via stock/debt) in that environment; implosion is dead-ahead (not advice, not a recommendation).
Bank failures continue … at some point (as with the rest of us) one of these banks may be the line of credit for company payroll. Not all banks went bust in The Great Depression but just enough to halt payroll for some key industries. That event helped topple the economy.
The list goes on but that’s enough to make the point.
Now, on to the charts.
Biotech SPBIO, Daily Close
Moving closer in, to show the Fibonacci retrace, the Fibonacci time and the ‘a-b-c’ structure.
As of this post (12:25 p.m., EST) price action continues its downside reversal.
Because the retrace level (76.4%) is the highest noted by Fibonacci, we can expect some amount of upward testing if there’s going to be a sustained downside.
Anything can happen. However, with the above list compiled for both technical and fundamental conditions, probabilities point lower (not advice, not a recommendation).
Note: Posts on this site are for education purposes only. They provide one firm’s insight on the markets. Not investment advice. See additional disclaimer here.
Unbeknownst to many, we’re witnessing a once-in-a-century opportunity and public service.
Those from the era of The Great Depression, are all gone now.
So, the same playbook can be run without anyone (alive) knowing we’ve been here before.
The public service presented to us, the massive on-going exposure of the financial charlatans and grifters.
You can be ‘certified’ and still be a certified (market) dolt.
Neil McCoy-Ward, points this out in his recent update linked here. Go to time stamp 8:40;
“Clueless” … “Completely Asleep”
Anyone who’s worked in the corporate world (in any sector), especially now, knows it’s near impossible to think or act independently.
So, it is with gold.
Gold & The Grifter Bandwagon
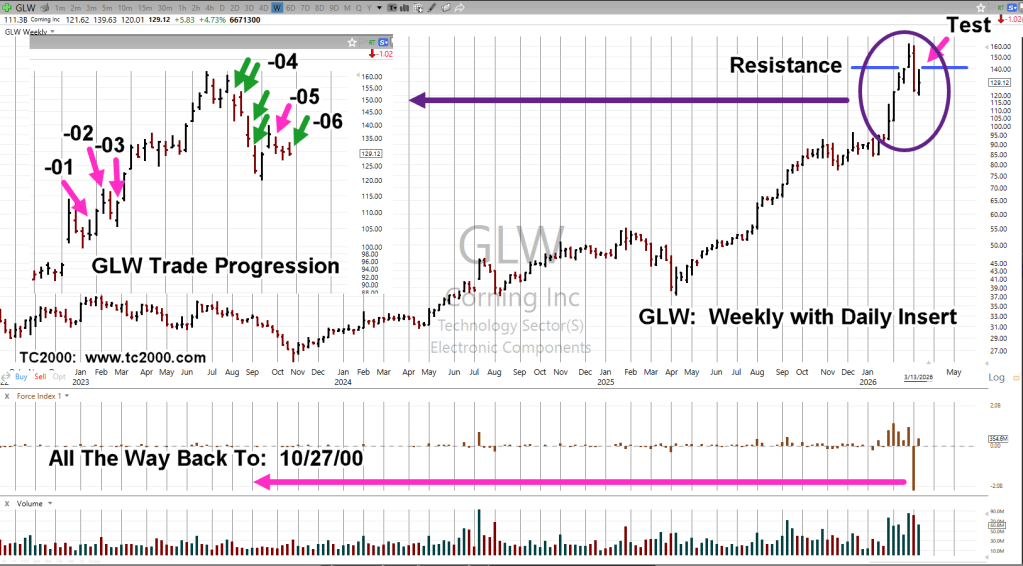
Where was everybody back in 2001, when gold was bottoming in the area of $270/oz., after a multi-decades long bear market (from 1980)?
The fact we have nothing but breathless panic from grifters and hangers-on, about rampant inflation should at least give one pause, we could be at a temporary or major reversal (not advice, not a recommendation).
At least with the analysis below, there’s a decision point that will let us know if we’re due for another leg higher, or if there’s a Sovereign debt crisis about to break that would kick-off massive selling of all assets including gold.
Gold GLD, Weekly
As the title says, we’ve got something akin to a ‘Maginot Line’ for gold. What looks like insurmountable resistance that could still be breached … but for now, is holding.
With each (manufactured) crisis, gold’s momentum in the form of price and volume, is declining.
From a Wyckoff analysis standpoint, the bulls (for now) are running out of steam.
The ‘terminating wedge’ in gold’s price action has already been discussed, link here.
Looking at the action in another light, we see a Wyckoff Up-Thrust in the works. Price action has penetrated a previous high and is currently struggling.
If gold (GLD) is able to significantly penetrate the resistance and hold, then we’re likely on to the hysterical predictions of the masses.
If not, and we get a reversal, it’s going to be big surprise for many. They’ll be stunned, unable to move and eventually provide more fuel for the downside as they sell in panic.
Downside Drivers
What could possibly be a downside driver for gold?
One has already been mentioned, a Sovereign debt crisis. It’s a likely event considering the record-pace rise for interest rates and subsequent bank failures.
Another is an ‘executive’ decision that gold ownership is outlawed. It’s happened in the past and those who got through that event are no longer with us.
Moving on, we’ve already been told there will be a ‘cyber-attack’.
What’s going to happen to gold, when there’s no electricity, fuel or food shipments?
As survivalist author Ron Foster says, in this interview, (time stamp 27:20), during a grid-down situation, he’s not giving up his food. He says, during such an event, precious metals are “meaningless”.
Note: Posts on this site are for education purposes only. They provide one firm’s insight on the markets. Not investment advice. See additional disclaimer here.