Inflation, Off The Chart ?

Or … Massive Supply Restriction

Use the miss-information and propaganda to your advantage.

The following items are just a partial list of recent inflation, so-called ‘news’.

$3,000 Gold Imminent

Gold & Dollar Soar, CPI Surge

Consumer Prices Soaring …

Gold & Crypto Surge

Transitory” Debate Is Over

That last one … is that like “The science is settled”?

To be fair, there is some truth in the articles. Prices are indeed rising. All types of costs are going up like food, gasoline and on.

Supply Restriction:

Here’s a strange bit of information from an unlikely source.

It turns out that copper (mining) supplies are being restricted in Minnesota. Go to time stamp 2:52, at this link and listen to the next 30-seconds.

Sure, it’s a data point of one but then again, what about all the talk of shutting down sources of oil production?

On it goes. This is supply restriction, not inflation.

It depends on what the definition of ‘inflation’ is.

Here we have one of the usual suspects parroting the now-accepted (but likely incorrect) definition of inflation. Go to time stamp 1:23.

I’m sticking with Robert Prechter Jr.’s definition of inflation and that is: Expansion of credit that causes increased spending that in turn causes demand to rise and then prices rise in turn.

Do we have expansion of credit now … or the destruction (or, soon to be) of credit? That’s called deflation.

Dollar … Still Not Dead

The dollar of course, is the wild-card.

Everybody’s expecting a collapse but darned if that’s just not happening. Actually, the opposite is taking place.

Now, all of a sudden it’s a “Contrarian Trade”. You can’t make this stuff up.

We’re coming up on the one-year anniversary of this post.

It postulated there was potential for a significant, medium-to-long term reversal in the dollar.

Getting The Picture

In a way, the dollar post and subsequent ZeroHedge one-year-later recognition of the obvious, define what this site’s all about.

As stated in the ‘About’ section, not every analysis works out. To borrow a quote from David Weis, ‘Sometimes I’m 100% wrong’.

Presented here are analysis, actions, course changes, attempting to maneuver through the largest economic and population collapse in world history.

The main focus is not to increase followership … although that is happening.

As the follower numbers increase, it’s a good sign that more are becoming aware of how manipulated and controlled is the entire narrative.

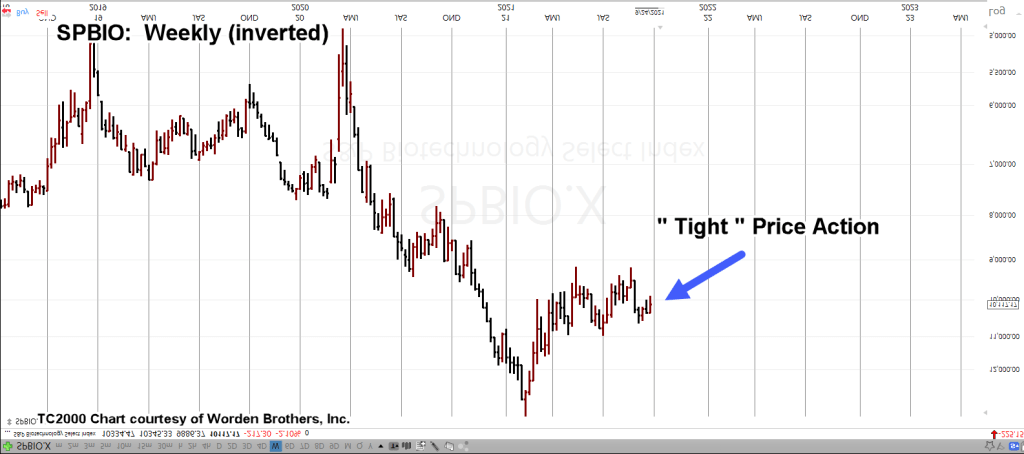
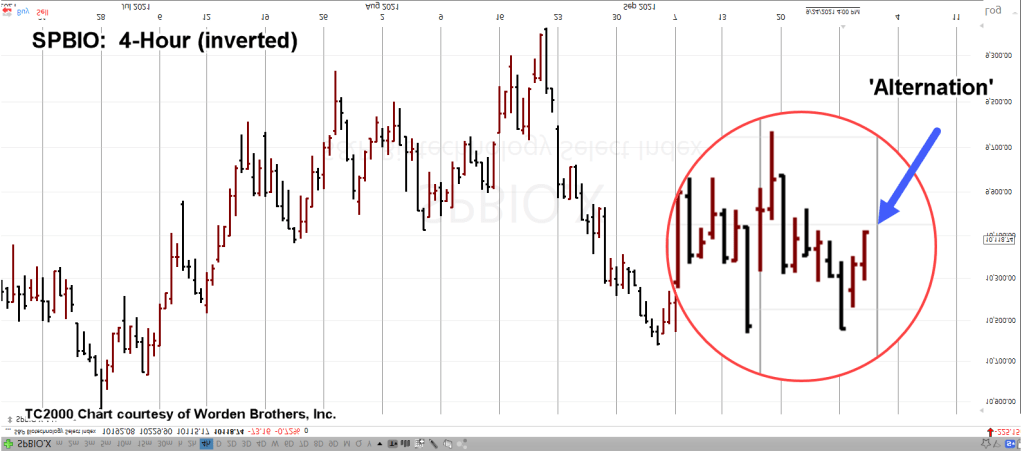
One way to separate from the effect of the falsehoods, is to become proficient at reading price action. As David Weis used to say, ‘What’s the market saying about itself?’

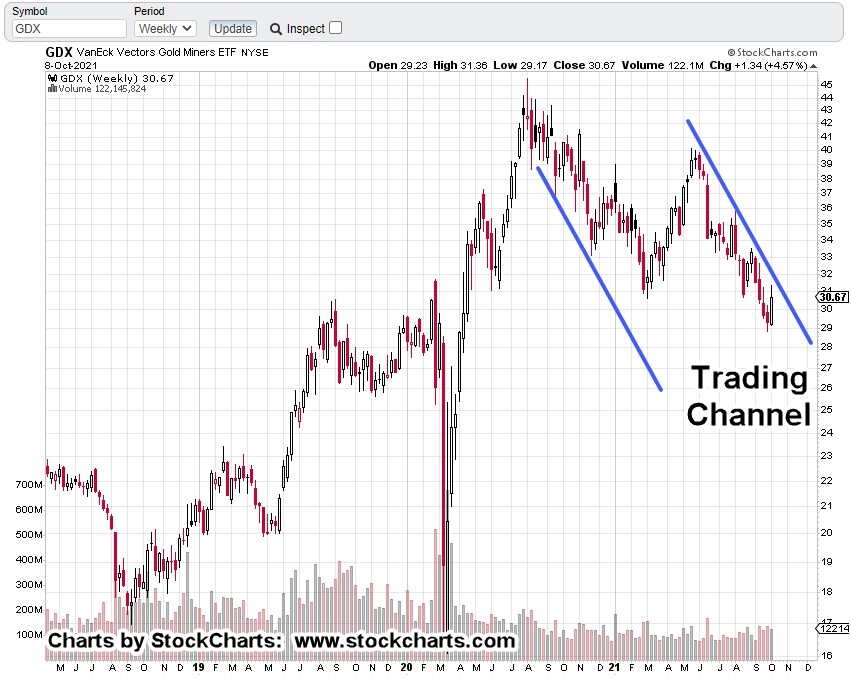
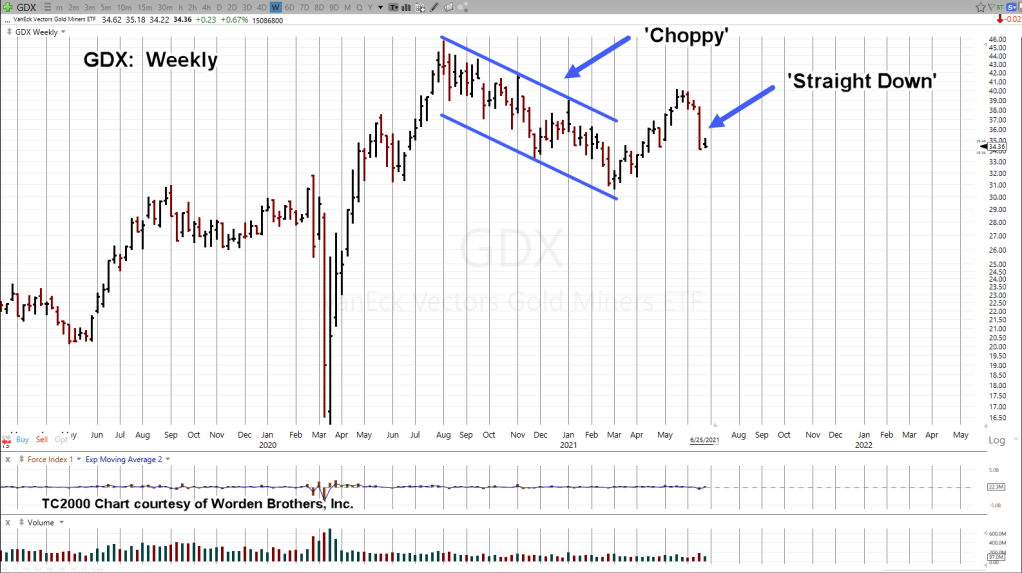
Which brings us to the current juncture. Gold

Gold, At A Crossroads ?

The current assessment of gold (i.e. bearish or reversal potential) is similar to the dollar from a year ago.

Different from the dollar, are the momentum (MACD, etc.) indicators … which are currently pointing higher.

In the dollar, there was a bullish weekly MACD divergence helping us along.

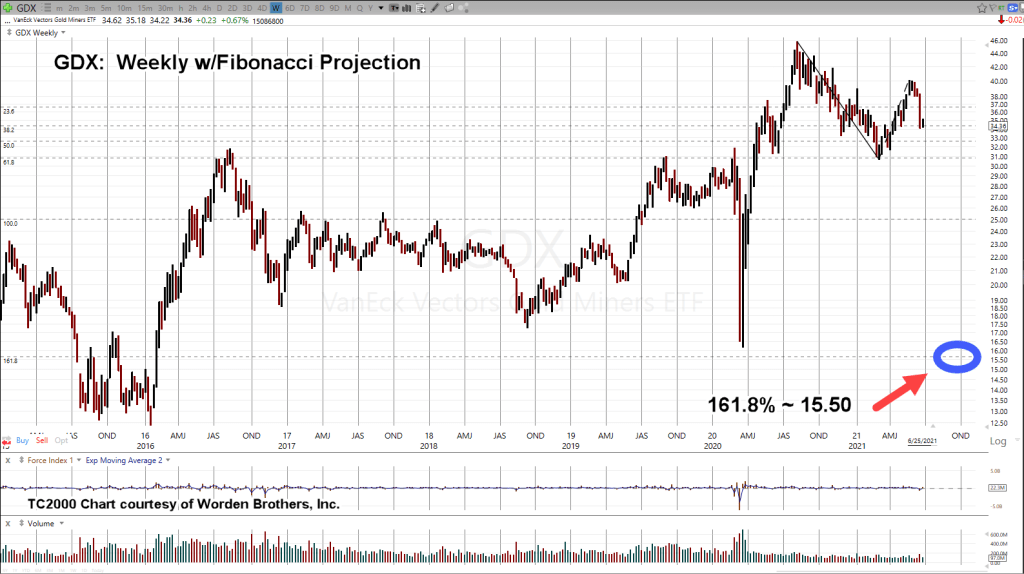
Not so with gold (GLD).

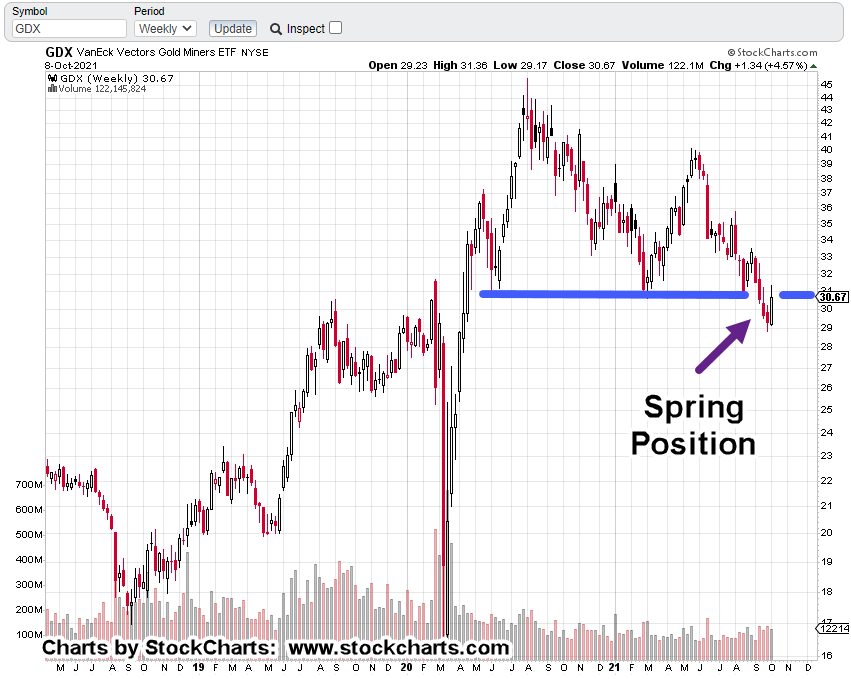
What we do have, and what the linked list above provides, is a look into a type of mass hysteria.

The ‘pegging the meter‘ article that came out late Friday caused only a blip higher in GLD and GDX.

If we’re at max persistent inflation already, is there any more upside left?

Stay Tuned

Note:  Posts on this site are for education purposes only.  They provide one firm’s insight on the markets.  Not investment advice.  See additional disclaimer here.

The Danger Point®, trade mark: No. 6,505,279

Random Notes

The Usual Suspects For The Week

No. 1

Bye, Bye, Bullpen

It looks like the word ‘bullpen‘ is inappropriate … to someone at least.

Just when you think it couldn’t get any more stupid … it all goes to the next level.

Jerimiah Babe may have the right attitude.

With so many unprepared and focused on the wrong things (like the name of a baseball warm-up area), when the bottom drops out, there’re going to be once in a lifetime investment opportunities.

No. 2

Gold To Soar … Yet Again

Looks like the boys (and girls) at Kitco are back at it again. Gold is going up for sure this time … honest.

At time stamp 15:08, the female interviewer really puts the screws to her guest.

She does not believe a word he’s saying … so, there’s that.

Meanwhile, back at the ranch, the confiscators may be gearing up for another 1930s style Executive Order.

It probably won’t matter either way.

If you have to show your ‘papers’ to sell gold at the local bullion dealer, what’s the point of owning it?

No. 3

Escape From New York

Come this Monday, we’re going to see what happens when approximately 25% of a major city’s police, fire and healthcare employees don’t show up for work.

Time to take notes.

No. 4

Drinking Beer Outside The Liquor Store

Looks likes it’s just a normal thing if you’re in the Ukraine (time stamp 15:08)

No. 5

In a Knife Fight … No Rules !!!

There are no rules anymore. Bullet item No. 6, below shows the confiscation plans are moving forward.

As a caveat, the financial services industry. i.e. ‘wealth management’, is operating with a paradigm that no longer exists.

One of the objectives of this site, is to offer an alternative to the group-think of wealth managers.

Certification presents itself as an authority figure … just like Fox News presents itself as the alternative.

In fact, those in control own both sides of the narrative.

Does anyone really think FINRA (Financial Industry Regulatory Authority) is going to allow a wealth manager to make his clients overtly wealthy?

Even if that manager knew what to do, he’s hamstrung by regulations like ‘Fiduciary Responsibility‘; effectively guaranteeing the person with the least amount of knowledge (i.e., the client) is in control.

No. 6

Confiscate The IRA/401K

A topic that has been discussed literally for years by my firm, is confiscation of retirement accounts.

The following is a cut-and-paste from this link which is password protected:

Note the date.

Written over two years ago.

_______________________________________________________

4/7/19

Government To Confiscate IRAs?  It’s Easy.

There has been enough time for the American working (and saving) public to take the lessons of the 2007- 2009 meltdown and act accordingly.

One of those lessons would have been to realize just how close they came to having their IRAs confiscated.

Personally, I’m surprised that any of the following links below are still active.  Well, who’s looking at this stuff anyway?  Certainly, not the general public:

Dems Target

Fact Check

Congress considering

Government to Confiscate

Confiscation of Private Retirement

Even in the Wall St. Journal:  Targeting your 401K

After reading several of these reports in 2009 and later, it did not take long for me to set the plan in motion to cash out … completely.  I took the 10% penalty, while it’s still 10% and liquidated my accounts (not advice, not a recommendation).

The rest of the population?  Not so much.

I think it was Prechter who laid out just how easy it is for the government to seize IRA accounts.  It’s basically a two step process.

Step 1. 

The market drops 50% to 70%.  Remember, the drop from 2007 to the bottom in 2009 was 58%.

Step 2.

Declare a state of emergency (executive order) for the working population and move in to “save” the IRA accounts from more devastation.  

The result would involve a stiff withdrawal penalty (say 50%) and to “protect” the accounts from further losses, IRAs can only invest in U.S. Treasuries or Bonds.

______________________________________________________

End of cut-and-paste

The scenario may not happen exactly as detailed above. The Stew Peters link (repeated here) shows there are several ways to access the IRA accounts (not advice, not a recommendation).

Stay Tuned

Note:  Posts on this site are for education purposes only.  They provide one firm’s insight on the markets.  Not investment advice.  See additional disclaimer here.

The Danger Point®, trade mark: No. 6,505,279


Random Notes

The Usual Suspects For The Week

No. 1

Hawking Gold

Back in the day, these people were run out of town.

Scrolling down to the comments (if they have not been deleted), some are starting to catch on.

No 2

Dark Winter

Stumbled on this Dark Winter link while scrolling through comments on the Northwest ‘bomb cyclone’.

Simulated scenarios for biological weapons release.

Video is from 2015:

Problem, reaction, solution.

Time stamp 2:50 is especially telling.

No. 3

Iraqveteran8888

What does it mean?

This link contains the answer.

No 4

Inflation, Not

Well, here we go again. The current ‘inflation’ is NOT the destruction of the dollar.

What are the ‘inflationists’ going to say if/when gold has a major break to the downside as detailed below in No. 5.

“It’s all rigged !”

Line No. 6, shows us what’s it’s really all about … destruction of survival: food, tools, parts, consumables.

No 5

Gold Forecast: Look Familiar???

Just found this link

First presented here at this link … over a month ago.

Latest update is here.

No. 6

Voyage To The Bottom Of The Sea

The next chess move.

First, it’s the containers being sent to the bottom.

Are the ships next?

No 7

Destruction of the ‘Wealth Management Firms’

Robert Prechter said it years (if not decades) ago; the next mega bear market is going to destroy the ‘wealth management’ industry.

Some entities are not even waiting for the bear market.

They’re getting out in front. Sort of being the leader … if leading anything is even possible for a corporation.

This is the latest round in self-induced annihilation

Stay Tuned

Note:  Posts on this site are for education purposes only.  They provide one firm’s insight on the markets.  Not investment advice.  See additional disclaimer here.

The Danger Point®, trade mark: No. 6,505,279

It’s Your Fault !

‘You’re The Problem’

Here’s one guy that finally figured out gold’s not moving higher as expected (as he has been touting) in anticipation of ‘rampant’ inflation.

As a reminder, this site stated from the outset, there’s little-to-no inflation.

Prices going up are the result, in large part from the intentional destruction of the supply chain.

Why that’s happening is a topic for another time. One clue is, if you’re starving, you’ll do whatever you’re told.

However, let’s not digress.

So, what’s the reason gold (and silver) are not moving higher? Well, that’s easy:

It’s because of you!

Yes, you the ‘investor’ are the problem. You are the reason that gold and the mining stocks are not moving higher.

You can’t make this stuff up.

Since he (Schiff) ‘put it out there’, his reasons are fair game for discussion.

Performing A Public Service:

In a way, the linked article is a fantastic public service.

Just like the biotech sector intentionally euthanizing (a polite word for what’s really happening) its customer base, here we have another entity calling out its own followers as the problem.

It’s similar to the rabid, mindless, one-way (only goes up) gold bulls crying ‘it’s all rigged’, when their pathetic attempts at analysis don’t work out; we now have another entity citing YOU as the problem when the forecasts fall flat.

This is yet another so-called financial source that can be permanently crossed off the watch list.

Brutal, But Beneficial:

Admittedly, the ‘tone’ of the posts on this site are not for everyone.

Even mild-mannered Dan at I Allegedly, finds himself responding to snowflakes that complain about his ‘get ready’ posts.

There’s good reason why the average are so ignorant.

For those who were actually listening in middle-school, the history books conveniently leave out the part where millions of Americans died of starvation during the Great Depression.

No pictures of emaciated bodies. Nothing.

With what’s coming, we’re likely headed for mass casualties in one form or another. The financial community refuses (from what I’ve seen) to discuss this up-coming event.

For example:

If you’re still using a ‘financial advisor’ and they’re not talking about, or don’t know about the elephant, do you really want to be (paying for and) taking direction from someone who’s that lazy, fearful, or ignorant?

Prechter, said it himself when he stated, the next mega bear market’s going to wipe out the ‘wealth management’ industry.

We may be on the cusp of that now.

Not Advice:

With that said, this site does not, and will not give financial advice.

Each person has his (her) own situation in life. You are the one to decide on your next direction or action.

What this site does do, is attempt to provide analysis and supporting price action data on what’s really going on.

What’s the market saying about itself?

If you’re still reading, that was a very long intro to get to our topic for the day: Gold miners, GDX.

Wyckoff Analysis: Senior Miners, GDX

What we see from the weekly chart is straightforward.

GDX, has been channeling lower for about a year:

The next chart shows we’ve penetrated support and are now testing the underside.

Of note: GDX is in ‘spring’ position. An upward attempt is to be expected.

If GDX was to break out and start a sustained bull move, this would be the spot. We’re at the danger point.

In my view, the participants in this sector are borderline delusional, if not completely insane.

They disregard what the market’s actually doing; holding to a (so far, for years now) unverified belief that ‘$10,000/oz gold, is just around the corner.’

It could very well be … but only after the (possibly, soon to be) starving stackers have sold off their hoard to buy food.

One has to wrap their mind around the fact, we’re being subjected to a long term diabolical plan.

Thinking and acting with that long game in mind (in my view) provides at least a hope for not only survival, but positioning to prosper during the on-going collapse.

Lastly, here’s a link to a previous analysis on GDX.

Decide for yourself whether or not that information provided a service and/or was useful and timely.

Stay Tuned

Charts by StockCharts

Note:  Posts on this site are for education purposes only.  They provide one firm’s insight on the markets.  Not investment advice.  See additional disclaimer here.

Rule of Alternation: Biotech

Early Session

What Happened Last Time … Won’t Happen This Time

We have four more trading days until the end of the Third Quarter. It’s unlikely that biotech (SPBIO) is going to make a new quarterly high.

This morning’s early action has LABD (3X inverse SPBIO) essentially unchanged to slightly lower; higher for SPBIO.

The weekly chart of SPBIO, above, has been inverted to mimic the inverse fund LABD … but without the tracking (bias) errors.

The “tight” area of action has been expanded in the next chart:

We can see the wide, high volume bar from the week of 8/27, is being tested by the subsequent weeks and their upward action.

This is normal market behavior that has probably been repeating itself since the buttonwood tree.

Alternating Action:

The difference this time around, we’ve already had the ‘low to upward thrust’ (for LABD) that was negated last week with a test.

That test has now reversed as seen on the 4-Hour chart (inverted SPBIO) below:

Both downward thrusts (September 17th, and 23rd) finished the day at or near their session lows.

The ‘rule of alternation’, from Prechter’s Elliott Wave discussions, essentially says that; what happened last time, will not happen this time.

That leaves two scenarios for SPBIO and LABD.

Scenario, No. 1

SPBIO reverses from here and goes on to make new daily, weekly highs.

Scenario, No. 2

SPBIO continues its downward reversal into the next leg lower; potentially to the Fibonacci projection target (not shown) of 161.8%.

That would put SPBIO, at or near the 3,873 level … a decline of nearly 62%, from last Friday’s close.

Force Index:

Since the inverse fund LABD is heavily traded (2mil – 3mil, shares per day), we can use it as a good indicator of professional trader commitment

I say ‘professional’ because, as incredible as it may seem, the majority of market participants (the amateurs) do not understand or can’t grasp the concept, the big money is made on the downside.

The trading books that regale stories of massive gains, were typically trades to the downside … probably the most famous of which, was Livermore’s well documented short position during The Panic of 1907.

I’ve even talked to a former broker (for a firm that has 15,000 locations nationwide) who asked me when I was discussing the markets (and I quote): “What’s an inverse fund?”

I kid you not.

As touched on yesterday with Random Notes, the level of complacency, stupidity and ignorance has reached levels that are not going to be repeated in our lifetimes.

Market participants are either going to be wiped-out … or they’re going to get very smart, very fast.

I’m personally going with the ‘wiped-out’ scenario as it’s extremely difficult to come up to speed on a complicated topic (reading price action) while your account is being decimated.

Which brings us to the Force-Index chart of LABD:

This chart’s a little different than the rest.

The Force Index section (the lower panel) has been expanded to show the nuances of thrust action.

Even all the way back to the major thrust lower on August 23rd, we can see, downward thrust energy has been dissipating.

Recently, as shown with the blue arrow, downward thrust has evaporated altogether.

Summary:

It appears from the 4-Hour chart of LABD, we’re potentially at a major point of inflection (not advice, not a recommendation).

The rest of the indices (except the miners) are at or near their all time highs … with valuations (P/E ratios) stretched to the highest on record; going all the way back to 1962, if memory serves.

SPBIO is the only major index that’s about to post three down quarters in a row.

Obviously we’re short this sector via LABD (not advice, not a recommendation) with the understanding that anything can happen.

This market (SPBIO) along with the others could reverse and move to new highs.

However, at this juncture, it looks like the air’s coming out of biotech … slowly, at first.

Stay Tuned

Note:  Posts on this site are for education purposes only.  They provide one firm’s insight on the markets.  Not investment advice.  See additional disclaimer here.

The CDC, The PCR, and Biotech

12:20 p.m., EST

ZeroHedge picks up the story

As if on cue, ZeroHedge has just posted this article which covers the No. 1 bullet item from yesterday’s ‘Random Notes’.

It’s typically not the article that’s of major importance but the comments.

A screen-shot of comments with a series of links from that article, are below:

ItsAllBollocks13 hours ago

Why isn’t anyone mentioning the WEF? It’s all there in Claus Schwab’s book called the Great Reset, can’t anyone read anymore?

https://straight2point.info/wp-content/uploads/2020/08/COVID-19_-The-Great-Reset-Klaus-Schwab.pdfplay_arrow13play_arrow

Mister E11 hours ago

excuse me but people post about the WEF here all the time, are you new?play_arrow7play_arrow

Not Your Father’s ZH34 minutes ago (Edited)

Yeah, right? I and others have posted many times about the not-so-Great Reset, Cyber Polygon, Event 201, Herr Unkle Klaus Schwab’s Chez Davos broiled insect loaf under polystyrene, owning nothing and being thrilled, etc. Whitney Webb has been one of the best reporters on it, Catherine Austin Fitts, many more. Lew Rockwell is the single best place to start from, as it links to all of this. Speaking of which:   7.9 Billion Lives in the Balance

The Covered-Up Crimes of Vaccine-Maker Pfizer – Just Another “Too-Big-To-Fail” American Corporation

Joe Biden Spreads Vaccine Misinformation Live on CNN to Millions of Americans

CDC Panel Signals Support for Booster Shots, as Reports of Injuries, Deaths After Covid Vaccines Near 500,000

‘Every Solution Except the Vaccine Has Been Suppressed’    We Live in a Fraud of Unprecedented Dimensions

How To Get Ivermectin      Ways To Take Action     Child Abuse       https://www.technocracy.news/

Bombshell lawsuit: Gov’t whistleblower says coronavirus vaccine deaths at least 45,000

47 studies confirm ineffectiveness of masks for Covid and 32 more confirm their negative health effectsplay_arrow3play_arrow

It’s obvious those monitoring and commenting on ZeroHedge are wide awake.

Once again, all of this brings us back to biotech.

Biotech, SPBIO (LABD) Analysis:

We’re going to start with an unmarked chart of inverse fund LABD, on the weekly scale:

It may not be obvious at first, but the chart can be separated in two as shown:

That inflection point, the week of May 14th, ’21, is where the bulls attempted a reversal and the bears (of SPBIO) are going to take control.

Notice that before May 14th, price action is wide and choppy. Afterwards, it settles down into a clean and rythmic flow.

From that inflection, LABD price corrected downward a Fibonacci 8 weeks before pivoting to the upside (SPBIO lower).

Now, we can draw a trading channel:

For months, the anticipated low of SPBIO, high for the LABD trade (not advice, not a recommendation) was/is planned to be the third week in October.

As price action progresses, and taking a cue from Robert Prechter (about trading for large gains), one needs to be prepared for SPBIO to just keep on going lower (LABD higher); even through October if that’s the case.

Summary:

The ZeroHedge article and especially the comments, show we’re in the middle of the largest fraud in world history.

It’s disappointing but not surprising, ‘certified’ management agencies (and I personally monitor quite a few) are saying nothing (publicly) about what’s really going on.

Their websites still show the ubiquitous sailboat with the retired couple looking out wistfully into the (chem-trailed) sunset.

Trading For Your Life:

With each passing day, it’s becoming obvious self-employment (like trading) may be the only way out. The big corporations are likely to mandate (illegally) en-masse, that everyone’s injected.

The plan to destroy the smaller businesses looks to be moving forward via more ‘lockdowns’.

Some states (like Texas) may somehow be separate. So far, so good.

The other states, not so much.

Stay Tuned

Charts by StockCharts

Note:  Posts on this site are for education purposes only.  They provide one firm’s insight on the markets.  Not investment advice.  See additional disclaimer here.

Downside Leaders: Gold, Biotech

11:39 a.m., EST

Biotech SPBIO, Down Over 21%

Miners GDX, Down Over 25%

As of about 10:50 a.m., EST, this is where we are from a sector standpoint.

The major indices are masking the potential the next leg down, has already started.

Yesterday’s update posted the link for ‘Holiday Turns’.

It’s a list of empirical observation that market tops (reversals) tend to occur during holiday weeks.

The weekly chart of biotech SPBIO (which has been inverted), shows a Fibonacci 21-weeks, from the all time high (low on the chart) to this week’s pivot:

Not only is SPBIO adhering to Fibonacci time prints on the weekly, it’s doing it on the daily as well.

It was a Fibonacci 34 days to complete the 38%, retrace.

It was a Fibonacci 5 days to complete the most recent reversal and test; culminating early this session.

As stated many times, the bottom may fall out of biotech.

Someone or something in the criminal cabal is going to let loose; fully exposing the real intent of the entire operation.

Recall Prechter’s admonition; ‘price leads the news’

If SPBIO reverses at week 21, with a decisive move lower, it may not be long before news precipitates out into the mainstream.

We’re now two-hours into the trading day.

It’s typical for SPBIO, to begin its erosion (discussed here). Let’s see if it can retrace the sharp down move from the early session.

Stay Tuned

Note:  Posts on this site are for education purposes only.  They provide one firm’s insight on the markets.  Not investment advice.  See additional disclaimer here.

Deep Dive: Gold Reversal

Gold Miner’s GDX

Fibonacci Projection

Rule of Alternation

Wyckoff analysis was used to identify the GDX up-thrust, reversal condition.

Nine trading days later, GDX is down a stiff -11.7%, from the analysis location.

It’s down -14.9% from its interim high set on May 19th.

What happens next?

This site offers a different perspective (more thoughtful, perhaps) than ‘stacking’ precious metals as high as possible.

Thoughts such as, major infrastructure disruptions (and more) are likely:

That includes nationwide power outages, food transport interruptions (or cancelled outright) along with massive ‘speck’ injected casualties (estimated past 100,000), see this report.

The very last thing you’ll need in that environment, is a stack of metal (not advice, not a recommendation).

Personal anecdote, skip to GDX Chart, if not interested.

These updates are originating from the North-Central area of Texas (DFW). When the historic cold snap rolled through this past February, the power went out repeatedly.

The first thought was not: “I’m sure glad I have my stack of silver to get me through”

No. The thinking was (in this order):

Food, water (water was second as there was plenty of it just outside as snow), munitions and ‘delivery mechanisms’, cash in case the gas station was operational … which is was not and then lastly, heat.

The location was using natural gas for heating and was available as long as there was power

Precious metals were nowhere on the list … not even considered. They had nothing to do with the situation at hand.

Precious metals come later … after the famine.

GDX Chart:

The original analysis from June 8th, is below:

Subsequent trade action (including the original notes):

Weekly chart showing Fibonacci downside projection to level(s) mentioned frequently by Steven Van Metre.

In the chart above, note the choppy action leading down to the most recent upside pivot (early March). That area expanded below:

If we’re in a reversal to much lower levels, the market tends to alternate.

It was choppy and overlapping action from the highs in August of ’20 to the March ’21, low.

Thus far at the pivot high in late May, its been essentially straight down.

With the planned outages discussed above, precious metals may become (temporarily) irrelevant.

If or when that happens, it may be time to consider a ‘stack’.

Of course, by then, no one will want to buy (and spend their worthless fiat cash) for risk of starving to death. This is how markets work.

Stay Tuned

Charts by StockCharts

Note:  Posts on this site are for education purposes only.  They provide one firm’s insight on the markets.  Not investment advice.  See additional disclaimer here.

Elliott Wave: American Tower

Paul Harrell likes to start his videos with:

‘The next twenty minutes are going be long and boring. You might want to skip to the end to see the conclusion.

His rabid and loyal fans then proceed to hang on every word of his self professed ‘boring anecdote’ until the very end.

Not saying this site’s in the same league as Harrell’s.

Just saying, the following is going to be a tedious discussion of American Tower (AMT) and how it just might be ready to start an Elliott Wave III, down.

Market Extremes:

Its been no secret. The markets are at price levels and valuations never before seen.

In this site’s opinion, going long anything, is insane.

There could be a break, upset, world event, container ship run aground (oh, wait…), cyber attack, volcanic eruption (oh, wait …), major earthquake, nationwide weather freeze (oh, wait…) food supply disruption (oh, wait…) bond bear raid (oh, wait…) currency devaluation, or any myriad of disconnects that would instantly change the dynamic.

Change the dynamic in such a way as to make low-risk long exit, or short positioning impossible.

This site has documented several times where major brokers have already gone off-line as a result of markets fluctuating to the upside.

What happens when it turns down? Good luck getting out.

Looking for the (short) entry:

Its been an on again, off again, and back on again affair with shorting real estate, IYR. Anecdotal evidence such as Jerimiah Babe’s updates from his area, show the market’s been vaporized and is not coming back.

We’ve shown from a Point & Figure chart perspective, IYR has built significant price action congestion.

In Wyckoff terms, congestion equals potential.

The IYR index has built enough congestion that if/when the reversal comes, price action has potential to decline below the 2009, lows.

American Tower (AMT) Symmetry:

Now, for the analysis of AMT.

We’re going to start with the daily chart which has an interesting pattern of equal distance moves (or waves):

This equal move structure gives a hint that something’s up. The market’s moving in an orderly fashion. But what order?

To add more intrigue, we’ll go to the weekly chart. We see each retrace of the two initial waves, was Fibonacci 62%.

The last retrace (up to Friday’s close) is essentially 100%.

Looking up Elliott Wave “equal waves” turns up this presentation. It helps some but does not cover the current situation. The take away from the video is that equal waves do occur.

Looking at the daily close chart of AMT gives us this:

The Wave 1, down is placed at the low extreme. Price action then corrects to pivot (magenta oval) at the Fibonacci 38.2% retrace level.

It’s a near perfect retrace.

The reason to think AMT just finished a complex correction that terminated at “z” which is also “2”, is the structure of the fifteen-minute chart below.

The first chart is unmarked except where price action changes character:

Then we put in the Fib projection tool at that location; the inflection point, to get the following:

Incredibly, the top of Friday’s price action is also a Fibonacci target (423.6%) projection.

Getting back to the daily chart and labeling it using the above information gives us this:

Removing all but the labels is more clear:

There could be other ways to label the structure. It may become (very) apparent at the next open whether this interpretation is correct.

However, coupled with yesterday’s analysis of IYR, and its technical condition (at the extreme), we get the sense we’re close to some type of price action hesitation or outright reversal.

Summary:

We’re short this sector via DRV (not advice not a recommendation).

Price action appears to be at extremes and is meeting Fibonacci and support-resistance levels simultaneously.

Not related but an interesting coincidence (maybe): Van Metre’s update on Friday night:

“Is This a Sign Real Estate Prices Have Peaked?”

The futures markets just opened … S&P down 7-points. Let’s see what happens next.

Stay Tuned

Charts by StockCharts

Note:  Posts on this site are for education purposes only.  They provide one firm’s insight on the markets.  Not investment advice.  See additional disclaimer here.

Early or Late?

It may have been Robert Prechter Jr. that said years ago;

‘You’re either going to be early, or late’

He then went on to say his trading method usually puts him in a little early on the move.

That means there are times when the anticipated direction does not materialize.

So, your either suffering through the pain of anticipated reversal (for seconds, minutes, or days), or you’re chasing the market.

You make the call.

There really is no other choice.

Both methods involve psychological pain.

Referring back to Prechter, he also said some of the best traders he knew were former Marines. By definition, they are well trained to deal with pain.

My former mentor, the late David Weis would say after hit on a set-up, if conditions warranted, he would enter again; as he told me, he would ‘stick his chin out’ and effectively tell the market to ‘prove him wrong’.

It was an interesting choice of words for him as one can see from his training video …. he had a distinctive chin.

Trading Style:

The trading style presented on this site is a combination of Wyckoff tape reading coupled with anticipating price action.

As inferred above, that means there may (and will ) be times of draw-down while working to enter a market reversal.

That’s where we are now.

Trade Actions:

Yesterday’s upward action in basic materials forced the ‘project’ out of its short (SMN) position. That sector may attempt to make a new 52-week recovery high before it’s ready for reversal.

Analysis: Real Estate, IYR

One market that did make a new 52-week high, setting up technically for a short, is real estate:

The weekly close of IYR has been inverted (turned upside down) to show the unique technical condition.

IYR has created a large terminating wedge that’s in the process of a ‘throw-under’. At times a market will attempt to breakout of a wedge in the opposite direction of eventual reversal.

This type of breakout tends to fail. Based on the dashed line contacting a prior congestion, there’s’ potential to at least hesitate in this area.

The daily chart below provides additional nuance:

It’s clear price action has contacted two prior areas of support – resistance during ‘throw-under’.

Anything can happen but it seems that IYR’s at maximum extension.

On Friday, IYR price action closed just 0.05-points off its high for the day. That high was also a 52-week high.

We’re now in a support-resistance zone.

If IYR is to move significantly higher, it might need additional fuel (a retrace lower) to break through.

Positioning:

The action then (not advice, not a recommendation) was to short the market via DRV.

Once again, the market itself is telling us where to go for opportunity.

Charts by StockCharts

Note:  Posts on this site are for education purposes only.  They provide one firm’s insight on the markets.  Not investment advice.  See additional disclaimer here.