The chart insert at left, shows Senior Miners, GDX, have bounced off support (blue line), making another attempt at a retrace.
The lower magenta dashed line is 38.2%, with the 50% level, as the upper line.
If this retrace attempt fails by posting successive lows below ‘support’, it indicates we may already be in the ‘deflationary scare’ as discussed by Ed Dowd many times in his interviews (not advice, not a recommendation).
Note the dollar (UUP proxy) is currently in a rally.
Note: Posts on this site are for education purposes only. They provide one firm’s insight on the markets. Not investment advice. See additional disclaimer here.
Note: Posts on this site are for education purposes only. They provide one firm’s insight on the markets. Not investment advice. See additional disclaimer here.
A nuance in price action can have (significant) meaning or be obliterated at the next session.
It’s no secret the dollar, gold, and the miners, are all at extremes.
The dollar is down, gold is stretched in a potential blow-off, and miners (GDXJ), just posted action that may be important (not advice, not a recommendation).
Junior Miners GDXJ, Daily
The last two days have printed a low of 60.13, but this is not the low of Wednesday, the 23rd. That low is 60.05, below the last two day’s lows.
Why is that important?
The last two days have not made new daily lows, so have not created a potential price action reversal (pushing below 60.05, and reversing).
We can also see, today’s bounce is to 23.6%, while last Thursday’s bounce was to 38.2%.
This all may mean something or not.
With the extremes noted at the outset, it may not take long to find out if the distinctions are important (not advice, not a recommendation).
Note: Posts on this site are for education purposes only. They provide one firm’s insight on the markets. Not investment advice. See additional disclaimer here.
Note: Posts on this site are for education purposes only. They provide one firm’s insight on the markets. Not investment advice. See additional disclaimer here.
With the reversal now obvious (since the Fed announcement, September 18th), we have the usual suspects putting out ‘content’ (here and here) letting you know what’s already happened.
In Prechter’s book, The Wave Principle of Human Social Behavior, he states, being part of the herd, is hard-wired into the brain.
Therefore, it takes diligent, consistent effort, to go against the mindless (limbic brain) herd if you’re going to make an objective observation.
So, let’s do just that, taking an objective look at the potential effects of the bond reversal.
Bonds (TLT proxy) began its reversal, rates higher, the day before the last Fed announcement.
The IYR, reached its high that Wednesday, 9/18/24.
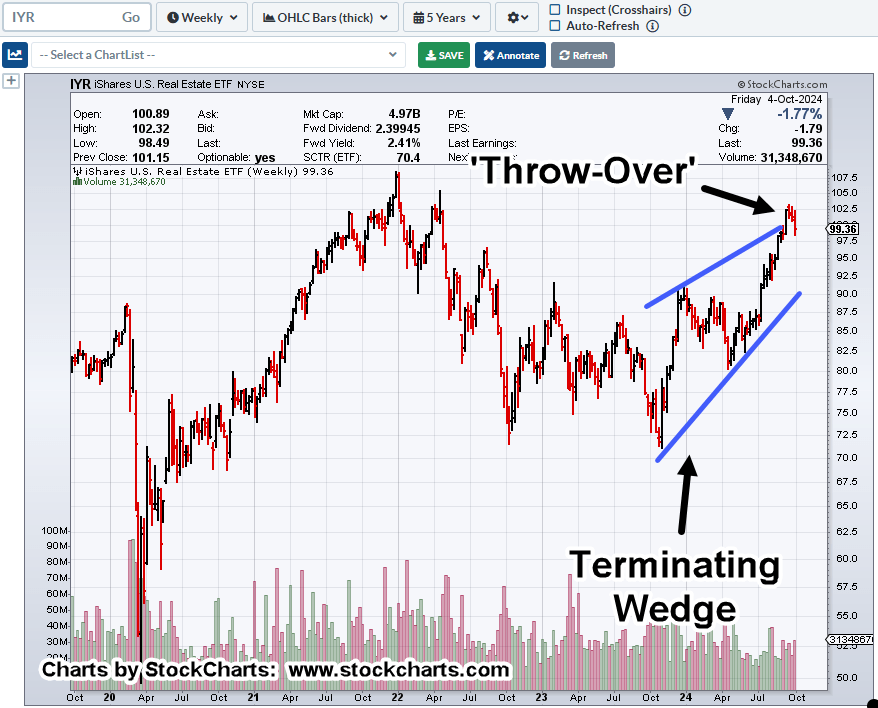
Real Estate IYR, Weekly
It’s been nearly three years since the all-time high in December, of 2021. The wedge shown below has been just over a year in the making.
The reversal action of the past few weeks can be seen in the ‘Throw-Over’ area of the chart.
If the wedge has been identified correctly, price action has now entered back into that formation.
Positioning
This post highlighted a short position was on the horizon.
Note: Posts on this site are for education purposes only. They provide one firm’s insight on the markets. Not investment advice. See additional disclaimer here.
We’re about to find out if silver (SLV), is headed for a breakout, sideways congestion and/or, outright reversal.
In a world that seems to be allergic to the truth (as serpentza, put it), we’re going to do just that; look at the truth, the price action itself.
The last update, link here, said to watch for an SLV, breakout that could fail, confirming a bearish divergence.
From the intro line, here we are.
We have the breakout.
All that’s missing is continuation higher or reversal (not advice, not a recommendation).
So, let’s go to the truth of the matter, the SLV chart.
Silver SLV, ETF, Daily
Years ago, Dr. Elder stated, when MACD histogram and MACD lines are parallel (bearish divergence), it’s a rare occurrence.
The coming week might be the deciding factor.
Before we leave this post, let’s throw in a bonus and consider the dollar ‘collapse’ narrative.
Dollar ‘Collapse’, Where?
Below is an updated chart of the dollar index.
Note the arrow to this link, posted nearly four years ago!
Dollar Index UUP, Weekly
It’s important to note, at the time the ‘Reversal Ready’ post was created, there was absolutely no-one (that was known) indicating the dollar index was headed significantly higher.
This is what’s meant by ‘Strategy’ in the About section.
Livermore was focused on what’s going (or likely) to happen in a big way.
Note: Posts on this site are for education purposes only. They provide one firm’s insight on the markets. Not investment advice. See additional disclaimer here.
Developing a trading plan that accounts for broker outages, blow-ups, and platform lockups, was presented on this site, as early as December of 2020.
Back then, we had this:
“Built into that [system] approach is recognition there will be market outages, trading halts, communication interruptions and natural disasters.“
“The one thing that may separate this site from others, these (potential) events are taken into account.“
Fast forward to now.
Those events are not ‘potential’ anymore, but a reality.
Note: Before leaving that post, from December 2020, let’s not forget, the dollar reversal (and rally) discussed, is still going, nearly four years later!
That’s what’s meant by ‘a strategic, engineering perspective’ (see About).
Moving on to the topic at hand.
The last update showed potential trendlines in biotech, XBI.
As a result of today’s action, we’re revisiting the post with new information.
Biotech XBI, Weekly
As Dr. Elder said years ago, ‘trendlines are not made of glass’. Trendlines are more like a wire fence; the market can attempt a breakout that may ultimately get negated.
With the weekly XBI, that may be the case.
We’re about one hour before the close, only one day into the trading week; it’s pre-mature to say XBI, will finish the week (or even the day) inside the trendline shown above.
However, if we do end the week lower, it may be a serious bellwether; XBI could be in deep kimchi (not advice, not a recommendation).
Note: Posts on this site are for education purposes only. They provide one firm’s insight on the markets. Not investment advice. See additional disclaimer here.
Note: Posts on this site are for education purposes only. They provide one firm’s insight on the markets. Not investment advice. See additional disclaimer here.
In our example above, the commentor said their family survived in part, because they had “100kg of salt”.
That amount equates to about 220 lbs.
Converting 1oz gold for (roughly) 18-oz. salt, at today’s gold prices, is about $392,000 ‘worth’ of salt.
When they came out other side, the salt may have been gone, but they had the gold. 🙂
Now, moving on to the chart.
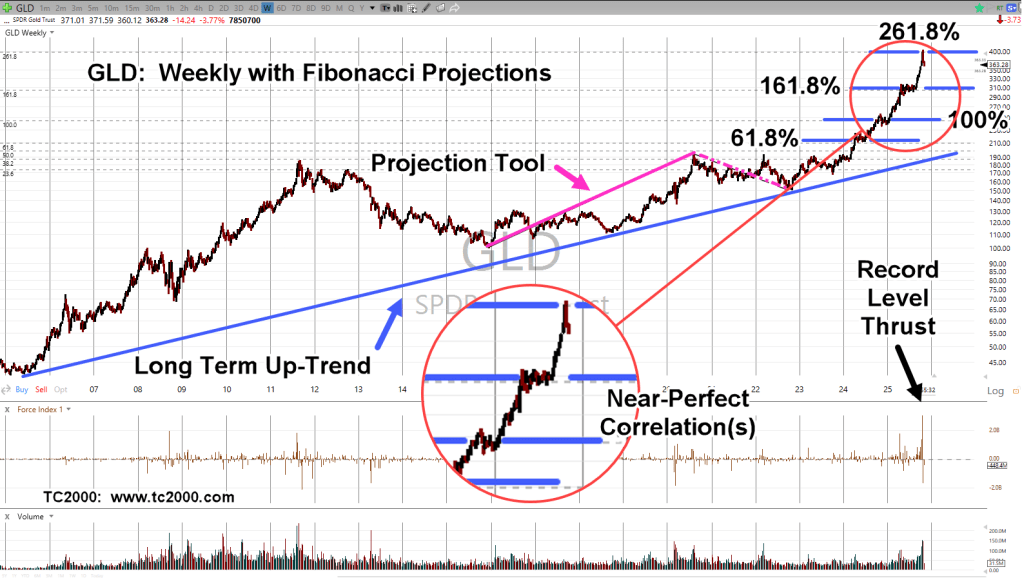
Gold (GLD), Weekly
Gold is at a critical juncture.
We’re either in a potential ‘throw-over’ on the wedge formation (with reversal) or about to pressure higher into all-time highs (not advice, not a recommendation).
We see a rising (terminating) wedge, along with a decline in volume (thrust).
We’re at The Danger Point®
Gold’s price action does not need much of a push to go either way.
Then, The Dollar
Recall, from the dollar update (link here), there’s a possibility for it to decline from current levels; potentially setting up a Wyckoff spring condition.
A dollar decline would naturally provide a likely correlation for gold rising into new all-time highs.
If either one happens, there’s probably going to be panic.
Note: Posts on this site are for education purposes only. They provide one firm’s insight on the markets. Not investment advice. See additional disclaimer here.
Before we even get started, let’s take a look at the last time there was this much dollar ‘collapse’ hysteria.
The update at this link, shows the analysis of what was likely for the dollar during the previous round of hysterics.
That was over two-years ago and in itself, highlights the ‘strategic’ nature of the analysis presented on this site.
The UUP (dollar index) chart is re-printed below and shows the location of the ‘reversal’ update.
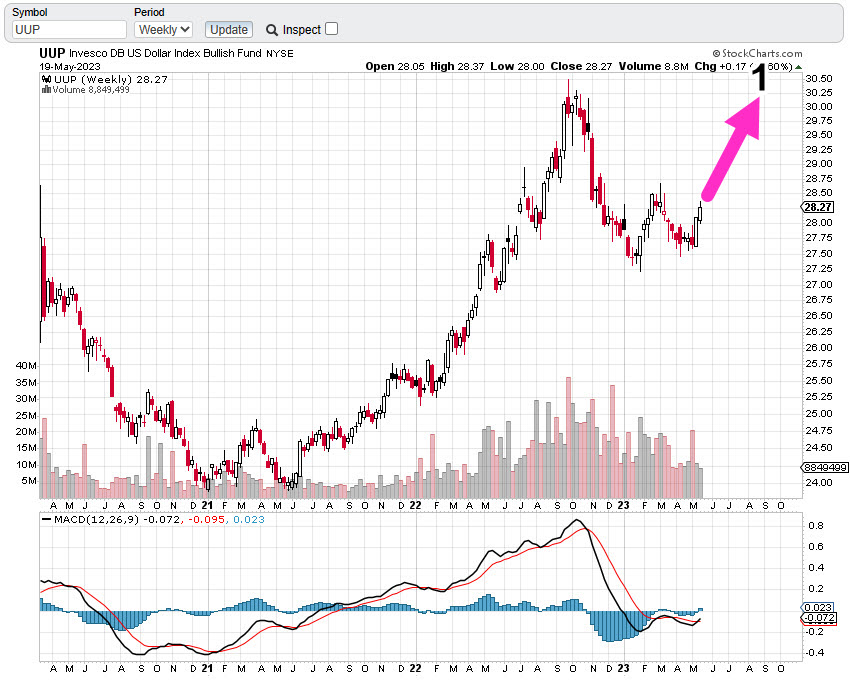
Dollar UUP, Weekly
That was then; so, let’s move on to what could happen at this point in time.
The chart below shows three potential scenarios based on current price action and location.
No. 1
The dollar rallies from here; moving on to test the highs.
No. 2
The dollar continues lower, tests or penetrates the prior lows, then rallies in a Wyckoff spring to the highs and potentially higher.
No. 3
We really do get a collapse.
The dollar breaks the support area, comes back to test the underside and then heads lower.
Hysteria In … Hysteria Out
Of the above three scenarios, which one is going to create the most media hysteria?
A better way to ask the question, which scenario would be the most profitable for those entities that ‘control’ (manipulate) this market?
If the dollar is still in an uptrend and this is just a pull-back, then Scenario No. 2, would likely be the most profitable.
Played Like A Fiddle
Remember, the general public is being played like a fiddle.
The recent and on-going mass exodus from the small banks to the larger ones right into the potential CBDC trap, is a good case in point (not advice, not a recommendation).
So, it could be as well for the dollar in Scenario No. 2
If the dollar heads lower and manages to penetrate support, there’s likely to be media pandemonium.
That would go right along with YouTube grifters losing their minds … all the while, getting those important ‘clicks’.
If it happens, that would be a fantastic, potential set-up for a short-covering rally.
Note: Posts on this site are for education purposes only. They provide one firm’s insight on the markets. Not investment advice. See additional disclaimer here.