Bond Reversal Targets

Trade or Strategic

It’s either a short-term trade or a strategic reversal.

On the strategic reversal side is this just out from ZeroHedge.

‘Inflation’ may have peaked; where have we heard that before.

However, the charts presented in that link, do show we’re at an extreme.

If we look at the TLT, price action itself, which is impulsive down, we’ll go with the short-term first (not advice, not a recommendation).

With that, Friday may have been the ‘test’ from our capitulation model.

The weekly chart of bonds TLT, shows the anticipated up-tick in MACD, as well as the measured move target from the terminating wedge.

Long Bond, TLT, Weekly

Note, the wedge has not (yet) broken to the upside … we’re still at The Danger Point®, where the trade could fail.

If we look at the daily chart, probabilities point higher.

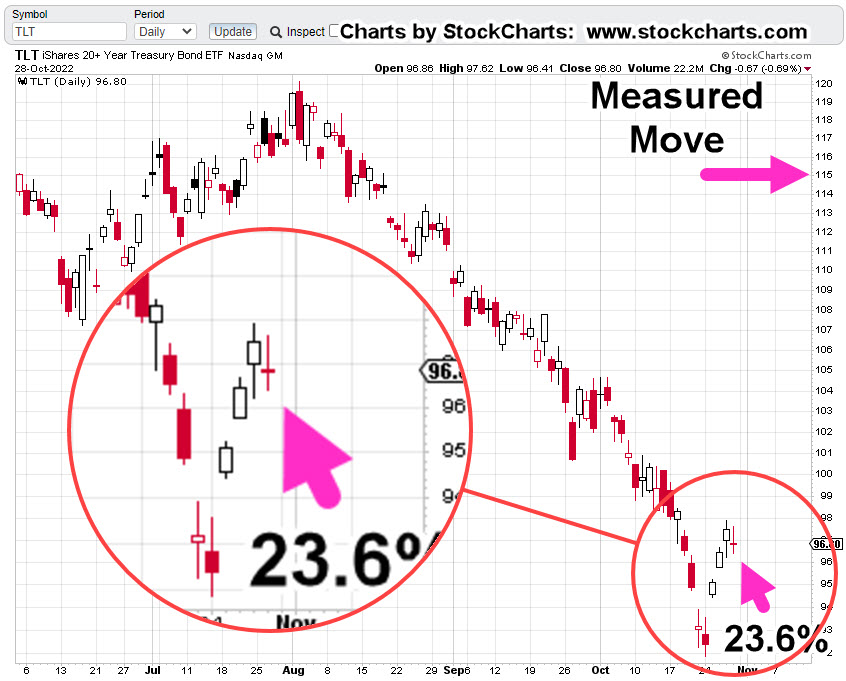
Long Bond, TLT, Daily

If this past Friday was the ‘test’ of the move, the retrace was a very weak Fibonacci 23.6%.

A new daily high in the next session(s), will help to confirm we’re headed higher.

Positions, Market Stance (courtesy only, not advice).

TMF-22-01:

Entry @ 6.705, 7.166***, Stop @ 6.68

***, Indicates change

Note: Positions may be increased, decreased, entered, or exited at any time.

Summary

If bonds continue to move higher, with rates heading lower, what’s going to happen to real estate, IYR ?

The wheels of the real estate crash have already been set in motion. If bonds rise, rates fall and IYR moves higher, there are specific targets to watch for short opportunities.

We’ll discuss those targets and more, in the next ‘The Market Set-Up … This Week’

Stay Tuned

Charts by StockCharts

Note:  Posts on this site are for education purposes only.  They provide one firm’s insight on the markets.  Not investment advice.  See additional disclaimer here.

The Danger Point®, trade mark: No. 6,505,279

The Market Set-Up … This Week

What To Watch … Gold, Bonds, & Real Estate

First off, ‘Goldman‘ says melt-up.

Not to be outdone, we have this ‘me too’ melt-up article as well.

Let’s not forget, all the ‘Fed must do something’ rumors and feigned concern by its members.

If anyone really wants to know the big picture, the overall plan (a wide majority do not), this interview may be the best explanation to-date.

With all of that, we certainly could get some kind of rally in the coming week. We’ll let the price action speak for itself.

As a reminder, Wyckoff analysis does not concern itself with press releases, rumors or ‘fundamentals’; Wyckoff himself, determined based on price action alone, they have no material effect on market movement.

In his words, ‘other forces are at work’, and it’s those forces that interest us.

Gold & Silver

As said in this update, gold (GLD) was just ‘ticks’ away from posting a new monthly low. In fact, it got just 0.24-pts, from a new low before rebounding.

Of course, each time we get any kind of rally in the metals, there’s the usual hysteria. Even though for the past seven months and counting, those rallies occur at lower and lower levels … i.e., a bear market.

Shown below, it’s in a trading channel with price action at the right-side channel line.

Gold (GLD) Weekly

The chart below gets closer-in.

From left-most contact point on the channel to the initial contact on the right side is a Fibonacci 13-weeks.

Also note, the weekly high posted at the center line is a Fibonacci 5-weeks from the left-most contact.

Highly emotional markets tend to adhere to Fibonacci until either the emotion wears off or ‘everybody’ recognizes the structure.

Obviously, to keep the channel intact, a lower open (and lower action) at the next session is needed.

Silver (SLV) has already been discussed in this update and this one.

Bond (TLT) Capitulation ?

Was this past Friday the day?

Gap-down trading on huge volume.

Looking at the daily chart of TLT below, Friday’s level of (down) volume has occurred only three times in the past three years.

Each time, there was a near immediate rebound or in the case of March 2021, the rebound came several weeks later.

Bonds (TLT) Daily

Moving in closer, we see the possibility of an ‘island-gap’ at the next open.

What could drive capital into the bond market?

Well, how about a ‘shock’ or continued market melt-down (not advice, not a recommendation).

A quick check of the local newsfeed (as of 12:45 p.m., EST) shows nothing on the horizon other than usual nuclear attack threats, power outages, child mutilation protests, marauding bears and the disarmament of Canadians.

Nothing to see here …

Real Estate

There is no mistake, events in real estate are happening at the fastest pace in recorded history.

As Scott Walters put it, over 10-million people bought into the ‘work from home’ hype and got themselves instantly (nearly) upside down in their transaction.

Now, the layoffs start.

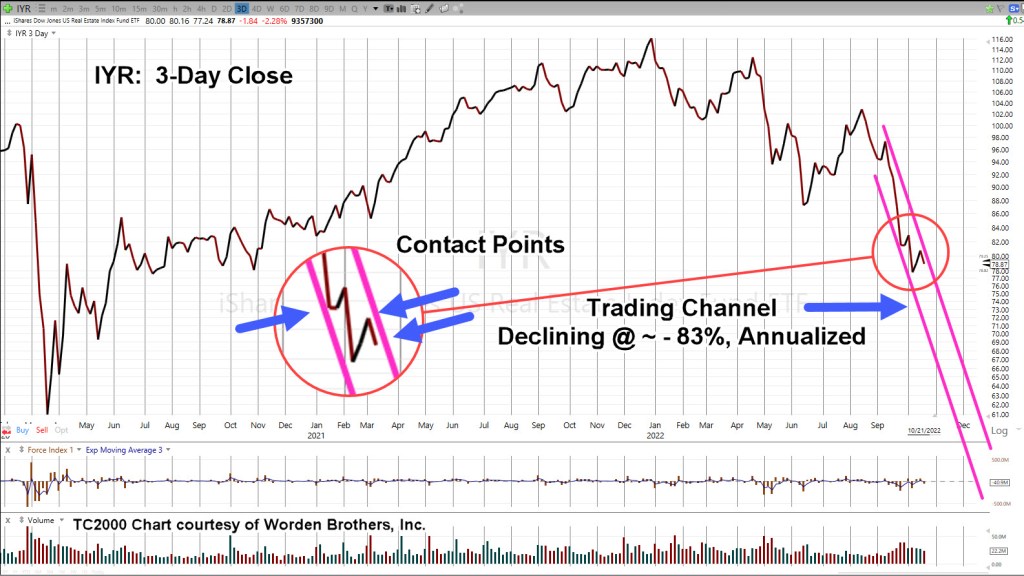
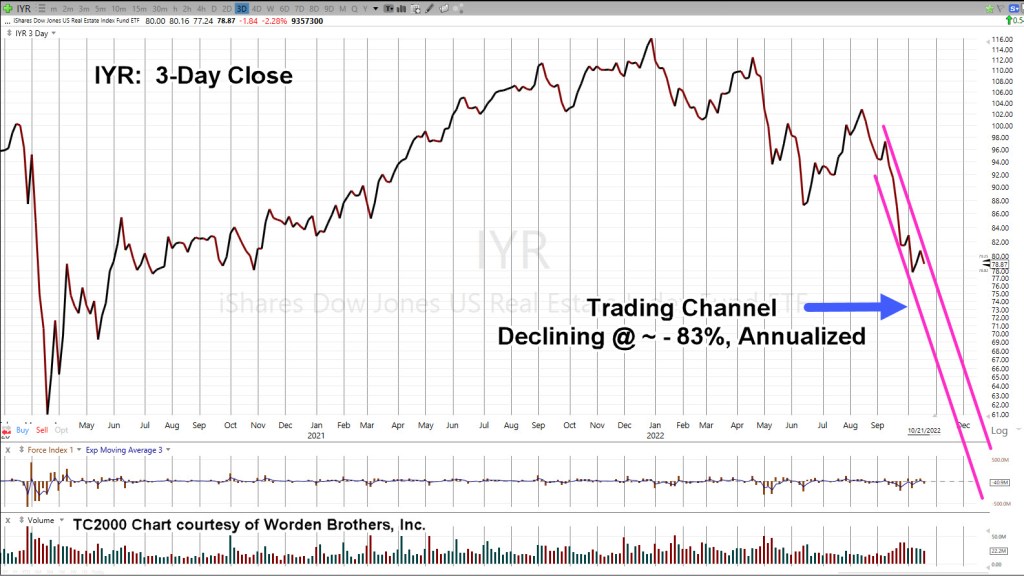
Real Estate IYR, 3-Day Close

Zoom-in, on the channel

As the last update said, we’ll know soon enough if there is more upside or if last Friday was it, and the downdraft continues.

Stay Tuned

Charts by StockCharts

Note:  Posts on this site are for education purposes only.  They provide one firm’s insight on the markets.  Not investment advice.  See additional disclaimer here.

The Danger Point®, trade mark: No. 6,505,279

The Market Set-Up … This Week

What To Watch

First off, it’s nice to know, traders at J.P. Morgan, don’t have clue as what to do.

They say it themselves; Not One Person

On top of that, I’m supposed to pay money reading about how clueless they are. 🙂

No thanks. Let’s see if we can do better than the average ‘investment firm’.

Before we get started, a reminder; as Michael Cowen says:

‘It’s the bear market that reveals those who really understand’, not the bull market ‘geniuses‘.

With that, let’s get into it; first up, is silver.

Silver: Wyckoff Analysis Results

The downside reversal was identified to the day.

Adding to that post, Europeans could not only be freezing or starving this winter, but also subject to radiation poisoning.

Surely, they’re all thinking that ‘stack’ of silver is going to save them.

Silver (along with gold) remain trending lower.

Silver (SLV) is currently at support levels; therefore, some upward action (staying below SLV: 18.5) is normal behavior.

Bonds: Are They Ready?

Hold your nose … bonds could be setting up for a rally.

As Steven Van Metre reports here, the Fed ‘shenanigan’ meter is pegged.

Bonds, TLT Weekly

Note, the bullish TLT, set-up is not confirmed until MACD ticks higher (not advice, not a recommendation).

Also note the repeating pattern of ‘spring to up-thrust‘.

Last up, biotech

Biotech SPBIO, Hourly (Inverted)

We’re going to use the chart from yesterday’s post to set the stage for getting closer-in.

This past Friday’s early morning ‘spike’ is barely visible; the 30-minute (inverted) chart below, has more detail.

SPBIO, 30-minute (Inverted)

Price action rejected the lower levels (higher on SPBIO) and pulled away throughout the session. That ‘pulling away’ continued on, all the way into the close.

That’s a clue there may be follow-through at the next session.

If the early session opens ‘gap-higher’ (SPBIO, lower), into the resistance area (four magenta arrows, hourly chart), it would be the fourth time pressuring at this area; markets rarely hold a fourth attempt.

Summary

Of course, other markets are being watched like real estate (IYR), Tesla (TSLA), and even Basic Materials (DJUSBM), a potential sleeper for significant downside.

Updates are planned if/when low risk shows up.

Positions: Current Stance (courtesy only, not advice).

The following is the positioning of my firm’s main (largest) account.

LABD-22-08:

LABD Entry @ 25.1278, 24.735, 26.025, 22.99, 22.29***, Stop is @ LABD 21.23***

***, Indicates change

Note: Positions may be increased, decreased, entered, or exited at any time.

Stay Tuned

Charts by StockCharts

Note:  Posts on this site are for education purposes only.  They provide one firm’s insight on the markets.  Not investment advice.  See additional disclaimer here.

The Danger Point®, trade mark: No. 6,505,279
The Usual Suspects

Special Biotech Edition

Bogart

An immense flood of data; research reports, lawsuits, expose articles and anecdotal evidence; every day, multiple times a day, something new.

Has the biotech technical (finally) lined up with the fundamental?

Those fundamentals are farther down but first, we’ll discuss the technical.

As a reminder, sometimes charts are inverted during analysis. This ‘trick’ was discovered years ago and is based on techniques used by Dr. Alexander Elder.

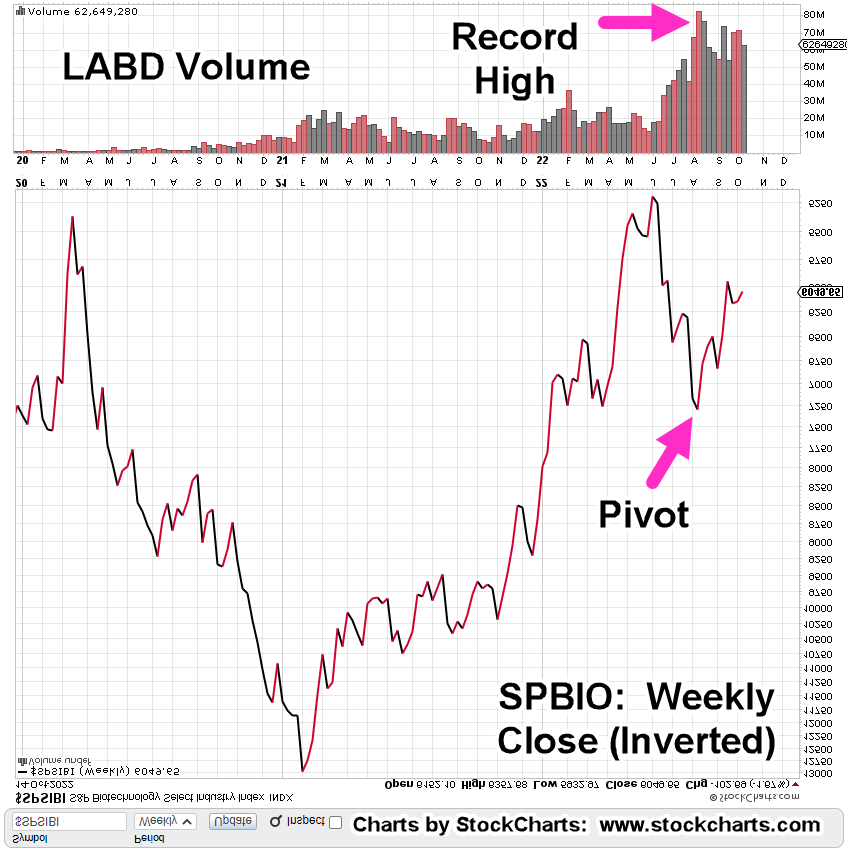
Biotech SPBIO, Weekly Close (Inverted)

We’ve taken the weekly closing chart of SPBIO ($SPSIBI, on StockCharts) and inverted it to mimic the action of inverse fund LABD.

The index has no volume; so LABD is used instead.

The magenta arrow shows the pivot point for the index, corresponds will all-time record volume on leveraged inverse LABD.

Next, we’ll get closer-in and look at the ‘pivot’ on the hourly chart (inverted).

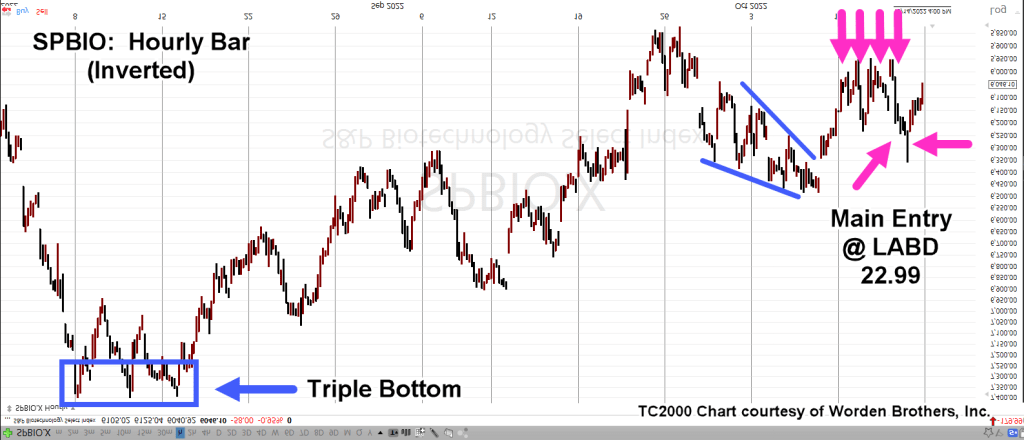
SPBIO, Hourly (Inverted).

The magenta arrows show successive positions (Livermore ‘probes’) entered (via LABD) before the main entry @ LABD 22.99, which was 90% of position size up to that point.

The next day (Friday) had a gap-lower open that was quickly reversed. Position size was increased by another 5%, at LABD 22.29 (not advice, not a recommendation).

Effective position equates to LABD 23.17

Price action pulled away steadily from the early morning levels, suggesting a sustainable reversal.

The Fundamentals

Some of this stuff, you just can’t make up.

Listed in somewhat chronological order, here they are (not an exhaustive list).

No. 1

Pfizer hires 600 to help document adverse events. Wasn’t it supposed to be ‘safe and effective’?

No. 2

Pilot Shortage

Fired/quit because they refuse to get ‘protection’.

A possible corollary to what’s happened, via injection, we have this.

No. 3

Pfizer, nobody wants their product … after the rollout.

No. 4

Who could it be?

Previously unknown (or rare) problems and illness now starting to accelerate.

No. 5

We’re here to help.

No. 6

You mean, it was all a lie?

No. 7

The real reason for getting ‘tested’?

No. 8

What did the media know and when did they know it?

No. 9

It’s still a ‘suggestion‘ but the payouts to family members are real.

No. 10

It’s over … and then it’s not.

No. 11

We’ll keep it quiet, so no feelings get hurt.

No. 12

How bad is your batch? Let’s see.

No. 13

You mean, it was never tested? I’m shocked.

No. 14

After all that, maybe we can give it another shot.

No. 15

A potential infinite number of complications … nothing to see here.

No. 16

Getting away with it? Not so fast.

No. 17

Just had a heart attack? We can help.

No. 18

Limited Hangout? You decide.

No. 19

Lastly, this is what it’s really all about.

Recorded years ago. Did her ‘prophecy’ come true?

Stay Tuned

Charts by StockCharts

Note:  Posts on this site are for education purposes only.  They provide one firm’s insight on the markets.  Not investment advice.  See additional disclaimer here.

The Danger Point®, trade mark: No. 6,505,279

Wheels Come Off … Biotech

Unraveling, Quickly

This just out on ZeroHedge:

An Epoch Times article, using excerpts from a Lancet Report, linked here.

It’s best to let the reader sort out what it all means, arriving at one’s own conclusions.

Of course, the obvious problem, the ‘elephant’ is not addressed directly.

However, VAERS is quoted in The Epoch Times article, thus giving it legitimacy.

Leading The Downside

For some time, this site’s highlighted, biotech (SPBIO), as unique to all other indices save GDX, and GDXJ.

That is, it’s down the most since the bear market started.

As of today’s close, it’s down over – 54%, from all-time highs while the S&P is down only – 23.7%.

As documented over several years, the sector’s unique; it’s at risk (more than other indices) to implosion.

With today’s close, it looks like we’re at a critical juncture.

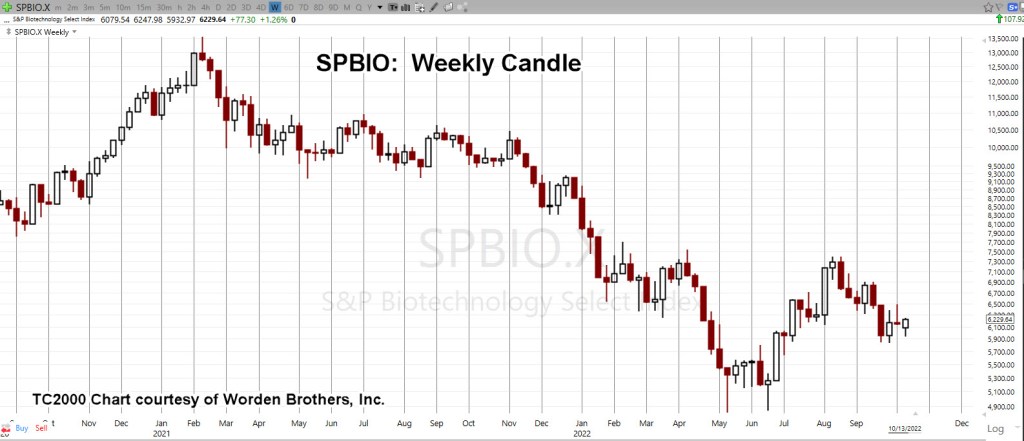
Biotech SPBIO, Weekly

The unmarked weekly chart

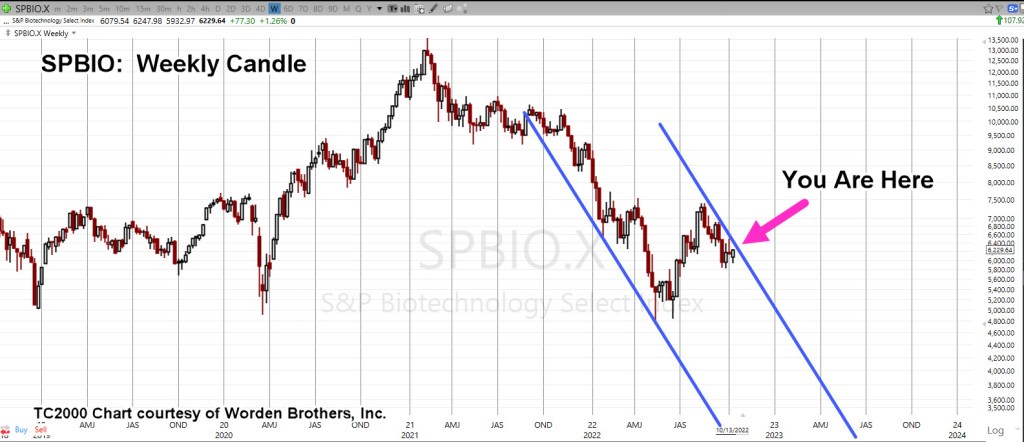
Compressed, with added trendlines.

It’s an obvious trading channel of immense size … but so is nearly everything else concerning these markets. We’re operating at unprecedented scale in unprecedented times.

But wait, there’s more.

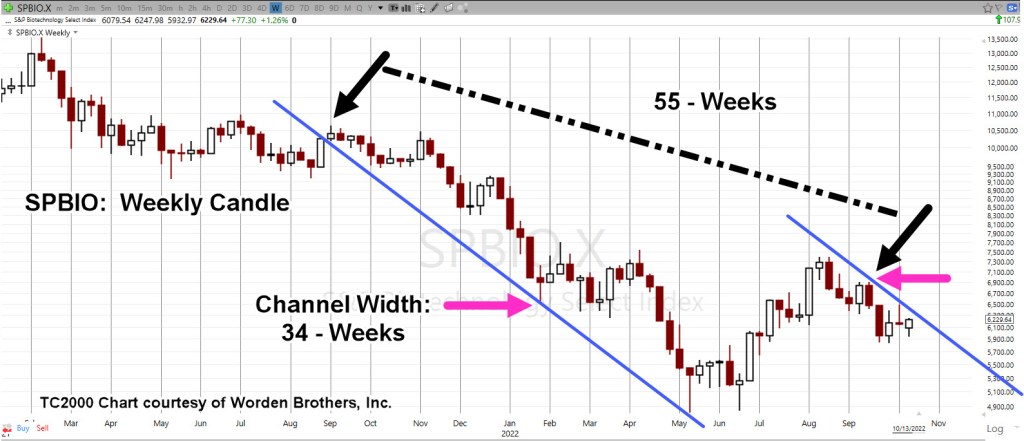
The trading channel has Fibonacci time correlation(s).

We’ll expand the weekly chart for more clarity.

From channel entry, week ending 9/3/21, to the right-most contact point (week ending 9/16/22), is Fibonacci 55-Weeks.

Channel width measured from week ending 1/28/22, to the same contact-point, week ending 9/16/22, is a Fibonacci 34-Weeks.

We’re at The Danger Point®

Positions & Current Stance (courtesy only, not advice).

The following is the positioning of my firm’s main (largest) account.

DRV-22-04:

Entry @ 66.463, Stop @ 63.98

Discretionary exit (today) @ 75.96***

Trade Closed

LABD-22-08:

Entry @ 25.1278, 24.735, 26.025***, 22.99***, Stop is Open (to be set at next session)

***, Indicates change

Note: Positions may be increased, decreased, entered, or exited at any time.

Stay Tuned

Charts by StockCharts

Note:  Posts on this site are for education purposes only.  They provide one firm’s insight on the markets.  Not investment advice.  See additional disclaimer here.

The Danger Point®, trade mark: No. 6,505,279

Sentiment Shift … Biotech

Was Friday, The Day?

Is the tide (finally) going out for biotech?

The end of the prior update, shows a lot coming to the surface.

So much, that it can’t be ignored.

Also coming out on Friday, was this report.

Is it all too much, price action has finally reversed? We’ll analyze that potential below.

Biotech SPBIO, Quarterly

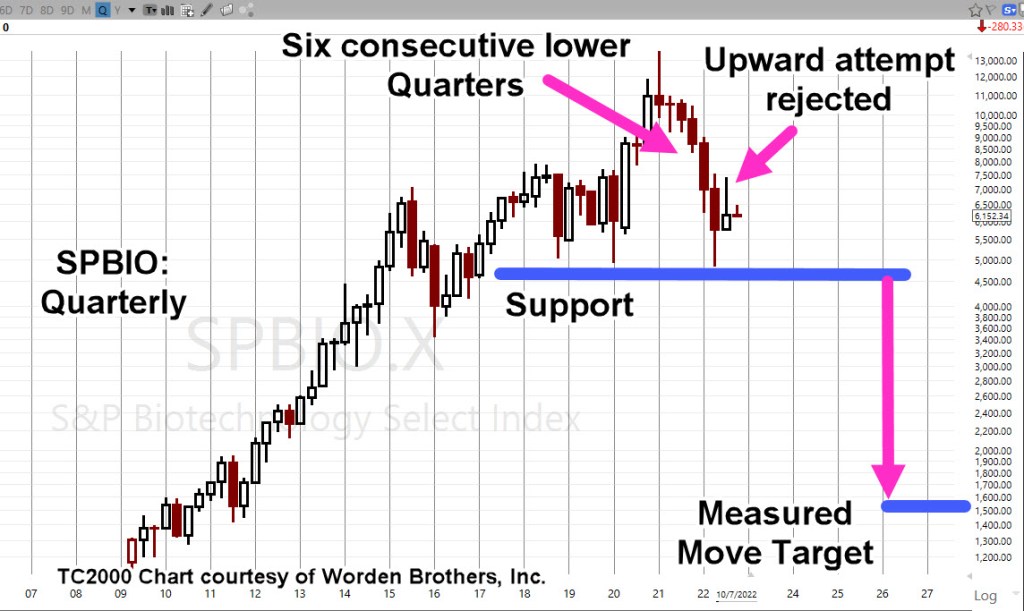
First, the big picture.

There have been six consecutive lower quarters … the most of any major index

What’s not labeled above, is an apparent Head & Shoulders pattern forming; the arrow showing the rejection of the upward move could be the top of the Right Shoulder.

The left shoulder is considered to be the eight quarters that span, 6/29/18 – 3/31/20.

If it’s an H&S, and if the support is penetrated, the measured move target is shown.

That’s a lot of ‘ifs’.

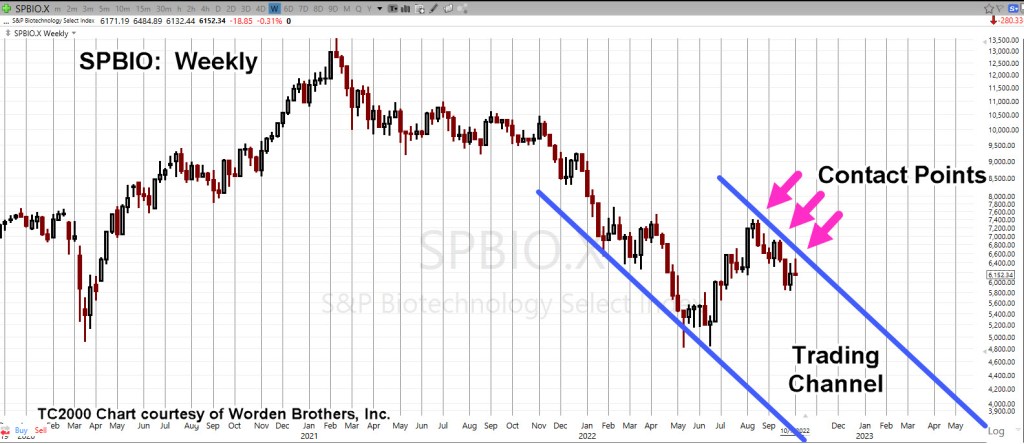
Moving on to the weekly, we see confirmation of the right-side trendline. Also shown is the potential trading channel.

Biotech SPBIO, Weekly

Price action could still break out to the upside from the channel line.

For that to happen, there would need to be some kind of huge catalyst.

So far, nothing out of the ordinary other than the typical Ebola outbreak and/or, radiation poisoning 🙂

Downside Reversal Probabilities

So, last Friday was decidedly down. If we’re in a reversal, what’s the next likely thing to happen?

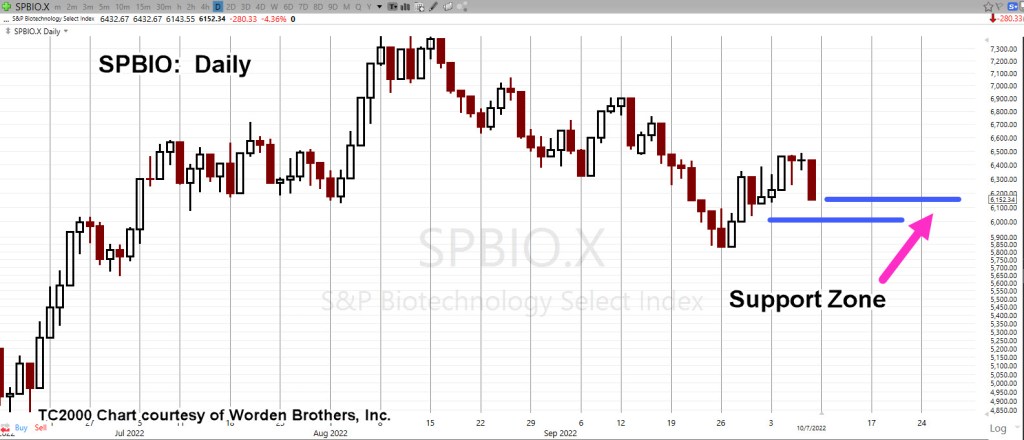
For that answer, we go to the daily chart.

Biotech SPBIO, Daily

The blue lines are a minor support zone.

If we are in a reversal, a lower open at the next session (into the support zone) weights probabilities to the downside.

If that happens, expect price action to attempt to ‘test’ Friday’s wide bar by moving higher … at least temporarily.

If there’s a higher open instead, it does not necessarily negate the reversal, but it does weaken the case.

It may mean there’s more upside testing and/or, the beginnings of a move to much higher levels.

Stay Tuned

Charts by StockCharts

Note:  Posts on this site are for education purposes only.  They provide one firm’s insight on the markets.  Not investment advice.  See additional disclaimer here.

The Danger Point®, trade mark: No. 6,505,279

Between Sucess … and … Failure

‘Inside Days’ For Biotech

The market will attempt to hypnotize all participants.

That’s what’s happening now.

This, just out from ZeroHedge; buying ‘puts’ at the bottom and selling out or timing-out at the highs.

Typical bear market behavior

Our chosen sector for going short, biotech (SPBIO), is not immune to hypnotic action (not advice, not a recommendation).

Yesterday was an ‘inside day’, staying within the confines of the prior day’s action.

We’re still at The Danger Point®; it can go either way.

In the pre-market (8:55 a.m., EST), biotech along with the overall market is set to open higher.

How much higher, is the key as we’ll see below.

Biotech SPBIO ($SPSIBI), Daily

The daily chart includes our ‘trick’ previously discussed of using LABD volume to show supply/demand forces.

As price action rose to test the top of the range, volume decreased significantly.

Commitment to the upside is weak (at this point).

The zoom version below shows more detail.

From the LABD pre-market action, the best that can be determined, we’re still within the range of Friday’s (9/30/22), bar.

As shown, the level to watch is the SPBIO high of 6,384.50.

A decisive penetration of this high indicates potential retrace to 50%, at least.

In that case, the short in LABD (LABD-22-06), will be exited (not advice, not a recommendation).

Stay Tuned

Charts by StockCharts

Note:  Posts on this site are for education purposes only.  They provide one firm’s insight on the markets.  Not investment advice.  See additional disclaimer here.

The Danger Point®, trade mark: No. 6,505,279

.

Decision Point: Biotech

To Bounce, Or Not

Final stages of the bear market?

That’s what the ‘analyst’ at this link has to say.

If you know your market history, ‘opinions’ like that were pushed out all the way down to the bottom after the crash of 1929.

As for me, I’m going with the 78-year-old money manager that was quoted saying (paraphrasing):

‘It’s the biggest bear market of my life.’

Back to the analyst above, another opinion could be (looking at price action), we’re not in the ‘final stages’ of anything … except maybe the beginning.

Before we leave the topic, IYR real estate closed at 103.84, when the ‘old-timer’ spoke. Yesterday’s close was 81.43, down -22%, from that level and down – 30.3%, from all-time highs … and counting.

The ‘final stages’ of this decline is (potentially) years, if not decades away.

Biotech Decision Point

With about twenty-minutes before the open, biotech SPBIO, is set higher with leveraged inverse (pre-market) LABD, down approximately – 1.6-pts. (-6.3%).

We’re at a decision point for the sector.

Looking at the chart of inverse LABD below, a trend (and potential trading channel) is clear.

This morning’s gap-lower open is set to test that trend.

SPBIO, Leveraged Inverse LABD, Daily

If biotech remains in its downtrend that started at the August 11th, high of 7,399.86, expectations are for some kind of upside LABD, reversal within the first hour of trade.

If not, price action then opens the door for a move above established resistance at SPBIO, between 7,400 and 7,700.

As unbelievable as that would be, it could still happen.

Summary

The first hour of trade will be watched closely.

Price action itself will define if SPBIO, has fished its down move or if we’re just confirming the trend already established.

Stay Tuned

Charts by StockCharts

Note:  Posts on this site are for education purposes only.  They provide one firm’s insight on the markets.  Not investment advice.  See additional disclaimer here.

The Danger Point®, trade mark: No. 6,505,279

Trading A Silver Collapse: Part 3

No One Expects A Long Term Siege

This time is different.

This is not 1987, or 1998, or 2000, or 2008.

In those cases, once the market reached bottom, the recovery was sharp (’98, ’09) and if not, was steady as in ’87 and ’03 – ’04.

In each case, interest rates were high enough to allow ‘fiddling’ that would in turn, result in the desired (i.e., up) market response.

Ammo Is Spent

This time, we’re in another melt-down and there’s no ammunition left to save the market.

That all got spent in ’08.

Back then, those witnessing firsthand, efforts like TARP, could feel in their gut, ‘there won’t be a (save) next time’.

So, here we are.

Always Fighting The Last Battle

It’s been said, Generals are always fighting the last battle; that is, what happened last time.

In line with that thinking is the (YouTube) idea, once we get a ‘collapse’, it will be time to rush in and scoop up ‘assets’ at fire sale prices.

That idea would have worked quite well in ’08 – ’09, which was last time.

On The Brink

Last time, there was no threat of nuclear war.

There was no infrastructure collapse or crop failures and looming world-wide famine (just to name a few).

There was no ‘elephant’ either.

This article, just out, has California front running the elephant with ‘composting’ signed into law a few days ago.

Silver, The Collapse of Demand

It’s not the metal itself that’s the problem. Having some is always a good idea.

It’s the idea of trusting in these ‘things‘ to be one’s savior.

There are larger forces at work that will likely overshadow owning something you can’t eat.

Once again, this just out: World’s largest produce market (Paris) goes up in flames.

At some point, there will be a collective world-wide realization … it’s the food supply.

When that happens, the expectation is, all ‘assets’ will be heavily sold off, including precious metals.

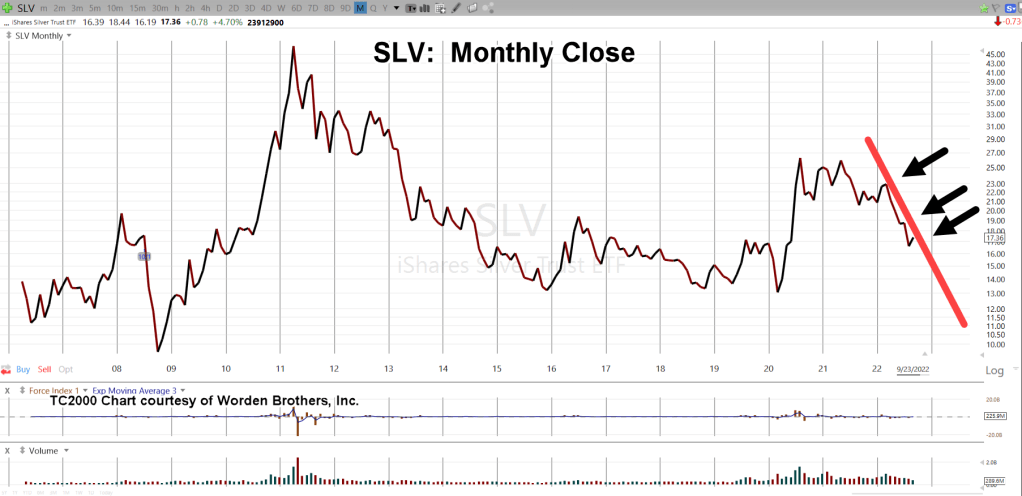
Silver (SLV), Monthly Close

The monthly chart shows the line to watch; the downtrend that started in late March of this year.

If SLV maintains its current rate of decline, it will be April of next year before we get to the support level shown below.

Pushing (and closing) below well-established multi-year support (orange line), is no easy task.

We would likely need to have some sort of catalyst to help price action get to those levels.

Once below support (‘Target Area’), SLV would then be in Wyckoff spring position.

Summary

As always, anything can happen; precious metals could rally starting at the futures open in a couple hours.

Price action itself, is the final arbiter.

Most ‘investors’ are not prepared for a long-sustained siege-grinding rachet lower, possibly to single digits.

If that happens, then will be the time to assess the potential for a significant long-term rally.

Stay Tuned

Charts by StockCharts

Note:  Posts on this site are for education purposes only.  They provide one firm’s insight on the markets.  Not investment advice.  See additional disclaimer here.

The Danger Point®, trade mark: No. 6,505,279
No ‘Soft Landing’ or ‘Hard Landing’

There’s Only, ‘Collapse’

The ‘narratives’ are false.

There’s no ‘recovery’, no ‘soft landing’, no ‘hard landing’.

There’s no ‘housing boom’, no ‘inflation’, and maybe most of all, no (sustainable) ‘Electrical Vehicle’ market.

What there is …. is ‘collapse’.

Collapsing food supply, collapsing economy, collapsing real estate, collapsing employment and collapsing (electrical grid) infrastructure.

How do we know that?

The price action (the market) itself, says so.

Wyckoff, The Rest, and Gold

As stated in the last update, unlike other analysis methods, Wyckoff looks at what the market is saying about itself.

The market itself, defines the next likely course of action.

Two days ago, gold was used as the example.

Contrary to the ZeroHedge report linked in the prior update, Wyckoff analysis revealed the most probable direction for gold, was down.

The Gold (GLD) Market

The Fed announcement late Wednesday, resulted in a ‘blip’ higher for gold that stalled-out, the next day.

However, that announcement, may have confirmed a trend change in GLD.

Looking at the chart below, it’s possible that Wednesday identified a more aggressive trendline, lower.

Gold (GLD), Daily

It’s about an hour after the open.

This is how it looks for GLD.

The new trendline and trading channel are clear; trending lower at approximately -60%, annualized.

The next chart is a zoom of the pivot area.

If there ever was going to be a Fed ‘Pivot’, this was it. 🙂

The price increases being touted as ‘inflation’ are clearly the result of supply destruction.

You can’t have 90+ ‘food processing plant fires’ in the past year or so and not have it affect prices at the supermarket.

Same goes for crop failures or lack of harvest world-wide.

Summary

As always, anything can happen. Gold could reverse and mount some kind of rally.

If somehow, there’s a change of demand, it will show up on the tape (the chart) as a change of character.

So far, there is none.

Most likely direction remains to lower levels.

Parting Shot

Just to illustrate the point of ‘collapse’, we’ll leave off with this recent report from Scott Walters.

The real estate example shown is the River Oaks area of Houston … Highly affluent.

There’s no debate.

It’s a collapse, when a house has to drop $20 million, from $26.5-mil to $6.5-mil, and Still Not Sell!

Stay Tuned

Charts by StockCharts

Note:  Posts on this site are for education purposes only.  They provide one firm’s insight on the markets.  Not investment advice.  See additional disclaimer here.

The Danger Point®, trade mark: No. 6,505,279