Everything Happening At Once?

Not in any particular order; not advice and not a recommendation.
No 1. There (still) is no Fed Pivot. Seriously, have rates really, actually been lowered? Everyone has a huge case of ‘normalcy bias’. i.e., what the Fed did last time will happen this time.
The 40-year bond bull market from the 80’s, ended in 2020. We’re in a different paradigm now.
No. 2 Natual Gas UNG, is reversing. We’ll see whether or not there’s going to be a supply disruption.
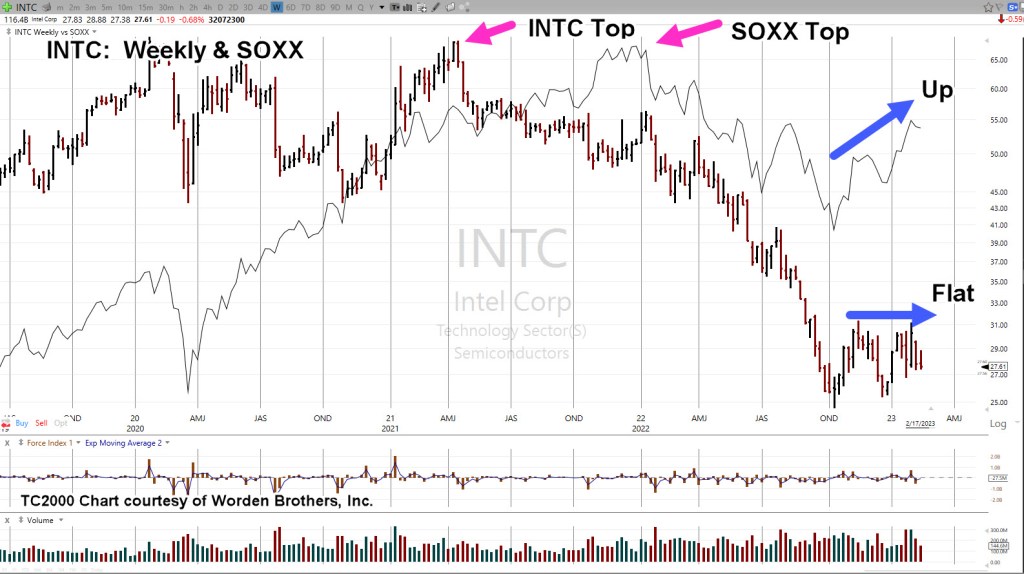
No. 3 The semiconductors SOXX, now have a monthly bearish MACD divergence; daily and the weekly indicators posting even to prior tops (as of Friday’s close).
No. 4 Components of biotech index XBI, are being shuffled around faster than deck chairs on the Titanic … or, the Olympic 🙂
Seems like a mad dash to add/remove, increase, reduce equities to prop things up. We’ll see how that turns out. Currently, XBI is right at resistance level, 86.50 – 87.0
Here’s just one example from an index, riddled with equities that have no P/E.
No. 5 Carvana is very close to posting new highs and potentially, running the stops.
No. 6 Has Darden Restaurants, topped out?
The consumer is certainly tapped-out and no-one ‘needs’ a restaurant.
No. 7 Wheat is reversing; It is and has always been about the food supply.
No. 8 Gold, GLD, is currently not going higher (look at the divergences); silver (SLV) is in a major non-confirmation, down nearly – 55%, from all-time highs.
During the 1980s inflation, precious metals moved (upward) together.
Silver looks like it’s responding to the destruction/collapse of (economic) demand.
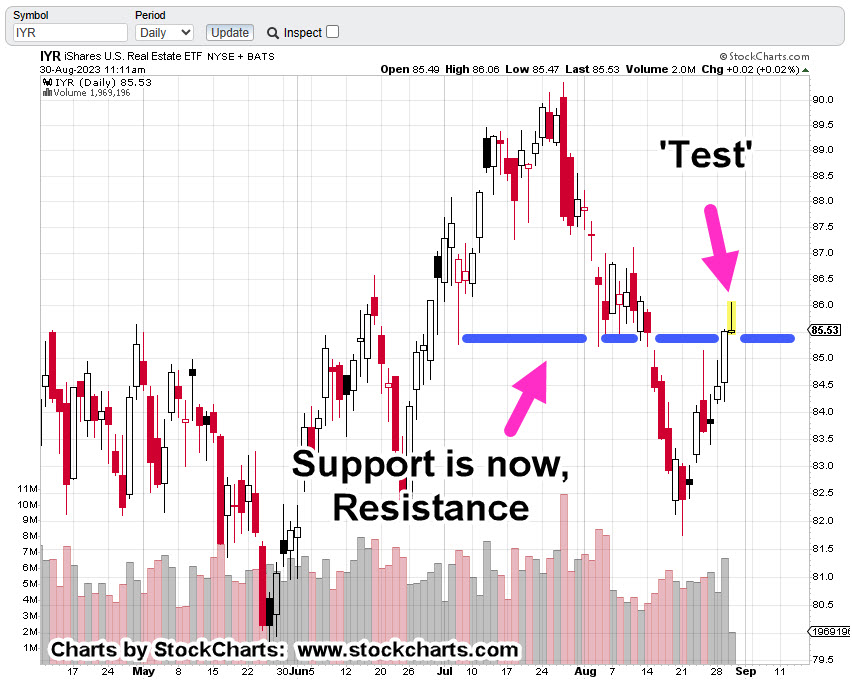
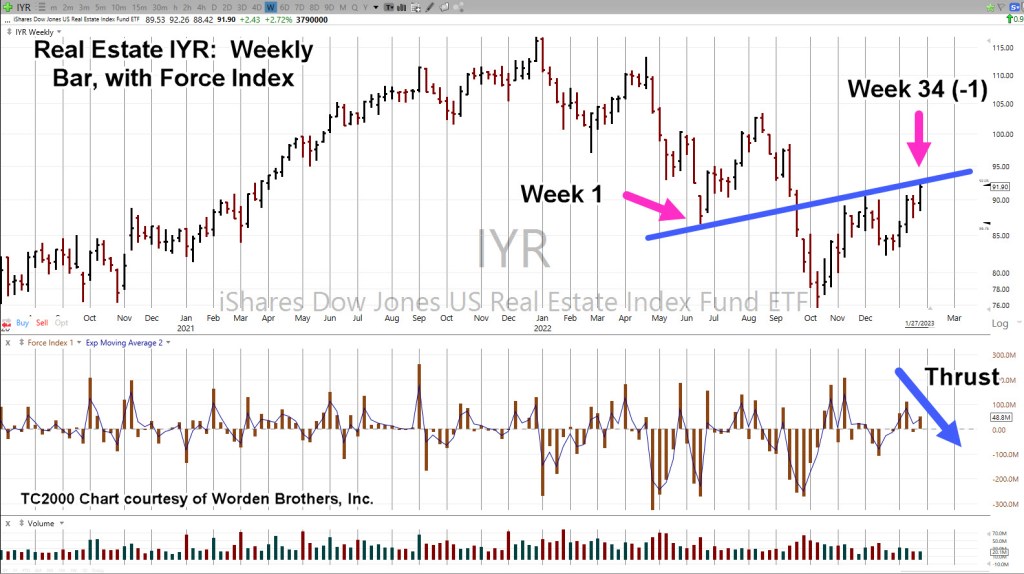
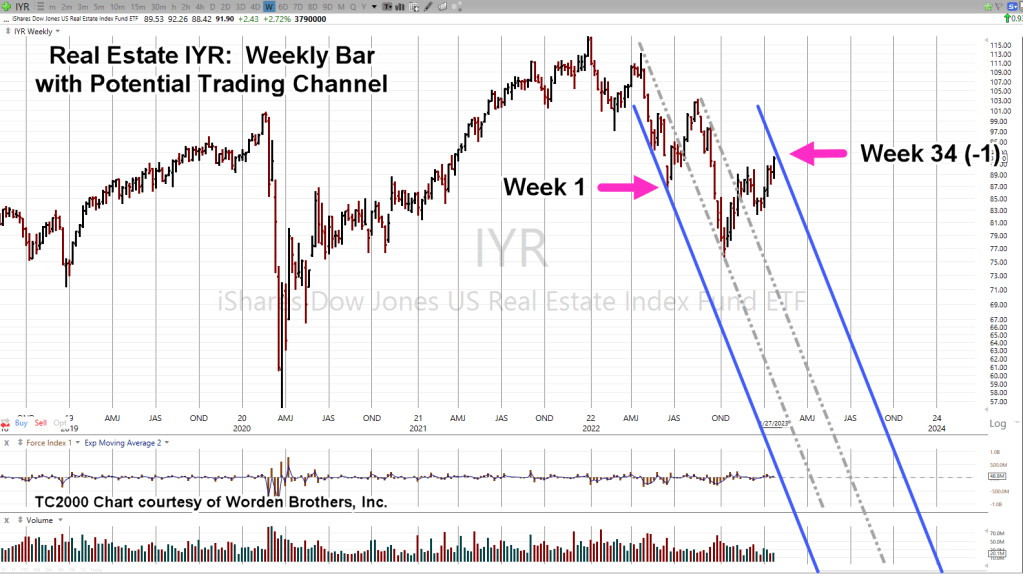
No. 9 American Tower (AMT), number two in the IYR index, posts a clear false breakout and reversal.
If rates really are going (materially) lower, interest rate sensitive real estate should continue going higher, right?
No. 10 Which brings us to the bond market, TLT.

Price action broke above established resistance, currently hovering above that level.
It’s at The Danger Point®
We can see the set-up, a price action pattern repeated time and again, between the lower and upper blue lines, called a ‘Spring-to-Up-Thrust.
While the media laughs at the bears, let’s just see how this all works out.
Stay Tuned
Charts by StockCharts
Note: Posts on this site are for education purposes only. They provide one firm’s insight on the markets. Not investment advice. See additional disclaimer here.
The Danger Point®, trade mark: No. 6,505,279