Carvana, launched itself above resistance at Friday’s close. In so doing, got itself into another wedge.
Now we have Expedia, looking eerily similar (not advice, not a recommendation).
Like eBay, we’ll start with the long term, quarterly chart.
Expedia EXPE, Quarterly
The latest earnings release pushed EXPE up, contacting the upper trendline.
A gap higher and close of +17.55%, in one day.
EXPE has since backed off the all-time high; currently down about -8.5%.
Edge of The Wedge
The following is a partial list of tickers either forming a (monthly) terminating wedge, or have broken out to the downside (not advice, not a recommendation)
Note: Posts on this site are for education purposes only. They provide one firm’s insight on the markets. Not investment advice. See additional disclaimer here.
Note: Posts on this site are for education purposes only. They provide one firm’s insight on the markets. Not investment advice. See additional disclaimer here.
Note: Posts on this site are for education purposes only. They provide one firm’s insight on the markets. Not investment advice. See additional disclaimer here.
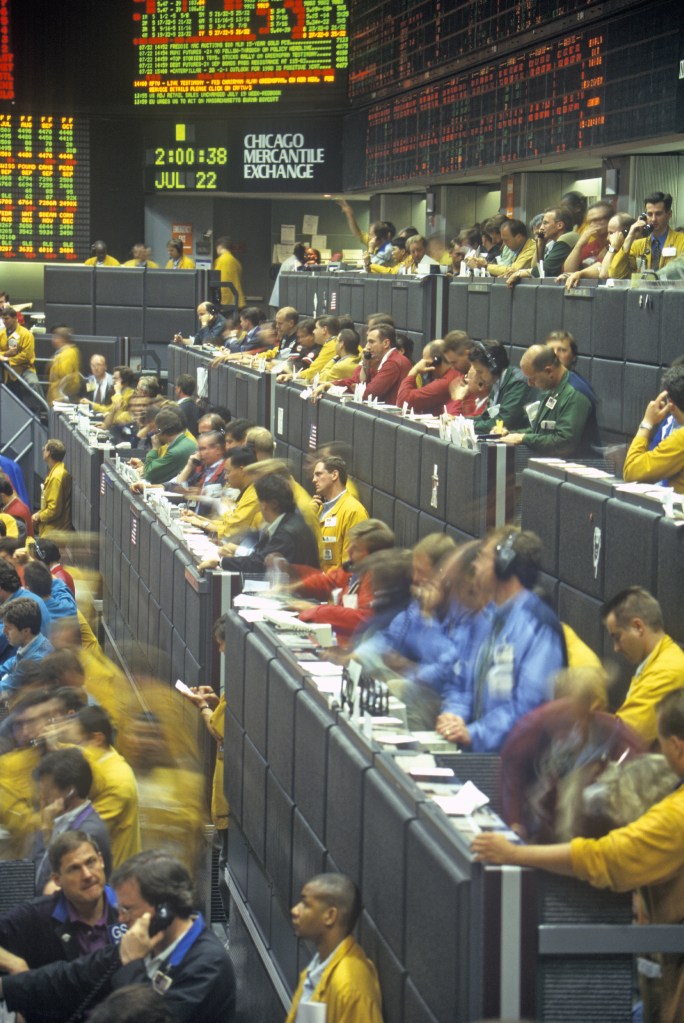
That was Jesse Livermore’s assessment of the market just before The Panic of 1907.
That Was, Then
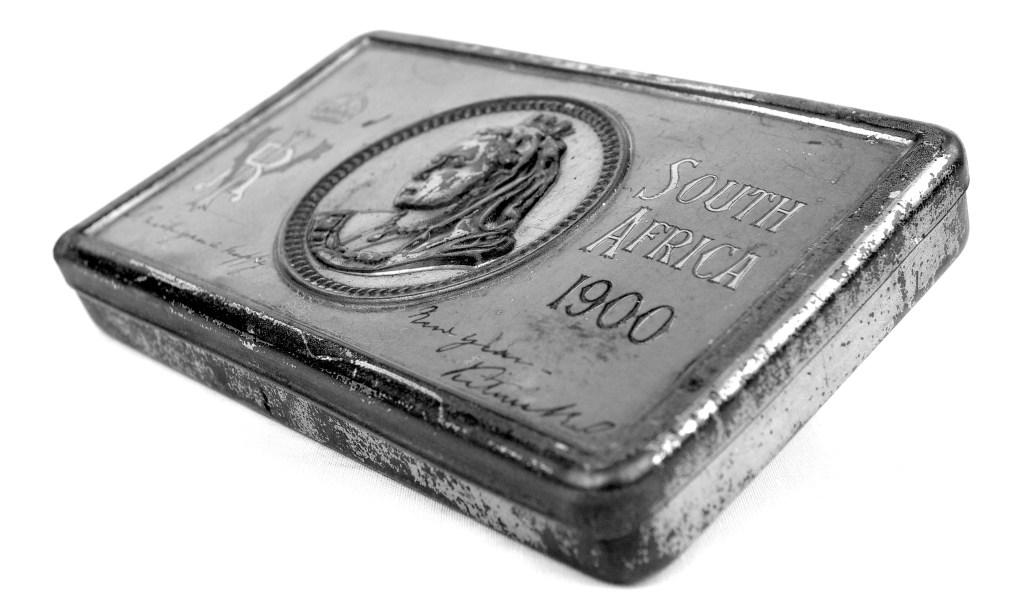
Back then, it was money spent on The Boer War, tight financial conditions and extreme overvaluations.
Looks more and more, like today
It’s been this site’s opinion for about a year (now supported by data), that we’ve gone straight past recession, into economic collapse and depression.
And Now, This
Another data point confirming the ‘depression’ scenario is this, just out from ZeroHedge: The Baltic Dry Index had its largest one-day collapse on record.
As if to drive it home; demand is in free-fall as Amazon, just announced plans to fire 18,000 workers.
From a strategic standpoint, collapsing shipping demand means collapsing fuel demand.
Which brings us to the sector of the day, Oil & Gas
Oil & Gas Sector XOP, Weekly
The last update, showed the weekly chart has reversed down and stayed down.
XOP is penetrating support, now at The Danger Point®.
The daily chart has more detail; we’re hovering at support, testing the right side trendline (again).
Providing some (minor) upward bias for the day is this report on WTI (West Texas Intermediate).
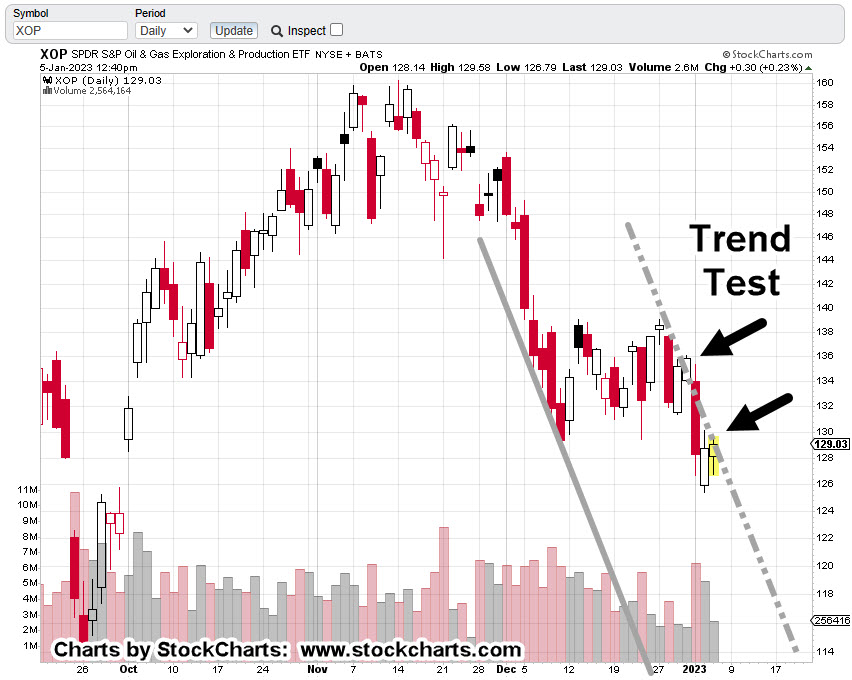
Oil & Gas Sector XOP, Daily
It’s 1:31 p.m., EST and XOP, has not posted a new daily high (it’s very close).
Doing so, would weaken the downtrend case and point probabilities to a Wyckoff spring move higher.
Summary
Demand is rapidly collapsing on many fronts and the WTI report linked above uses the word ‘tepid’.
That may be completely inaccurate or misleading when considering the demand for shipping has seen its worst down-day, on record.
Note: Posts on this site are for education purposes only. They provide one firm’s insight on the markets. Not investment advice. See additional disclaimer here.
Pick up almost any trading book like Reminiscences of a Stock Operator, and you’ll find, the big money was made on the downside.
In Livermore’s case from ‘Reminiscences’, he saw a big crash coming, went short in a big way, and was then squeezed out of his positions during market rallies in 1906.
The short trades were too early; he blew up his account.
Undaunted, he took drastic measures to raise capital (hawked his car), got back in, shorted, and cleared over $1-milllion in profits near the bottom on October 24th, 1907.
The Ukraine War & The Boer War
As spectacular as his profits were, for us that might not be the most important part.
Take a look at the list below, paraphrased from Livermore’s account of The Boer War and overall economic conditions; see if it doesn’t match up to today.
The British were just coming off the Boer war, having spent hundreds of billions (in today’s Pound-Sterling), and money was tight.
There was significant wealth destruction world-wide.
The San Fransico earthquake of 1906, was causing economic disruption and the need for even more cash.
Note: As reported here, seismic activity is picking up. We’ve just had a major quake (again) in California.
There were plenty of warnings of an impending collapse but as Livermore puts it, the masses paid no heed as they were more concerned with baseball.
Fabrication & Fact
There’s some scuttlebutt, The Panic of 1907, was a fabricated event, used to usher in fractional reserve banking.
Is this all starting to sound familiar?
Now, we have the potential of Neo Feudalism, going right along with Universal Basic Income and Digital Currency.
That should be enough intro to get us to the chart at hand, Real Estate IYR, but first, this just out, on MarketWatch:
Worst Year, Since 2008.
It’s already the worst since 2008, and as Jerimiah Babe puts it, ‘we haven’t even got started’.
Reference time stamp 12:07, in the link and see if it does not match exactly with Livermore’s observations.
All of which brings us to real estate.
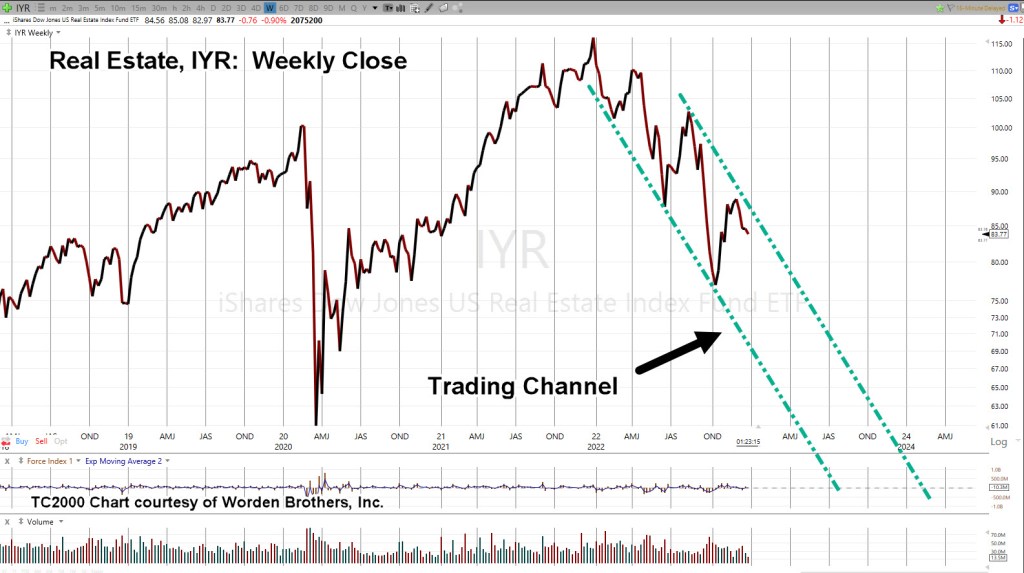
Real Estate IYR Weekly, Close
The chart shows the most conservative (modestly declining) trading channel
The next chart, is where it gets scary.
The second (potential) channel is declining at approximately -62%, on an annualized basis.
Weekly timeframes are presented here on purpose.
Doing so, gets us away from the everyday, every blip, analysis and looks at things strategically. It’s obvious, barring some kind of intervention, real estate’s in trouble.
The January of No Effect
It’s well known, stocks tend to rise in the first weeks of January. Tax loss selling is over and there’s typically some type of ‘relief’.
Don’t count on it this time (not advice, not a recommendation).
Even as this post is being created, IYR, is pivoting lower and possibly confirming the more aggressive right-side trendline (second chart, above).
Summary
We’ll end with more paraphrase from Livermore’s account of the panic.
He describes being in Ed Harding’s office (his broker), telling him that ‘now is the time’, ‘today is the day’. All the while, stocks were drifting, everything was quiet.
Livermore said to Harding:
‘The longer that stocks delayed, the bigger the break will be when it comes.’
Let’s see if that applies to us, exactly 100-years later (Reminiscences, published in 1923).
Note: Posts on this site are for education purposes only. They provide one firm’s insight on the markets. Not investment advice. See additional disclaimer here.
Note: Posts on this site are for education purposes only. They provide one firm’s insight on the markets. Not investment advice. See additional disclaimer here.
Everyone talks a big game, wanting to trade like the next Jesse Livermore or James R. Keene.
To aspire and reach the performance level of the legendary, few know, it’s almost a requirement that several fortunes must be won and lost along the way.
That’s why Prechter said it years ago (paraphrasing), ‘It’s best to lose your first fortunes early; that way, you have time to recover.’
One very public and famous ‘recovery’ from a blown account, was Livermore’s trade during The Panic of 1907.
He was flat broke but sensed a big down move about to happen in the markets.
Legend has it, he pawned his car for $5,000; then, using that capital, shorted the market during the panic and profited over $1 million, covering shorts near the bottom.
That was then. Is there a now?
The short answer is yes. Huge moves (especially down) are still a potential.
Let’s take a look at how one opportunity presented itself.
Big Move Characteristics
There are at least three characteristics for a major move:
Price Extreme
Sentiment
Catalyst
To demonstrate how that criteria can be used, we’re going to use one very recent example:
The Carvana Crash
From the all-time CVNA, high of 376.83, set on August 10th, 2021, to the most recent lows (thus far) posted July 14th, this year, was a collapse over -94.8%.
“If your biggest claim to fame is that you ‘invented’ a vending machine … you’ve got real problems.”
With that, and hovering at nearly $380/share, it’s reasonable to say CVNA, had reached an extreme.
Sentiment
To go along with the price and no earnings was the sentiment … literally off the charts.
Used cars, years old, selling above the original MSRP. It was a never-before-seen event.
From a trading standpoint, it does not matter the ‘reason’ for the sentiment; only that the extreme was there.
Catalyst
Now, the hard part. The ‘catalyst’.
Just what was it that pricked the bubble for CVNA?
For our example, it looks like it was one sub-par earnings release too many. At the time of release, there was a subtle change in the character of price action.
About one week after the earnings release in August 2021, CVNA, broke a long-term trendline and never looked back.
Summary
The above example has been highly simplified for brevity.
Even so, we can still use these criteria to look at other market conditions … other sectors.
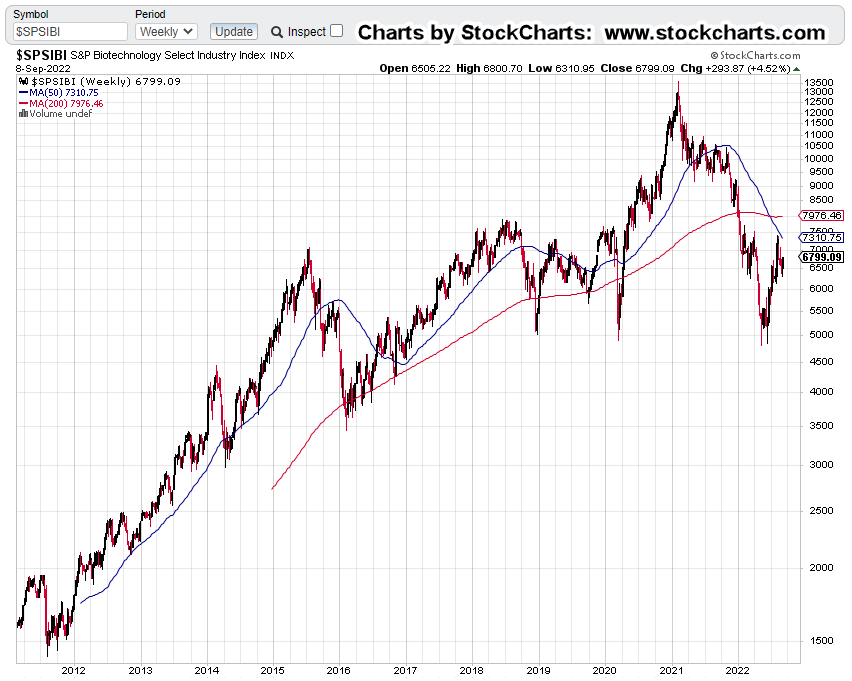
As you may have guessed, one sector that meets at least two of the above conditions, is biotech, SPBIO.
The third (Catalyst) condition may have been met this past week on August 3rd, with this report. Another link is here.
The take-over candidate GBT, releases earnings on Monday (tomorrow).
Note: Posts on this site are for education purposes only. They provide one firm’s insight on the markets. Not investment advice. See additional disclaimer here.
We have four more trading days until the end of the Third Quarter. It’s unlikely that biotech (SPBIO) is going to make a new quarterly high.
This morning’s early action has LABD (3X inverse SPBIO) essentially unchanged to slightly lower; higher for SPBIO.
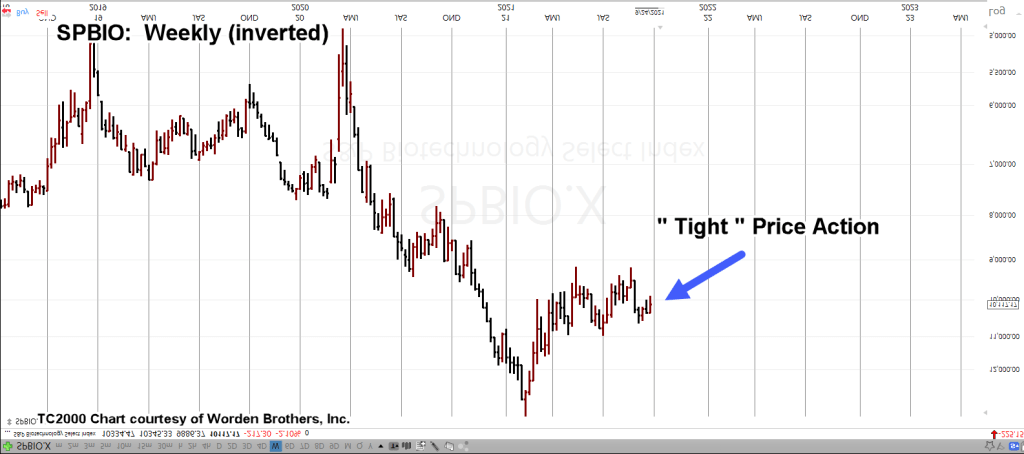
The weekly chart of SPBIO, above, has been inverted to mimic the inverse fund LABD … but without the tracking (bias) errors.
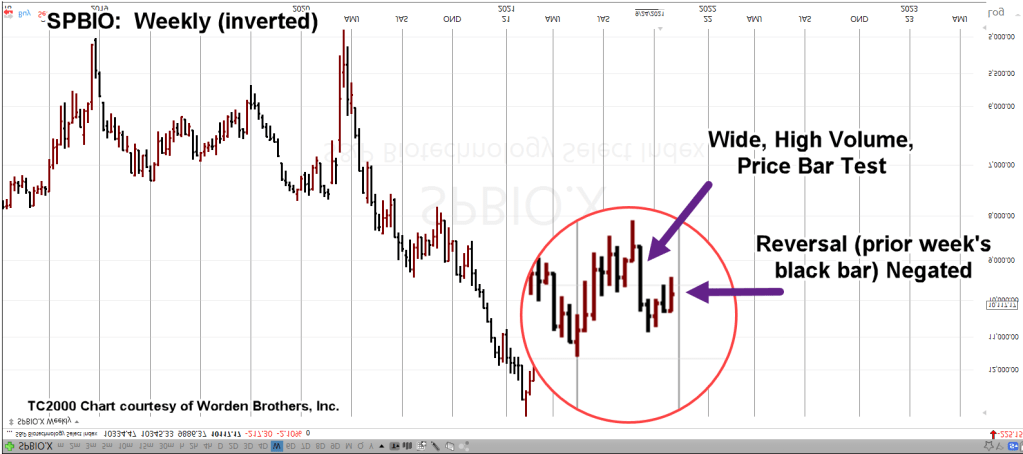
The “tight” area of action has been expanded in the next chart:
We can see the wide, high volume bar from the week of 8/27, is being tested by the subsequent weeks and their upward action.
This is normal market behavior that has probably been repeating itself since the buttonwood tree.
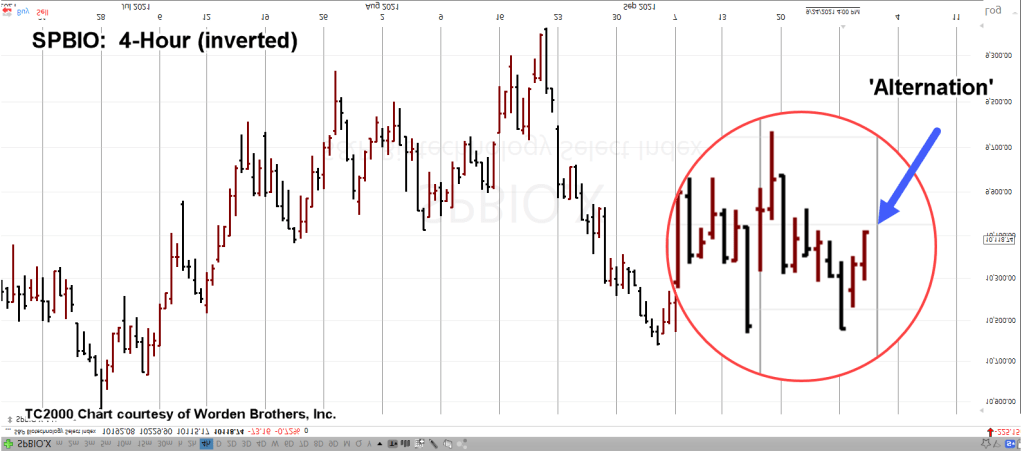
Alternating Action:
The difference this time around, we’ve already had the ‘low to upward thrust’ (for LABD) that was negated last week with a test.
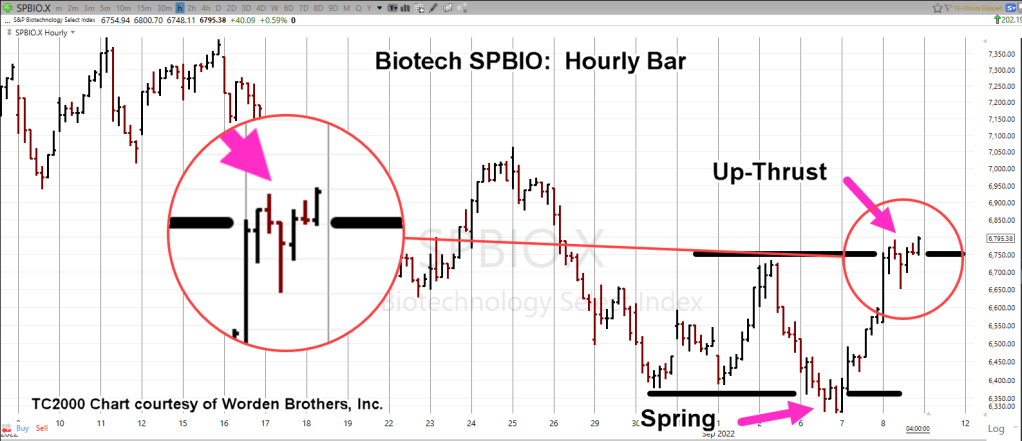
That test has now reversed as seen on the 4-Hour chart (inverted SPBIO) below:
Both downward thrusts (September 17th, and 23rd) finished the day at or near their session lows.
The ‘rule of alternation’, from Prechter’s Elliott Wave discussions, essentially says that; what happened last time, will not happen this time.
That leaves two scenarios for SPBIO and LABD.
Scenario, No. 1
SPBIO reverses from here and goes on to make new daily, weekly highs.
Scenario, No. 2
SPBIO continues its downward reversal into the next leg lower; potentially to the Fibonacci projection target (not shown) of 161.8%.
That would put SPBIO, at or near the 3,873 level … a decline of nearly 62%, from last Friday’s close.
Force Index:
Since the inverse fund LABD is heavily traded (2mil – 3mil, shares per day), we can use it as a good indicator of professional trader commitment
I say ‘professional’ because, as incredible as it may seem, the majority of market participants (the amateurs) do not understand or can’t grasp the concept, the big money is made on the downside.
The trading books that regale stories of massive gains, were typically trades to the downside … probably the most famous of which, was Livermore’s well documented short position during The Panic of 1907.
I’ve even talked to a former broker (for a firm that has 15,000 locations nationwide) who asked me when I was discussing the markets (and I quote): “What’s an inverse fund?”
I kid you not.
As touched on yesterday with Random Notes, the level of complacency, stupidity and ignorance has reached levels that are not going to be repeated in our lifetimes.
Market participants are either going to be wiped-out … or they’re going to get very smart, very fast.
I’m personally going with the ‘wiped-out’ scenario as it’s extremely difficult to come up to speed on a complicated topic (reading price action) while your account is being decimated.
Which brings us to the Force-Index chart of LABD:
This chart’s a little different than the rest.
The Force Index section (the lower panel) has been expanded to show the nuances of thrust action.
Even all the way back to the major thrust lower on August 23rd, we can see, downward thrust energy has been dissipating.
Recently, as shown with the blue arrow, downward thrust has evaporated altogether.
Summary:
It appears from the 4-Hour chart of LABD, we’re potentially at a major point of inflection (not advice, not a recommendation).
The rest of the indices (except the miners) are at or near their all time highs … with valuations (P/E ratios) stretched to the highest on record; going all the way back to 1962, if memory serves.
SPBIO is the only major index that’s about to post three down quarters in a row.
Obviously we’re short this sector via LABD (not advice, not a recommendation) with the understanding that anything can happen.
This market (SPBIO) along with the others could reverse and move to new highs.
However, at this juncture, it looks like the air’s coming out of biotech … slowly, at first.
Stay Tuned
Note: Posts on this site are for education purposes only. They provide one firm’s insight on the markets. Not investment advice. See additional disclaimer here.
‘The real money’s going to be made, after the plug is pulled’
Well, that’s close.
Actually, the real money’s made on the way down … when the plug is pulled … not after.
‘After’, is when you take the huge gains from the short side and then allocate that to areas which stand to recover … or at least have a good chance of recovery.
It’s a two-step process:
Nobody demonstrated that better than Livermore himself during the panic of 1907.
It’s probably no surprise that panic was potentially a fabricated event (sound familiar?).
Titanic engineering design approval: July of 1908.
Construction begins: March 1909.
Sea trials: Early April, 1912
Titanic ‘sinks’: April 15, 1912.
April 15th, is tax day … coincidence … no.
Whether or not there really is a ship (or which one is) at the bottom of the Atlantic, is immaterial.
What’s important, was that it all may have been a controlled demolition of the financial system so that it cold be ‘reset’ to allow fractional reserve banking.
The fly in the ointment? Unexpectedly, Livermore owned the market at the bottom. He could have single handedly destroyed the financial system by executing more short selling.
That’s when J.P. Morgan (possibly chief cook and bottle washer for the ‘reset’) called him in to appeal to Livermore’s ‘patriotism’; to not destroy the market. You can’t make this stuff up.
So, it’s time to reset the system every hundred years or so.
Just like it’s time to have a medical ‘incident’ and reduce the population every hundred years or so:
How does this relate to the markets? For this update, the preamble above, brings us to gold (GLD):
Gold (GLD) Analysis:
It’s no secret, price action in GLD and the miners (GDX, GDXJ), has been analyzed for months as bearish.
The weekly chart shows GLD, right at the edge of a terminating wedge; about to break lower:
The measured move … to around GLD ~ 120, is exactly at the Fibonacci 161.8%, projection (not shown).
If there’s a wedge breakdown, we have two separate measurement techniques targeting the same area.
Gold (GLD) did break lower but has not progressed to the measured move. Latest update is here and here.
The next chess move, is probably not going to be dollar destruction.
No. The next move is likely to be as stated before, supply chain shut-down with the objective of ‘starve them out’.
Correct but not the way the media plays it.
They attempt to tie it to ‘climate change‘. Yes, the climate is changing but the earth is getting colder, not warmer. Crop failures are the result.
Couple that with intentional weather modification (weaponization), controlled demolition of the supply chain and voila! Food becomes scarce or more expensive or both.
In a prior update, when that statement was made, it may have sounded extreme. Now, we have this interview and time stamp (8:11), where we get the exact same thing.
Take Action:
This article, just out on ZeroHege is a good one-stop shop to start or continue being out in front of ‘events’.
Here’s a brief video of one man’s action, in action:
Four hens, a rooster, in an urban setting (houses on three sides).
The rooster was not part of the plan. If you look closely, you can see his ‘No Crow‘ collar … it works most of the time.
He was unexpected but is now seen as an asset.
He keeps the hens under control (otherwise, they fight) and gets them all back in the coop at night.
Is it a hassle: Yes.
Is it messy: Yes.
Will the neighbors not care about the crowing, be clamoring (and paying with cash, gold, silver) for eggs and chicks three months from now, if/when food shipments are cut off? Probably, yes
Mass recognition of potential famine to come in the spring when the farmers do not have enough ‘inputs’ (seed, fertilizer) for a viable crop.
Don’t forget about no spare parts for farm equipment.
Scaboo
The rooster, “Scaboo” was such a happy camper that he was crowing all day.
He was moved outside of town to a more rural location.
We still have access to him if needed for fertilized eggs.
Note: Posts on this site are for education purposes only. They provide one firm’s insight on the markets. Not investment advice. See additional disclaimer here.