Note: Posts on this site are for education purposes only. They provide one firm’s insight on the markets. Not investment advice. See additional disclaimer here.
With Twitter’s lifting of the ban on truth, linked here, we may be entering the next phase of collapse.
Whether or not it’s going to immediately show up in market price action, is unknown at this point.
Nascent Reversal?
The last update identified the markets were poised for potential reversal.
Two days later and we’re mostly down; that’s in spite of the supposed positive ‘machine’ bias as presented at this link.
A positive machine-market could still happen (data released tomorrow) but for now, price action itself, is posting lower; this is the crux of Wyckoff analysis … ‘What is the market saying about itself’.
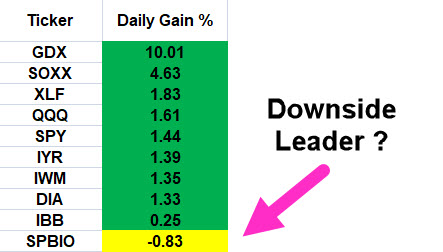
In line with the truth being let out, not surprisingly, chief cook and bottle washer, biotech, is having a rough time.
Biotech Bear Market
Prior posts have documented the bear flag that’s been forming for over nine-weeks. Now, we have an apparent coiled action, ready for the downside.
Since we’re short this sector via LABD (not advice, not a recommendation), we’re going to look at LABD, to identify the potential.
SPBIO, 3X Leveraged Inverse, LABD
We have three charts, all depicting daily action.
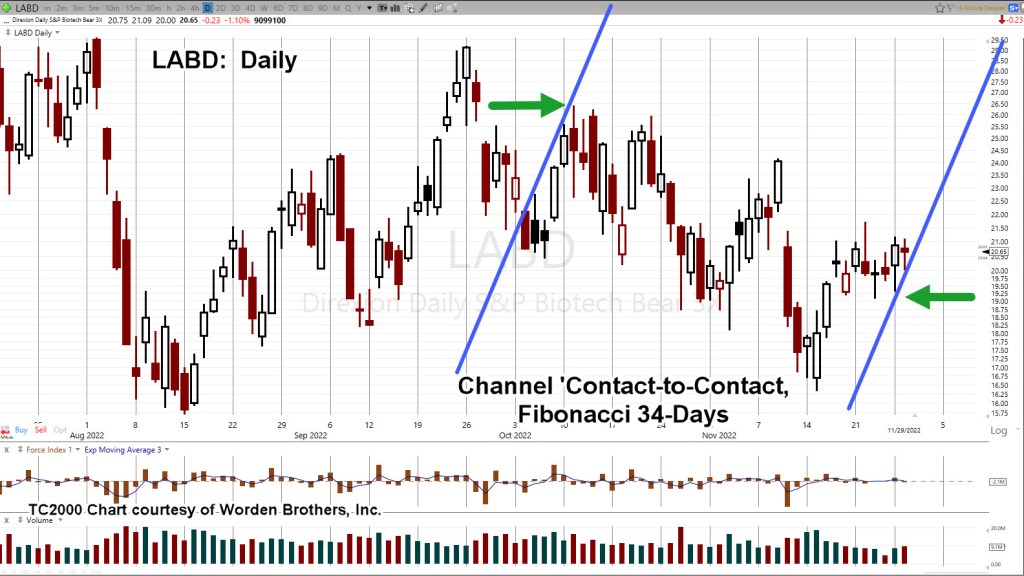
The first (un-marked) chart is close-in and it looks like a mess. That is, until you put in trend lines and a Fibonacci count as shown on the second chart.
Adding the mark-up.
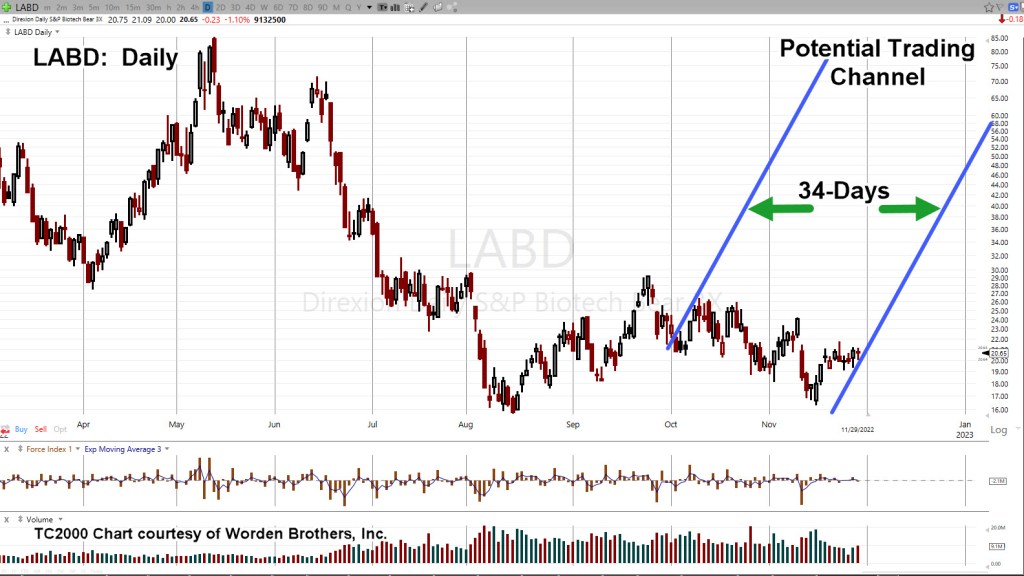
Then, keeping those trend lines intact, pulling farther out, we see the potential if there’s a sustained move.
Price action has been trading in a tight range over the past eight-days. Let’s see what happens next.
Positioning
Not advice, not a recommendation.
Short position in SPBIO via LABD; details are as follows:
LABD-22-12:
Entry @ 19.9194, 20.91***: Stop @ 19.28***
Note: Positions may be increased, decreased, entered, or exited at any time.
Note: Posts on this site are for education purposes only. They provide one firm’s insight on the markets. Not investment advice. See additional disclaimer here.
From a Wyckoff standpoint, we’ve identified one of, if not the sector(s) most likely to decline the farthest and fastest in a bear market.
Without question, biotech contains the overriding ‘elephant’ that’s literally affecting everything else on the planet (not advice, not a recommendation).
As stated in the tag-line above, the two indices in question are IBB (large cap) and SPBIO (small cap).
IBB, has Amgen, Gilead and Vertex, as the top three while SPBIO, has more speculative (i.e., losing more money) Beam, Twist and Fate.
Index IBB has $342.8-Bil, combined for the top three while SPBIO has only $6.5-Bil, combined.
So, it makes sense the more speculative ‘cash burning inferno‘ TWST, is in the SPBIO. 🙂
On to the charts
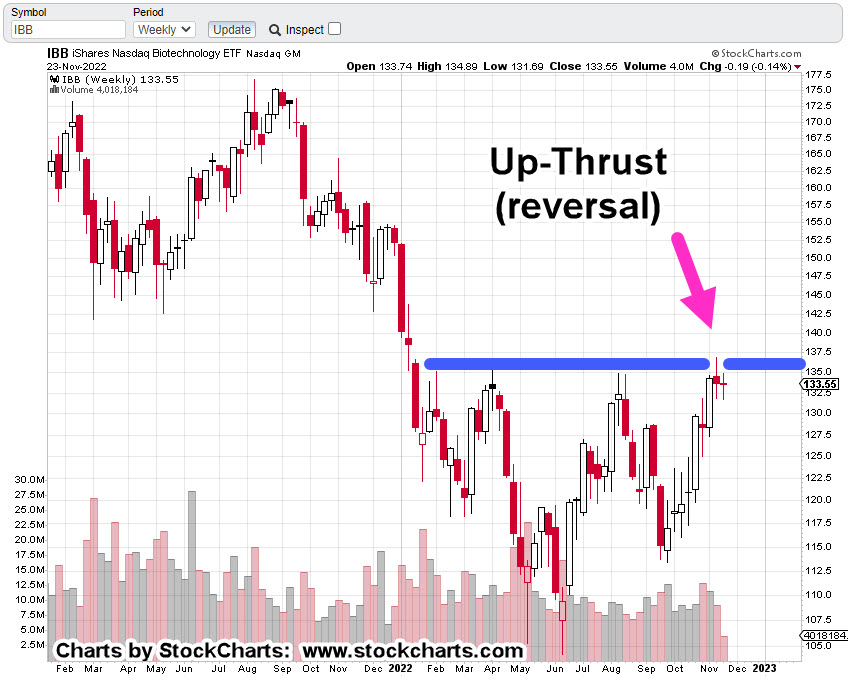
IBB Weekly
IBB has formed a decisive resistance area as shown.
The fourth attempt which pushed above the prior three levels (and retraced), puts IBB, at The Danger Point®
Next up is the SPBIO.
It’s much weaker and thus the focus for any short opportunities (not advice, not a recommendation).
SPBIO ($SPSIBI), Weekly
While IBB, has moved higher, to an up-thrust over the past nine weeks, SPBIO during that time, has languished.
Note: The chart scales are identical. Scrolling up and down, one can visually see the weakness of SPBIO.
SPBIO, also reached all-time highs, six months before IBB.
Getting Closer-In: SPBIO
We’re going to look at the hourly chart.
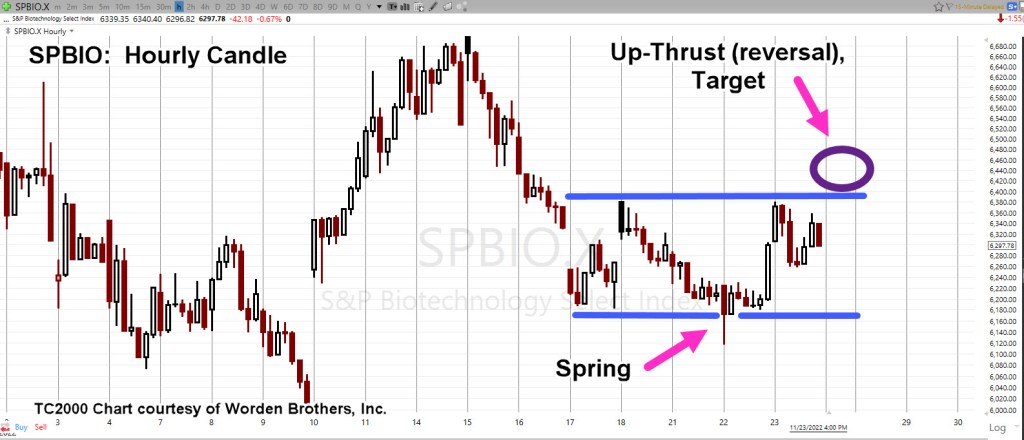
SPBIO, Hourly
Those who are long-time visitors to this site will instantly recognize the set-up: ‘Spring-to-Up-Thrust‘
This Friday, tomorrow, is a shortened trading day.
There’s a potential we’ll have a small blip higher into the up-thrust zone.
Conversely, for 3X Leveraged Inverse Fund LABD, the potential is for a temporary move lower.
Leveraged Inverse LABD, Hourly
This is how it looks for LABD.
Note for the inverse fund, the ‘spring’ on SPBIO, becomes the ‘up-thrust’ on LABD.
Positioning
Not advice, not a recommendation
Wednesday’s downside action in LABD, resulted in the LABD-22-10, position being stopped out with an overall gain around 7.12%.
There have already been several disruptions to the company’s trading platform and data line over the past month and we’ve not even got started with market chaos.
Recall that just recently, the Canadian market went off-line for several hours. We should consider these events the ‘norm’, on a go-forward basis.
As a result, a standing order (in the market) is in place to go long LABD (short SPBIO) at the execution price of LABD @ 18.62.
That order may or may not be modified as we go into the open tomorrow morning.
Note: Posts on this site are for education purposes only. They provide one firm’s insight on the markets. Not investment advice. See additional disclaimer here.
Note: Posts on this site are for education purposes only. They provide one firm’s insight on the markets. Not investment advice. See additional disclaimer here.
There’re a lot of moving parts to biotech and it’s like a game of chicken.
Is there going to be another ‘planned’ event pulled out of the bag that requires ‘protection’ or will this side (and this one) win-out before that happens?
Price action’s always the final arbiter and right now, it’s positing lower.
Gold:
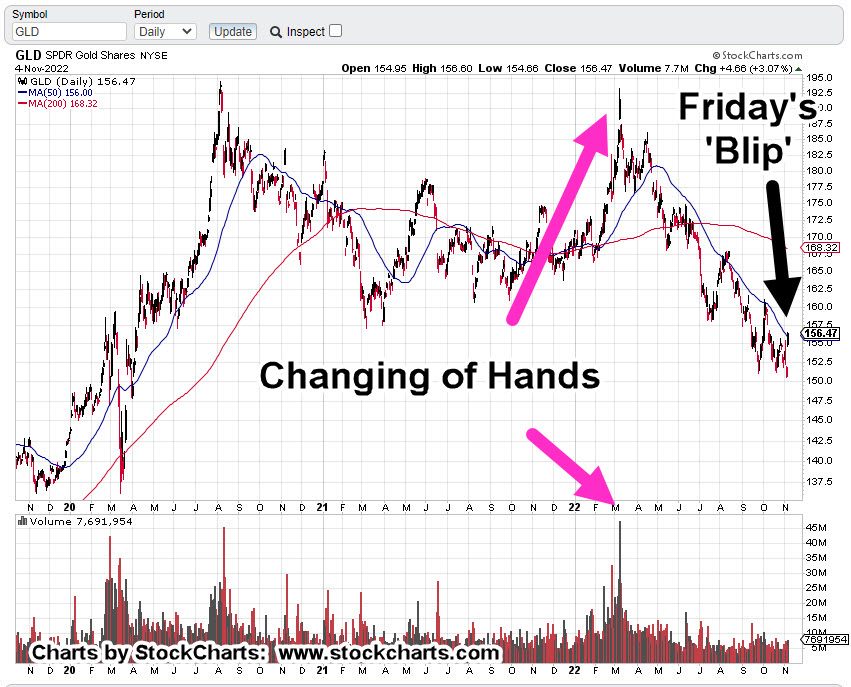
Gold (GLD) ‘blipped’ higher on Friday and the usual suspects are out touting the hyperinflation narrative.
Owning (some) precious metals seems to be a good thing.
However, the public constantly knee-jerks into this sector and is absolutely rabid in their behavior (i.e., silver stockpiles are running out!!!).
It suggests at least, there’s something else afoot.
Prechter published in the early 2000’s, Central Banks, are followers, not leaders. The fact they are buying gold at this point, may be a contrary indicator.
Talk about going against the herd. 🙂
Over and again, it’s the boring (does not generate ‘clicks’) food supply first, then gold and silver (not advice, not a recommendation).
Real Estate:
What can be said?
It’s the largest manufactured bubble in world history and it has already popped.
Thinking it’s all going to sort itself out in a year or two is delusional. We’ve probably got decades of bear market.
Tesla:
Anyone with an anode of research capability, knows the whole EV premise, is based on a falsehood.
However, that fact is probably not what’s going to bring Tesla (and the rest of the market) down.
Let’s stop for a moment and consider the above link which has been available for nearly four-years.
How many views? Just 9,824 (as of this post)
That equates to only 0.003% of the U.S. population.
As the global supply chains implode, getting parts and having stable infrastructure (i.e., electricity) will probably be the defining factor.
Now, on to the charts.
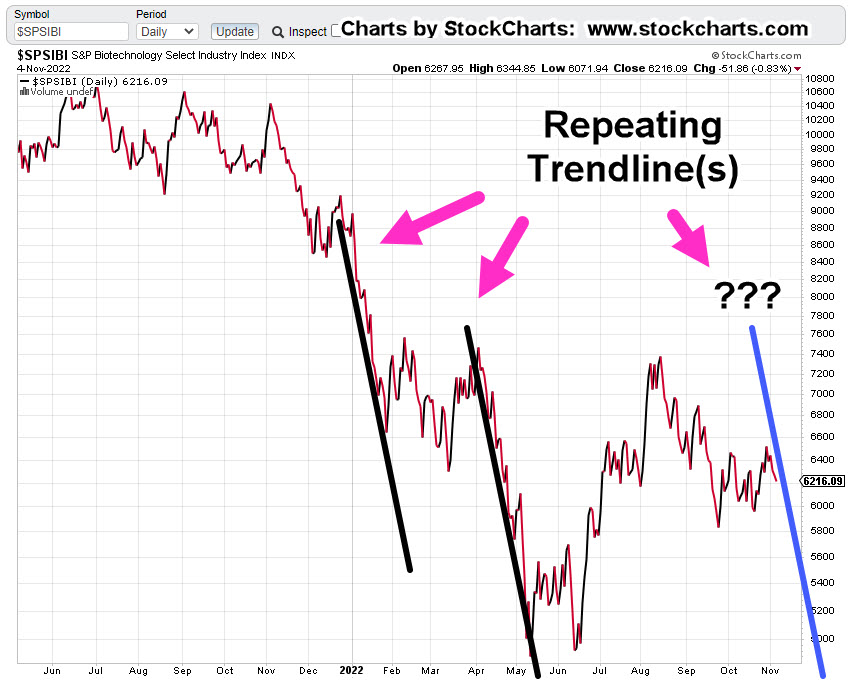
Biotech SPBIO, Daily Close
The following sessions will let us know if we’re at the right edge of the downtrend line.
We’ve already had an up-thrust reversal and a test of that reversal. last Friday was lower … probabilities point down.
Gold GLD, Daily
Looking at the chart on the strategic, longer term, Friday’s blip is hardly noticeable. We’ve already presented how this could be a minor up-thrust (reversal) in itself.
To keep the upside intact, price action must remain and continue above current levels.
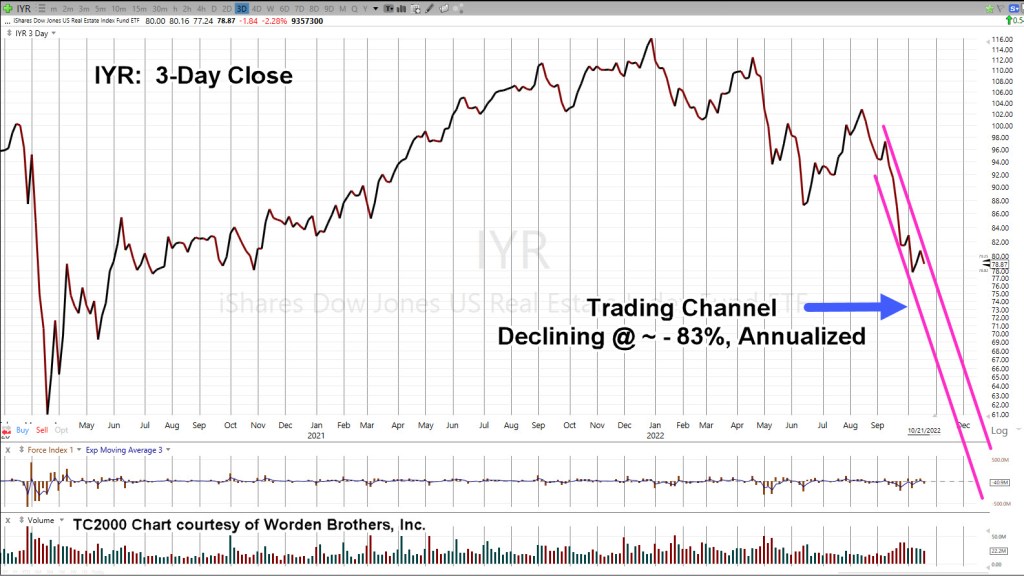
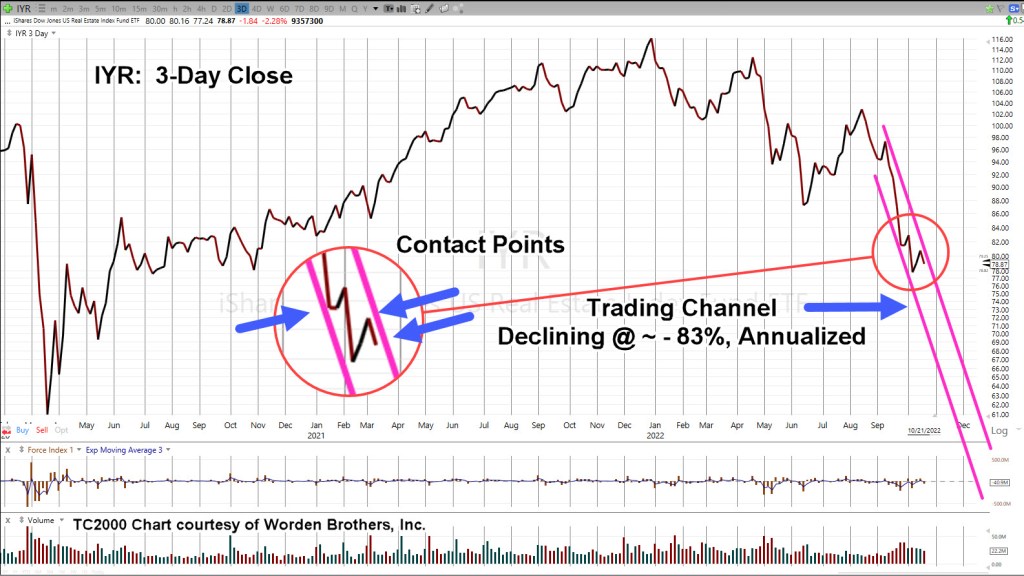
Real Estate IYR, Daily
Real estate may be working its way into an up-thrust condition. As shown, Fibonacci Day 21 from the October 13th, low is this coming Thursday, the 10th.
According to the Economic Calendar there are several potential catalysts that may push the price above resistance (temporarily).
Note: Posts on this site are for education purposes only. They provide one firm’s insight on the markets. Not investment advice. See additional disclaimer here.
In probably his best video update since he stared in early 2015, he lays out the details of what’s ahead.
Although not well versed in the markets (and he says so), he has enough experience, life-knowledge, to understand the current potential and likely outcome.
That is, ‘relentless collapse’.
Those of us who have been getting ready for years, know that we still aren’t ready. How can anyone be fully ready for a complete systems breakdown.
One ‘system’ that’s set for implosion and has been since before ‘The Speck’, is biotech.
Biotech: Cue The Implosion
It’s been an on again, off again, back on, and so on, with this index (SPBIO).
Every day now, sometimes multiple times a day, we see the effects of their ‘protection’. Wheels are in motion and we’re most likely just getting started … for decades to come.
Yesterday’s Fed announcement, may have (finally) provided the up-thrust and reversal needed to get this index in a sustained down move.
Biotech SPBIO, Daily Close
The daily chart shows the up-thrust test and reversal.
We’ll get into downside potential(s) in an upcoming post.
For now, the positioning remains unchanged (not advice, not a recommendation).
Positions, Market Stance (courtesy only, not advice).
TMF-22-01:
Entry @ 7.166, Stop @ 6.77
LABD-22-09:
Entry @ 19.88, 19.71, Stop @ 18.69
Note: Positions may be increased, decreased, entered, or exited at any time.
Note: Posts on this site are for education purposes only. They provide one firm’s insight on the markets. Not investment advice. See additional disclaimer here.
Not to be outdone, we have this ‘me too’ melt-up article as well.
Let’s not forget, all the ‘Fed must do something’ rumors and feigned concern by its members.
If anyone really wants to know the big picture, the overall plan (a wide majority do not), this interview may be the best explanation to-date.
With all of that, we certainly could get some kind of rally in the coming week. We’ll let the price action speak for itself.
As a reminder, Wyckoff analysis does not concern itself with press releases, rumors or ‘fundamentals’; Wyckoff himself, determined based on price action alone, they have no material effect on market movement.
In his words, ‘other forces are at work’, and it’s those forces that interest us.
Gold & Silver
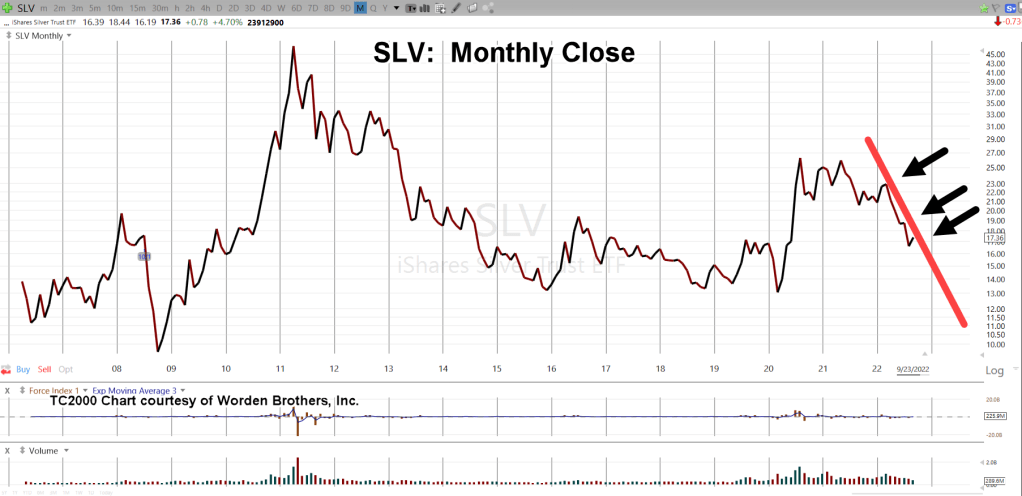
As said in this update, gold (GLD) was just ‘ticks’ away from posting a new monthly low. In fact, it got just 0.24-pts, from a new low before rebounding.
Of course, each time we get any kind of rally in the metals, there’s the usual hysteria. Even though for the past seven months and counting, those rallies occur at lower and lower levels … i.e., a bear market.
Shown below, it’s in a trading channel with price action at the right-side channel line.
Gold (GLD) Weekly
The chart below gets closer-in.
From left-most contact point on the channel to the initial contact on the right side is a Fibonacci 13-weeks.
Also note, the weekly high posted at the center line is a Fibonacci 5-weeks from the left-most contact.
Highly emotional markets tend to adhere to Fibonacci until either the emotion wears off or ‘everybody’ recognizes the structure.
Obviously, to keep the channel intact, a lower open (and lower action) at the next session is needed.
Looking at the daily chart of TLT below, Friday’s level of (down) volume has occurred only three times in the past three years.
Each time, there was a near immediate rebound or in the case of March 2021, the rebound came several weeks later.
Bonds (TLT) Daily
Moving in closer, we see the possibility of an ‘island-gap’ at the next open.
What could drive capital into the bond market?
Well, how about a ‘shock’ or continued market melt-down (not advice, not a recommendation).
A quick check of the local newsfeed (as of 12:45 p.m., EST) shows nothing on the horizon other than usual nuclear attack threats, power outages, child mutilation protests, marauding bears and the disarmament of Canadians.
Nothing to see here …
Real Estate
There is no mistake, events in real estate are happening at the fastest pace in recorded history.
As Scott Walters put it, over 10-million people bought into the ‘work from home’ hype and got themselves instantly (nearly) upside down in their transaction.
Note: Posts on this site are for education purposes only. They provide one firm’s insight on the markets. Not investment advice. See additional disclaimer here.
An immense flood of data; research reports, lawsuits, expose articles and anecdotal evidence; every day, multiple times a day, something new.
Has the biotech technical (finally) lined up with the fundamental?
Those fundamentals are farther down but first, we’ll discuss the technical.
As a reminder, sometimes charts are inverted during analysis. This ‘trick’ was discovered years ago and is based on techniques used by Dr. Alexander Elder.
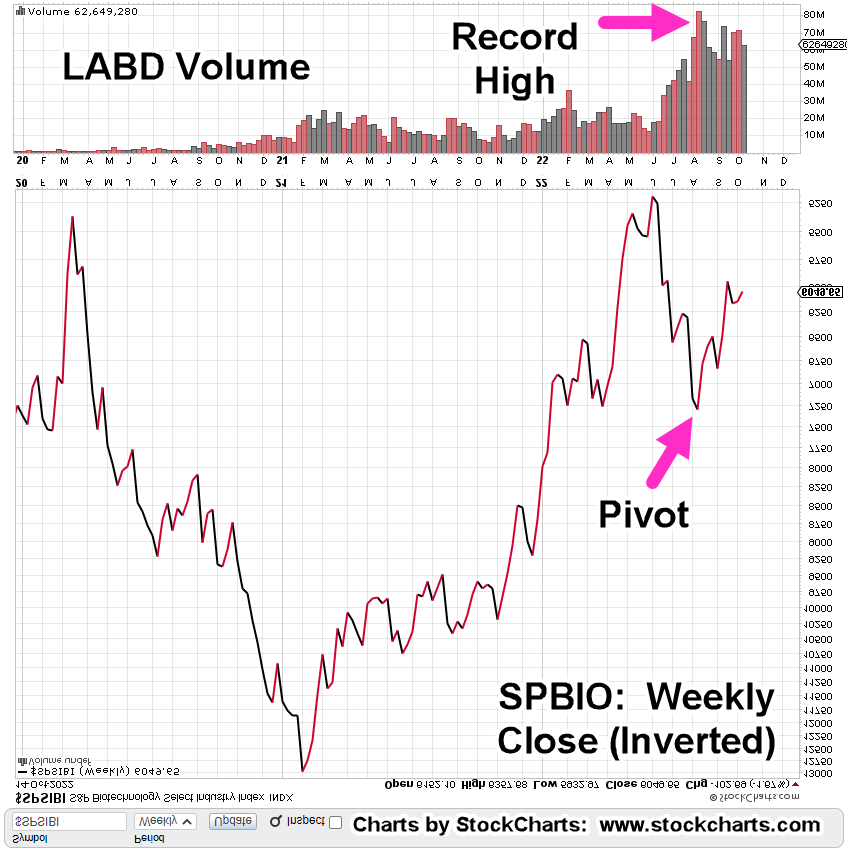
Biotech SPBIO, Weekly Close (Inverted)
We’ve taken the weekly closing chart of SPBIO ($SPSIBI, on StockCharts) and inverted it to mimic the action of inverse fund LABD.
The index has no volume; so LABD is used instead.
The magenta arrow shows the pivot point for the index, corresponds will all-time record volume on leveraged inverse LABD.
Next, we’ll get closer-in and look at the ‘pivot’ on the hourly chart (inverted).
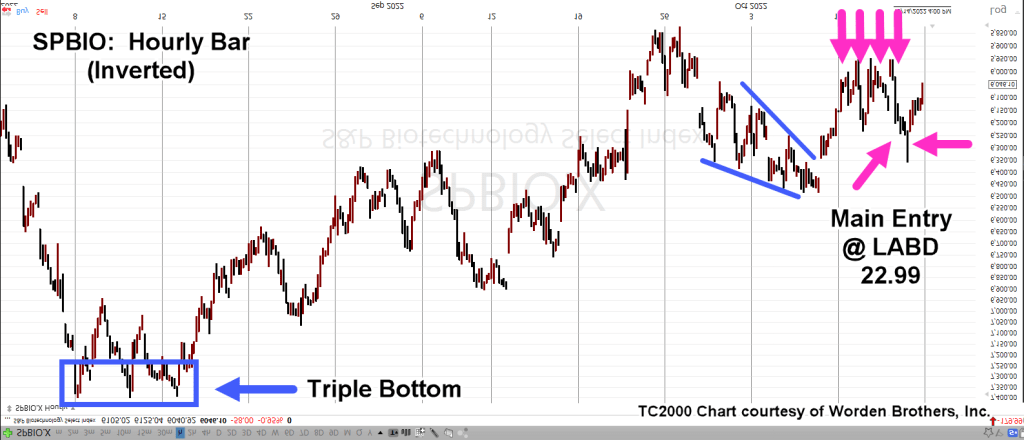
SPBIO, Hourly (Inverted).
The magenta arrows show successive positions (Livermore ‘probes’) entered (via LABD) before the main entry @ LABD 22.99, which was 90% of position size up to that point.
The next day (Friday) had a gap-lower open that was quickly reversed. Position size was increased by another 5%, at LABD 22.29 (not advice, not a recommendation).
Effective position equates to LABD 23.17
Price action pulled away steadily from the early morning levels, suggesting a sustainable reversal.
The Fundamentals
Some of this stuff, you just can’t make up.
Listed in somewhat chronological order, here they are (not an exhaustive list).
No. 1
Pfizer hires 600 to help document adverse events. Wasn’t it supposed to be ‘safe and effective’?
Note: Posts on this site are for education purposes only. They provide one firm’s insight on the markets. Not investment advice. See additional disclaimer here.
With TSLA, price action approaching The Danger Point®, that earnings release is likely to be a catalyst.
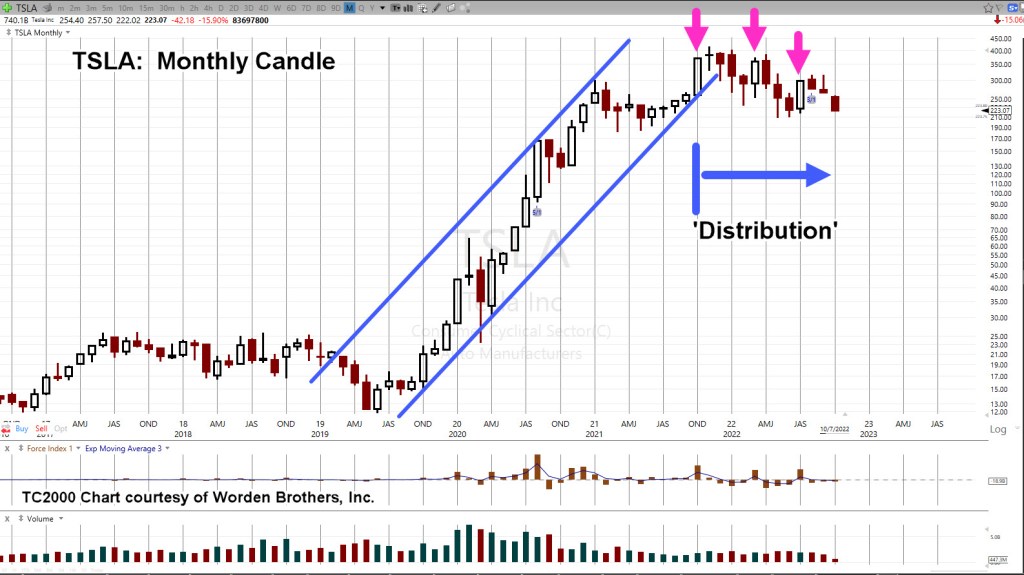
The monthly chart has the trendline (and channel) break along with the distribution phase.
Tesla TSLA, Monthly
Note, each thrust attempt higher (magenta arrows) has subsequently failed.
Thrusts following the first one, are at lower levels.
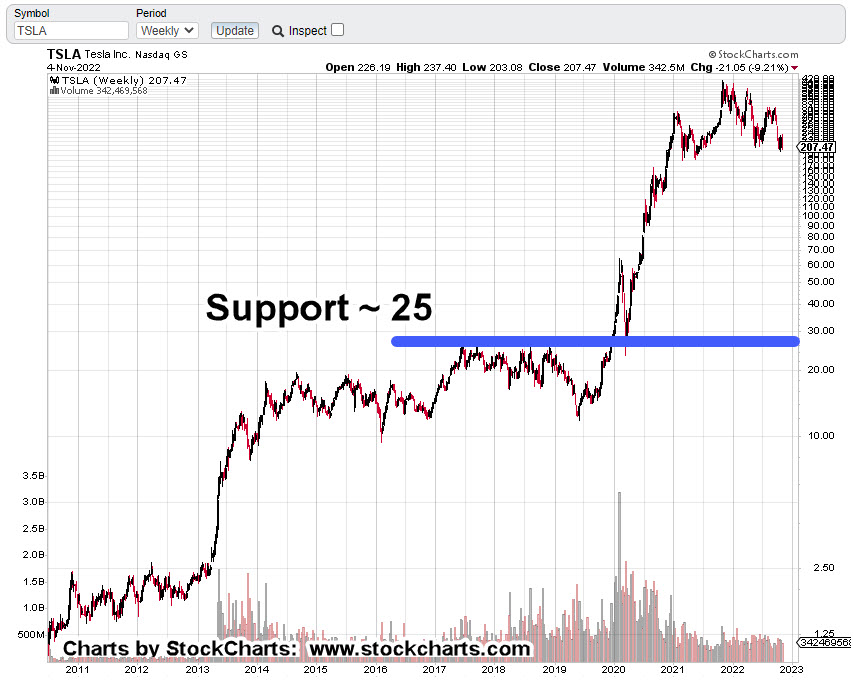
The weekly chart below, shows what we’re looking for; penetration of support to potentially set up a short-trade (not advice, not a recommendation).
Tesla TSLA, Weekly
When or if that penetration takes place, depending on the depth of the thrust, we’ll have a Wyckoff spring set up … that ultimately is expected to fail.
Ways To Trade
As if on cue and possibly in anticipation of TSLA fireworks, there’s a long and short ETF, for just this ticker.
Released just months ago; TSLS, a 1X inverse (bear) TSLA. The bull side has 1.5X leverage with TSLL.
TSLS, has a 100% maintenance requirement and TSLL, has the same.
Or, one can short directly.
There’s no dividend and the broker used by my firm shows TSLA, has no borrowing restrictions other than a 40% maintenance requirement (not advice, not a recommendation).
Then, there are options … we’ll discuss those if some kind of high probability opportunity presents itself.
The Masses
Let’s not forget the herd. What are they doing/saying?
With that in mind, a random check of our favorite holding pen, SeekingAlpha, has oodles of TLSA analysis.
The most recent is actually quite good from a thoroughness perspective. It admits/discusses the downward pressures and identifies the support/resistance levels discussed above.
Note: Posts on this site are for education purposes only. They provide one firm’s insight on the markets. Not investment advice. See additional disclaimer here.
Note: Posts on this site are for education purposes only. They provide one firm’s insight on the markets. Not investment advice. See additional disclaimer here.