The Last Place To Be … Real Estate

The most illiquid of all ‘assets’: Real Estate
Two quarters of negative GDP (even with cooked books) equals recession.
Next up, full-blown depression.
Some would argue (like J.B. and Dan) that we’re already in a depression … we skipped the recession part altogether.
Do not pass Go. Do not collect $200.
Anyone who thinks the Fed’s going to ‘pivot’ because the numbers are weak, does not understand (or won’t admit to) the real purpose of the entity; but I digress.
The Strategy
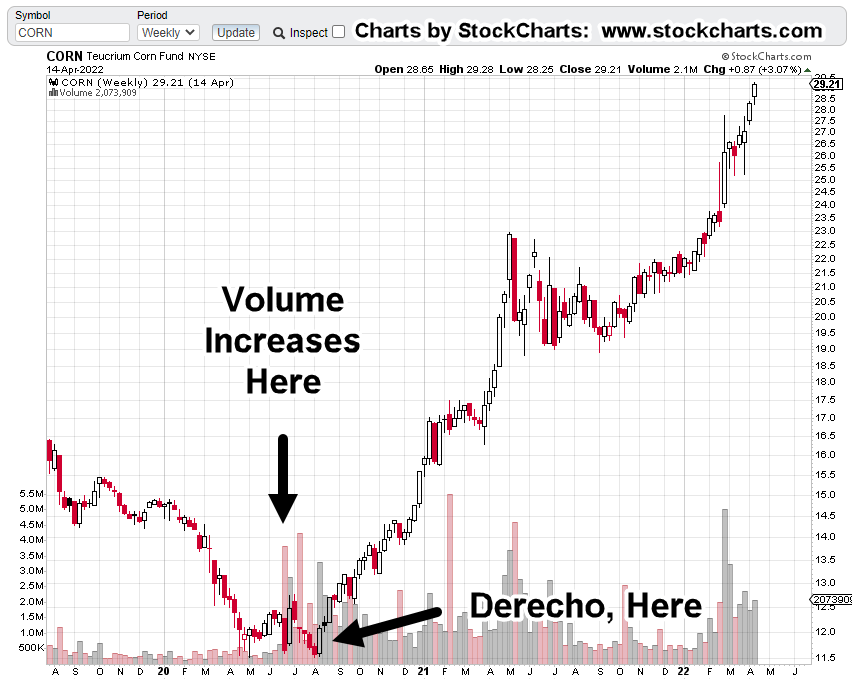
Way back in December of 2020, this post was released which discussed ‘Genesis 41’, specifically.
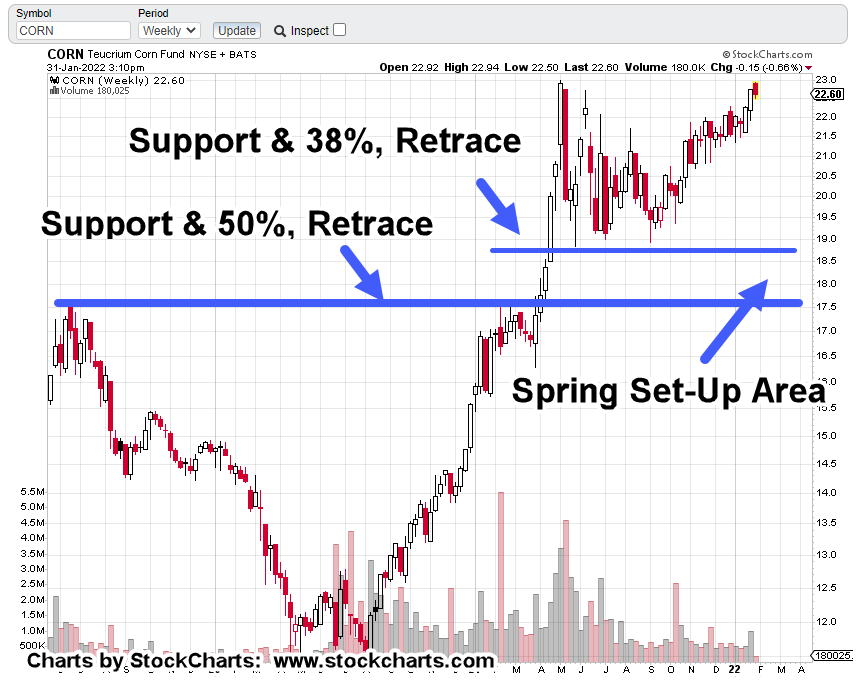
It was an intuitive assessment; we’re in a phase where corn and grain (i.e., the food supply) are potentially more important than ‘stacking‘ silver or gold.
Over the ensuing year and a half, how correct, that has proven to be.
Then, nine-months ago, was this post, presenting the ‘elephant’; a massive population decline whose repercussions would last the lifetimes of anyone reading.
Now, we have this. A report that confirms the elephant.
It’s all starting to hit the mainstream, although the language is still being couched to not cause undue panic. Good luck with that.
So, what’s next?
The Danger Point: Real Estate
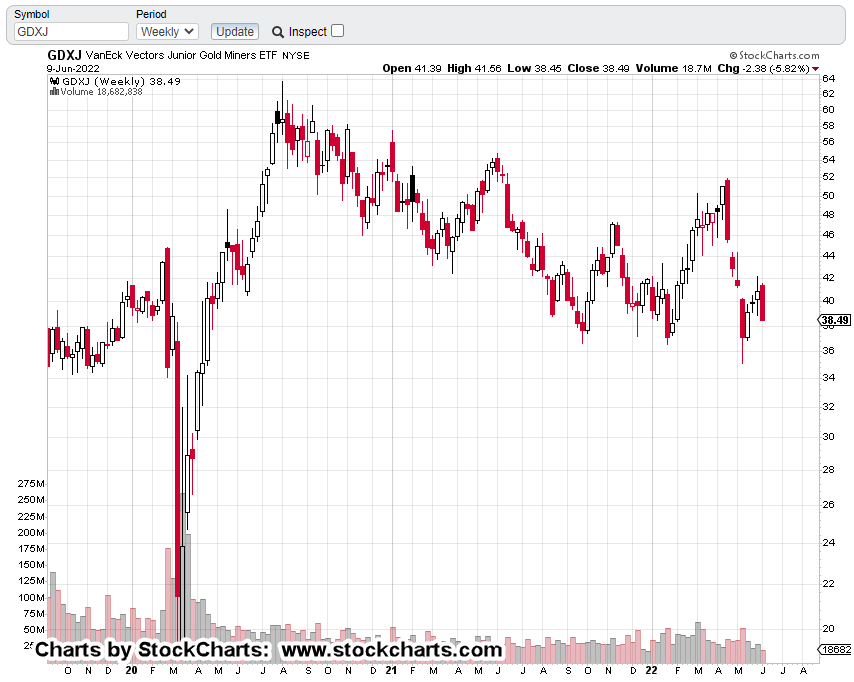
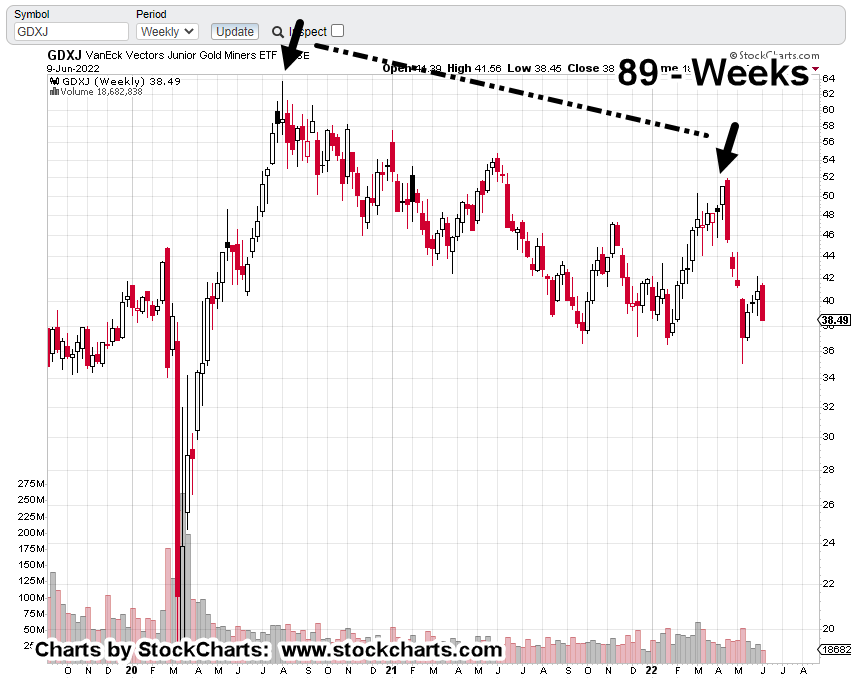
While mainstream press and money managers alike struggle to figure out the obvious, we have price action itself telling us the next likely direction of the market.
During an economic downturn there are many places not to be such as semiconductors, airlines and other low margin businesses, restaurants and so on.
However, the most illiquid of all, is real estate. It does not matter how bad one wants to sell, if there is no buyer, there is no sale.
Real Estate IYR, Weekly Chart
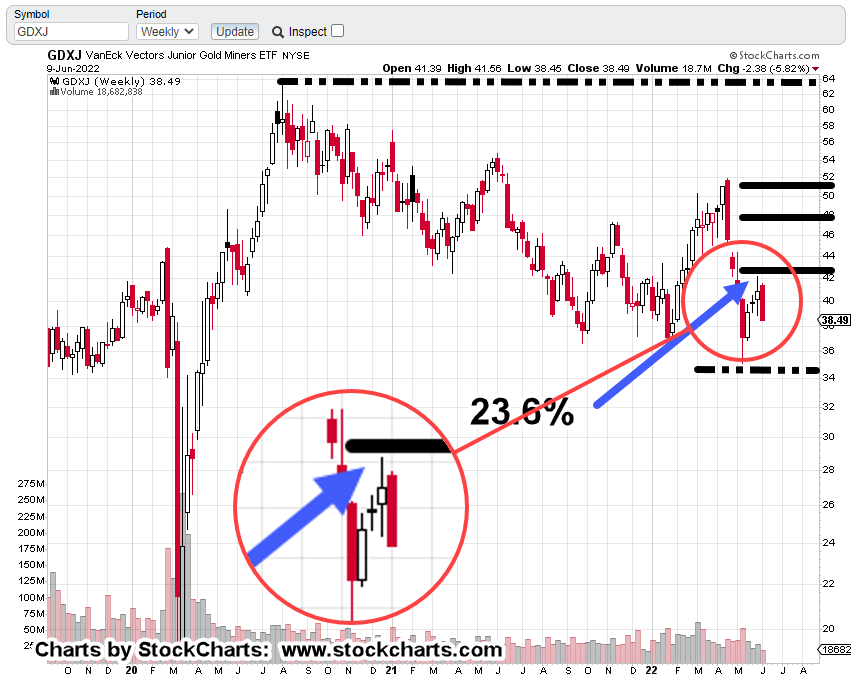
Last week, real estate IYR, closed right at the Fibonacci 23.6% retrace as shown.

Getting closer in on the daily, it’s marked up to show the risk from a shorting perspective (not advice, not a recommendation).
Real Estate IYR, Daily Chart
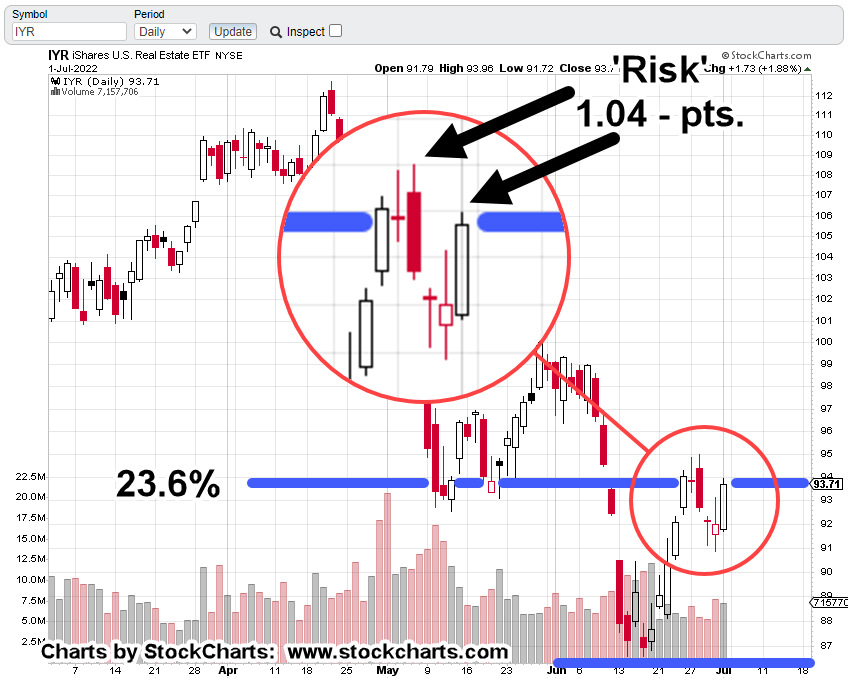
In this case, the risk on a short position is defined as the distance from last Friday’s high (IYR: 93.96) to that same week’s high of IYR: 95.0
Let’s add, Friday’s action saw IYR, retrace a Fibonacci 76.4% (the most available) of the entire move for the week.
The Summary
Amazon (AMZN), ProLogis (PLD), and Real Estate IYR, are joined at the hip.
Now the economy’s imploding, massive warehouse space is not needed.
Ditto that for employees as well.
ProLogis is already down – 31.2%, from its all-time highs set just this past April.
We’ve already shown PLD, has a nasty habit of going straight down during a market route.
Last time, PLD, crashed over – 84%, in just two months.
It’s likely to be worse, this time around.
Stay Tuned
Charts by StockCharts
Note: Posts on this site are for education purposes only. They provide one firm’s insight on the markets. Not investment advice. See additional disclaimer here.
The Danger Point®, trade mark: No. 6,505,279