It says, we’re already at ‘depression era’ levels of 25% unemployment.
If anyone’s skeptical of alternate numbers, the official numbers have already been proven to be ‘in-question’.
One of the best examples of ‘official’ data, or lack thereof, is this report.
What’s a million jobs or so, between friends. 🙂
With mass layoffs starting, also, here and here, that 25% number above, is likely to increase significantly.
We can even add some anecdotal evidence, link here.
Strategy, Tactics, Focus
The price action of the market itself, is telling us where to go for opportunity.
Upside may still be there, if one wants to position in the A.I. bubble (not advice, not a recommendation).
However, for over eighteen months, this site’s been profitable only positioning to the short-side (UNG, the exception) and sees no reason to join the crowd buying into the A.I. mania (not advice not a recommendation).
The current focus is on WMT, a sleeper, not-doing-much, for years, that may be about to get interesting.
Currently short as WMT-25-03, with stop at last week’s high (not advice, not a recommendation).
Note: Posts on this site are for education purposes only. They provide one firm’s insight on the markets. Not investment advice. See additional disclaimer here.
Note: Posts on this site are for education purposes only. They provide one firm’s insight on the markets. Not investment advice. See additional disclaimer here.
From a long-term strategy standpoint, this site has been consistent; it’s the food supply first, then gold and silver (not advice, not a recommendation).
The next shoe has yet to drop on how or what’s going to be used to extract (or confiscate) precious metals from the (stacking) proletariat.
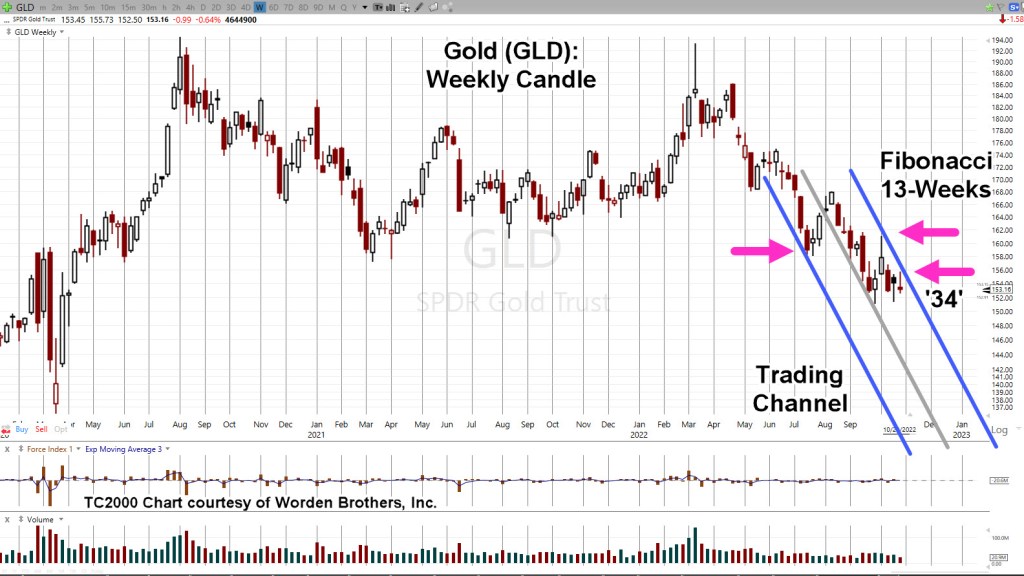
So far, it’s been three-for-three (here, here and here) identifying recent significant technical conditions and turning points for gold, GLD.
At this juncture, the dollar collapse, and the silver/gold bull launch are just not happening. It’s not there … something else is going on (not advice, not a recommendation).
We’re in the middle of a massive sovereign bankruptcy (Time Stamp 7:10) that’s never happened before.
What’s going on behind the scenes is not visible to us.
However, from a Wyckoff analysis standpoint, those (hidden) actions and decisions show up on the chart(s).
Constantly giving press conferences discussing the strength of the military campaign when the exact opposite was true.
It may be so with gold as well (not advice, not a recommendation).
The local supermarket has decided, after a 22-year long bull market, it’s ‘safe’ for profit.
The hapless public is now standing at the gold kiosk; with face-mask firmly secured, arm bandaged from the latest booster, EV FOB in hand (or pocket), hypnotized into yet another mania.
Note: Posts on this site are for education purposes only. They provide one firm’s insight on the markets. Not investment advice. See additional disclaimer here.
Nemont Mining (NEM), Gold, and the Oil & Gas Sector are at a critical juncture.
The rest of the major indices, Dow, S&P, QQQs, real estate (IYR), and so on, are in a similar position.
For this update, we’ll focus on Newmont (NEM), as it’s the largest cap in the Senior Mining Sector GDX, and a general representative of the commodities markets.
Financial collapse is a process, not an event.
Newmont topped-out in April, of last year. Exxon, the proxy for the Oil & Gas sector, may have reached its highs this past November.
Where’s The Inflation?
As Michael Cowan has just reported, banks are absconding with depositor’s money under the guise of ‘bail-in’.
If the fiat cash is so worthless, why are banks seizing it?
As Robert Prechter Jr., said years ago, ‘all fiat cash ultimately goes to zero’; the end game (most likely) for the dollar. However, it could be months, years, or even a decade before that happens.
For right now, today, this minute, the data is showing us, the banks want the money; ‘Show me the money‘.
With that, let’s look at the non-existent ‘inflation’ in the mining sector.
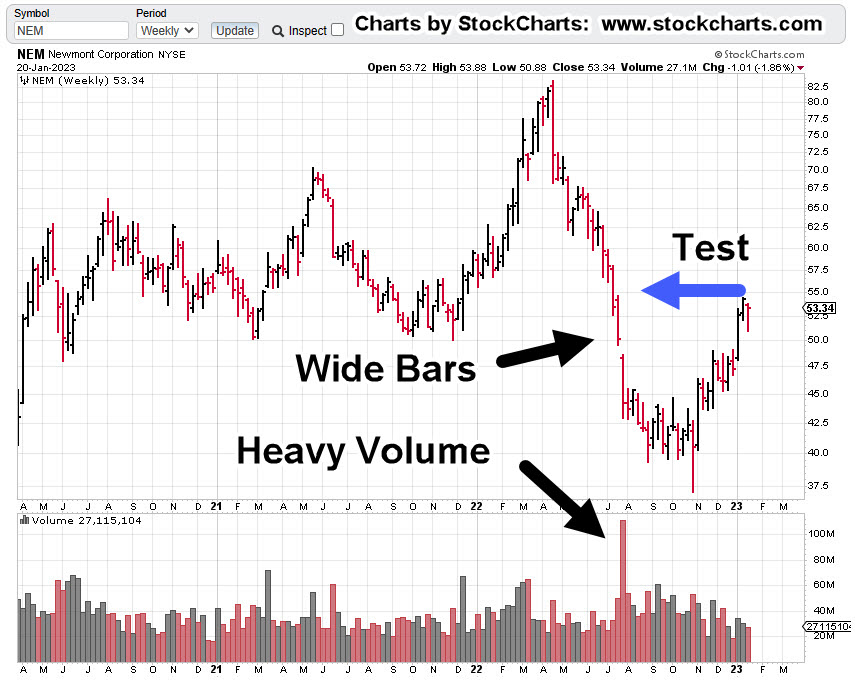
Newmont Mining NEM, Weekly
The first chart identifies the heavy volume and then test of wide price bars. This behavior is common in the markets; they tend to come back and test wide high-volume areas.
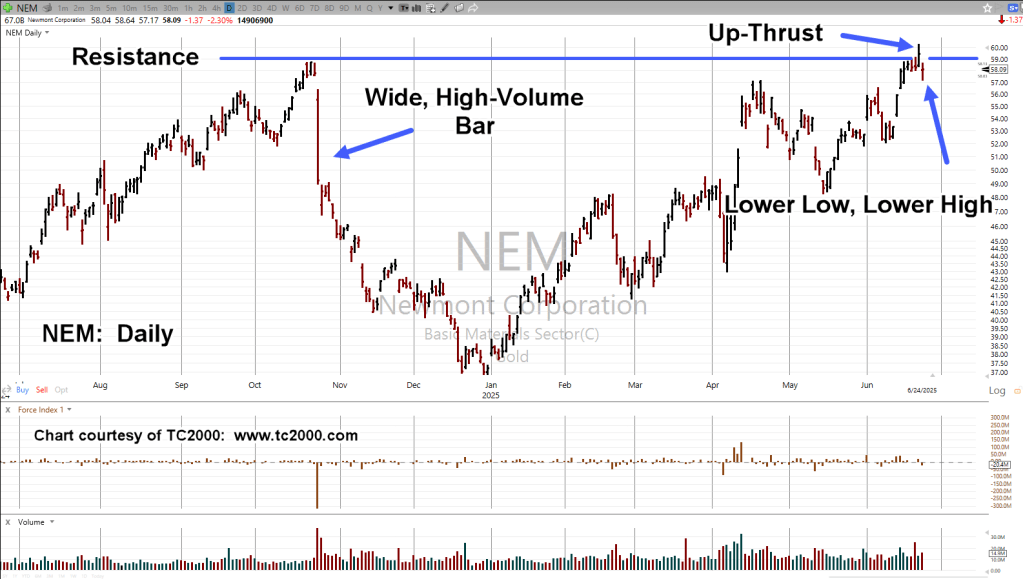
Next, we see there’s a terminating wedge developing as volume declines; the inference, is lack of significant commitment at these price levels.
We’ll get close-in on the wedge; last week printed a lower weekly low and closed lower for the week.
There’s no breakdown of the wedge … yet.
At this juncture, it’s up to the bulls to show they’re still in control.
Inflation vs. Scarcity
We have without a doubt, the effects of the event from the past three years gaining momentum. Whether or not those effects reach a peak this year, is unknown.
A lot of the mainstream and YouTuber’s alike talk about the upward move in gold as the result of ‘inflation’.
Here’s a little bit of insight you’ll not find anywhere else; how about gold rising because the above mentioned ‘effects‘ are causing production volumes to decline?
Maybe it’s because of scarcity (along with nearly everything else) that’s causing the increase in price.
Just to drive that idea home, the latest total gold production numbers, listed here.
Gold production for 2020 dropped -8.2%, from the year prior. Year 2021 was down -1%, from 2020.
From 2010 to 1019, gold production increased or was flat year over year … that is, until 2020.
Note: Posts on this site are for education purposes only. They provide one firm’s insight on the markets. Not investment advice. See additional disclaimer here.
Note: Posts on this site are for education purposes only. They provide one firm’s insight on the markets. Not investment advice. See additional disclaimer here.
The market itself is telling us it’s not going to be ‘well behaved’, possibly for years to come.
According to Goldman, link here, we’ve just had the largest short squeeze on record.
Friday, must have pushed it over the edge from the previously reported, ‘third largest‘.
The ‘Pontificators’
Everybody think’s they’ve got it figured out; We’re going to have stagflation, no wait, hyperinflation, no wait, inflation/deflation simultaneously, no wait, dollar collapse, no wait, gold to the moon, no wait, and on it goes.
What we really have, which is obvious to those ‘awake‘, is something that’s never happened before.
That ‘something‘ is here every day, multiple times a day.
Flash Crash, 2010
Every so often just as a reminder, this event is posted as an example; until that day, it never happened before either.
“Paper comes in, a big seller!!!”
‘Paper’ is essentially anyone (banks, hedge-funds, institutions, and/or retail) outside the pit. Those in the pit are called ‘locals’.
Positioned At The Extreme
The largest short squeeze in history has actually performed a public service; the markets are at extremes.
With that, the short position in Junior Miners GDXJ, has already been discussed, link here.
We’re going to move on and talk about the elephant; more specifically, biotech SPBIO.
Biotech SPBIO
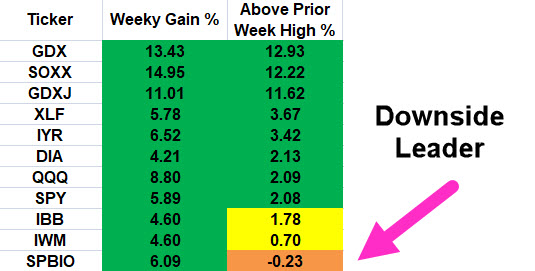
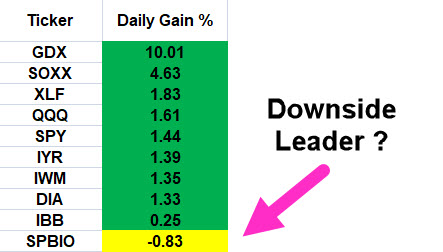
The table shows last week’s action when compared to the week prior. All major sectors had solid gains but it’s the right-most column that’s of interest.
The right-side column shows how far price action closed above the prior week’s high.
Once again, biotech shows overall weakness. It gets more interesting when looking at the weekly chart.
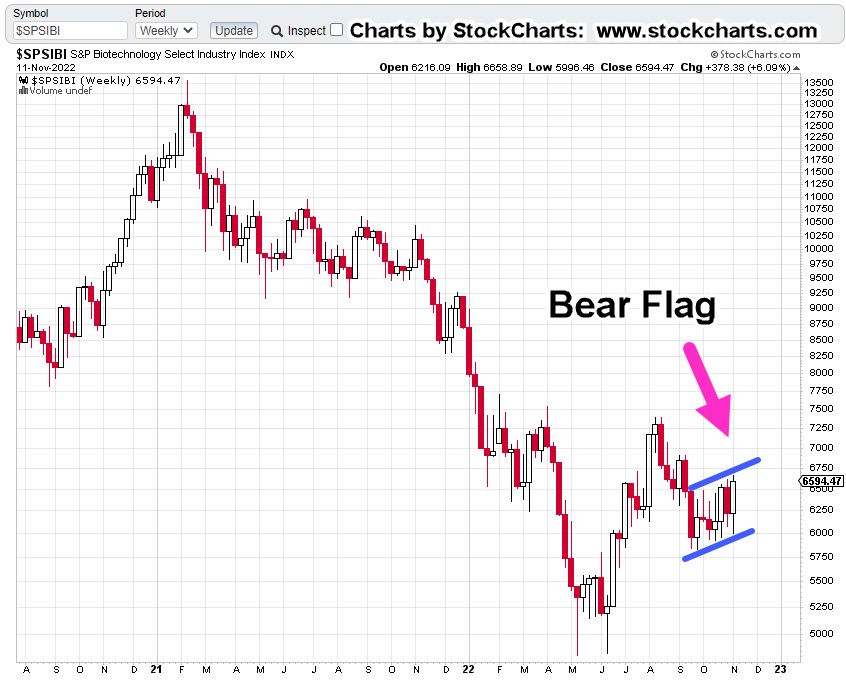
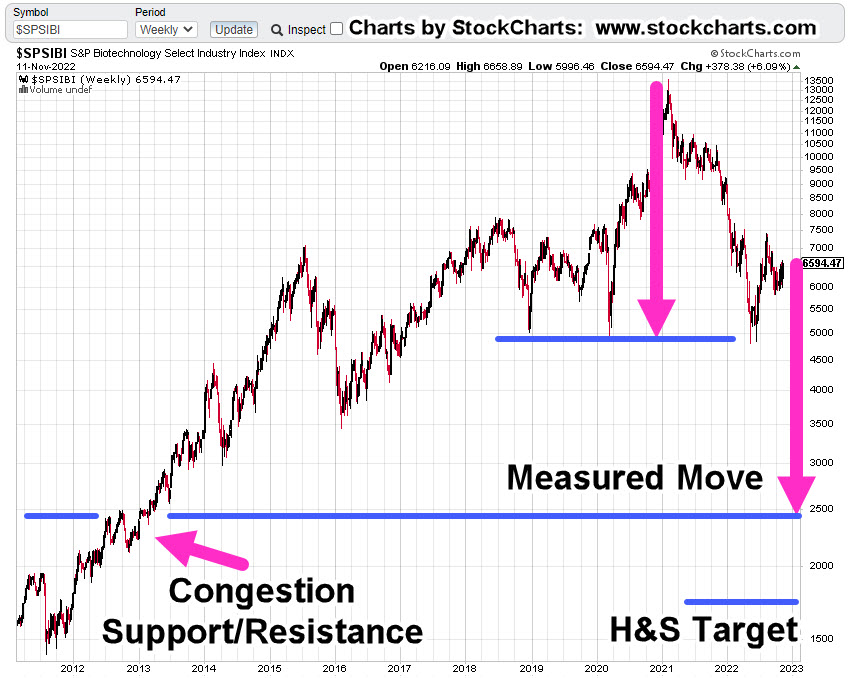
Biotech SPBIO, Weekly
It’s been three successive weeks of apparent up-thrust reversals that were negated each time.
Looking at the weekly below, what we have, is a huge bear flag that just so happens to be, Fibonacci 8-Weeks wide.
It’s possible, this congestion area is the mid-point of the overall move from the highs set during the week of February, 2021.
Compressing the chart and putting in a measured move target gives us the following.
If we have an actual Head & Shoulders top, that target is shown as well.
Either way, the downside potential is enormous; thus, requiring intense focus from a Wyckoff standpoint, i.e., during a bear market, identify the weakest sector for short opportunities (not advice, not a recommendation).
All of which brings us to positioning.
Positioning
On Friday, a discretionary exit was made from the entire LABD-22-09 position as (LABD) price action continued to decline with no end in sight.
Loss on the LABD-22-09, series was a drubbing of -12.2%
Then again, last week was the largest squeeze in history; taking that into account, the loss wasn’t -30% or -50%.
As the trading day progressed, LABD price action continued lower until low-and-behold, it reversed.
Once again, a position was entered (not advice, not a recommendation) but this time was different. Frist off, initial position size is smaller; about 60% smaller.
Secondly, the stop is an actual order that’s in the market (shown below).
Sounds obvious but we’re dealing with unprecedented times and market disruptions. Recall during the Flash-Crash of 2010, Kimberly Clark, or Colgate (if memory serves) went ‘no-bid’ and printed i.e., sold for 0.01.
That low print remained on the charts for years until it was ultimately removed.
If it can happen on the downside (i.e. when long), it can happen on the upside as well (when short).
Positions: (courtesy only, not advice).
LABD-22-10***:
Entry @ 18.1398***: Stop @ 16.83***
JDST-22-05***
Entry @ 9.1666***: Stop @ 8.79***
Note: Positions may be increased, decreased, entered, or exited at any time.
Note: Posts on this site are for education purposes only. They provide one firm’s insight on the markets. Not investment advice. See additional disclaimer here.
The day after the third largest short squeeze in market history, we have marginal new daily highs.
Gold was one of the markets that made news this week with it ‘leaving the station’. 🙂
Let’s take a look at gold (GLD) and how I used its message to position short (not advice, not a recommendation).
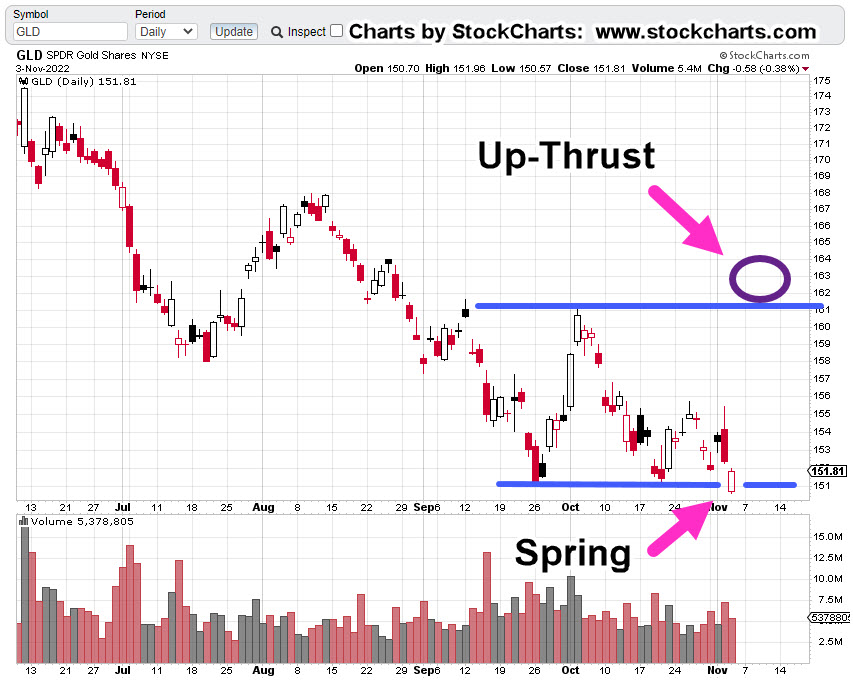
Gold (GLD) Daily
First, we’re going to re-print the original analysis below from November 4th.
And now, the result
We’re right at the edge. Any higher and it could be bona fide breakout.
The miners rallied in kind.
Senior Miners, GDX, is in an up-thrust of its own (not shown) along with the Juniors GDXJ; being a weaker sector it’s extended but not able to push as high as GDX.
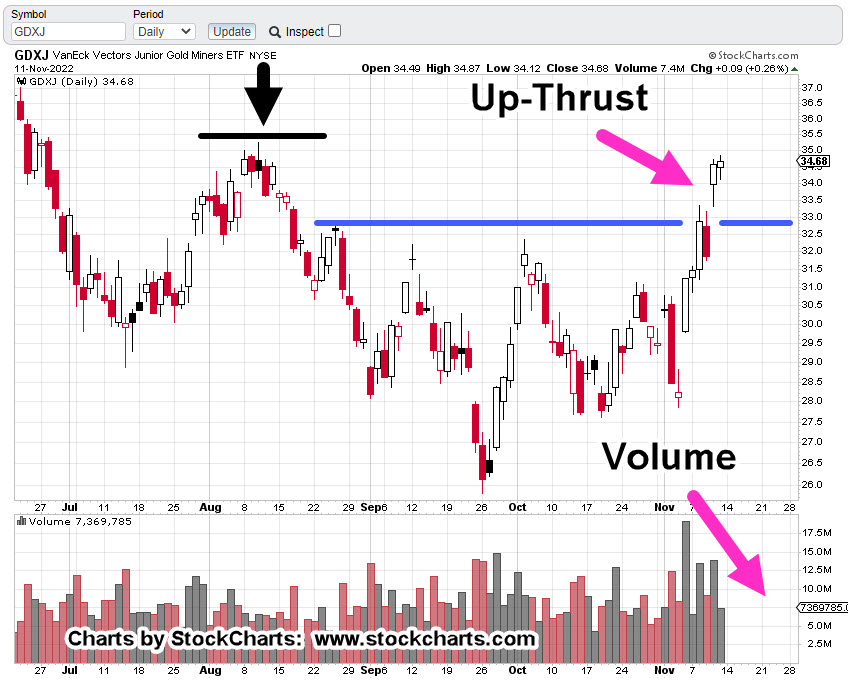
Junior Miners GDXJ, Daily
Note the black line and arrow.
Seniors, GDX, was able to penetrate this area on its own chart but GDXJ, has not (so far).
This gives us an extra layer of resistance for a short position (not advice, not a recommendation).
We can add to that as noted, it was the third largest squeeze in history and today was slightly higher … so what else is there? Risk has (nearly) been squeezed out.
About an hour after the open, a short was opened using GDXJ leveraged inverse fund JDST; JDST-22-05.
Position details and stop locations are to be provided in the next update.
Note: Posts on this site are for education purposes only. They provide one firm’s insight on the markets. Not investment advice. See additional disclaimer here.
That first link even shows how far GLD, is likely to go, which at this point, is just ticks away.
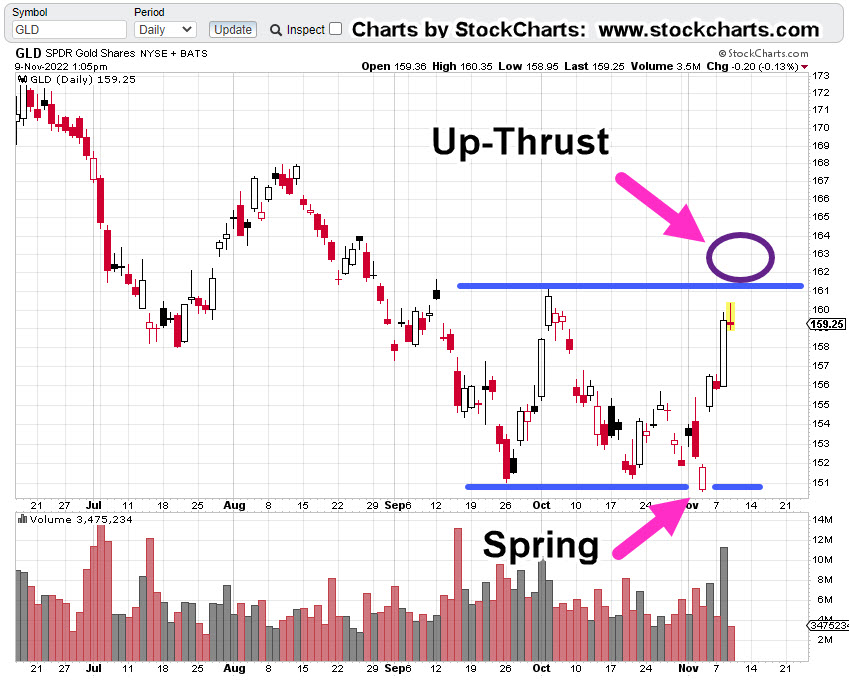
Gold GLD, Daily
We’ll start first with the original forecast.
And the result (as of 1:20 p.m., EST).
We can see price action nearing the up-thrust (reversal) location.
Note: Penetration to the upside above resistance, does not necessarily mean it’s a short opportunity.
Any opportunity will be determined by price action itself.
Summary
Wyckoff analysis not only can provide potentials for price movement; when that move happens, it can also be a stabilizing factor so that one is not caught up in the usual media hysteria.
Meanwhile, back at the ranch, biotech sector (SPBIO) is still on track (ever so slowly) for a potential sustained move to the downside (not advice, not a recommendation).
Positions, Market Stance (courtesy only, not advice).
LABD-22-09:
Special Note:
This sector and leveraged inverse LABD are highly volatile. Character of the market can change at any time.
Note: Posts on this site are for education purposes only. They provide one firm’s insight on the markets. Not investment advice. See additional disclaimer here.
There’re a lot of moving parts to biotech and it’s like a game of chicken.
Is there going to be another ‘planned’ event pulled out of the bag that requires ‘protection’ or will this side (and this one) win-out before that happens?
Price action’s always the final arbiter and right now, it’s positing lower.
Gold:
Gold (GLD) ‘blipped’ higher on Friday and the usual suspects are out touting the hyperinflation narrative.
Owning (some) precious metals seems to be a good thing.
However, the public constantly knee-jerks into this sector and is absolutely rabid in their behavior (i.e., silver stockpiles are running out!!!).
It suggests at least, there’s something else afoot.
Prechter published in the early 2000’s, Central Banks, are followers, not leaders. The fact they are buying gold at this point, may be a contrary indicator.
Talk about going against the herd. 🙂
Over and again, it’s the boring (does not generate ‘clicks’) food supply first, then gold and silver (not advice, not a recommendation).
Real Estate:
What can be said?
It’s the largest manufactured bubble in world history and it has already popped.
Thinking it’s all going to sort itself out in a year or two is delusional. We’ve probably got decades of bear market.
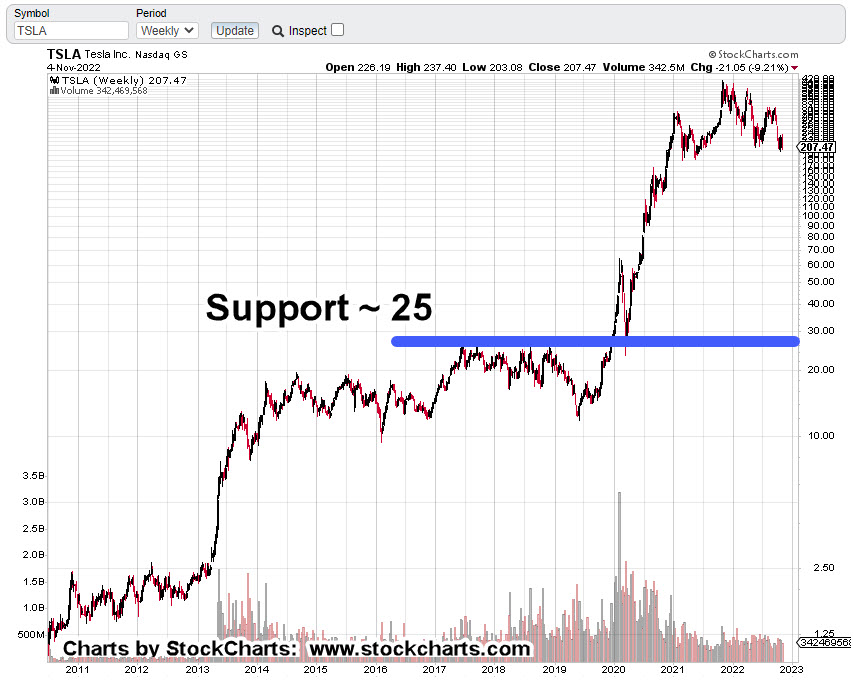
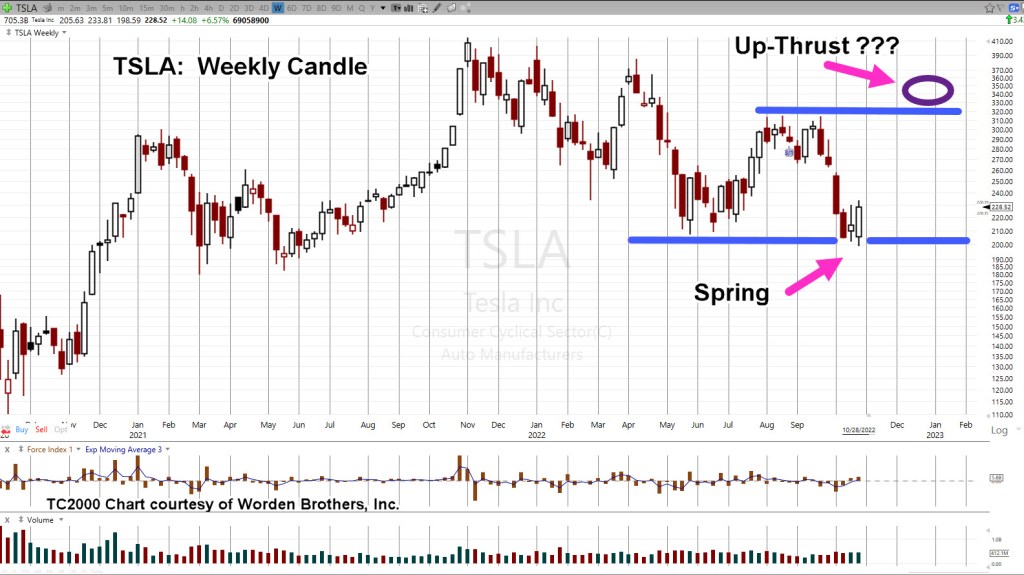
Tesla:
Anyone with an anode of research capability, knows the whole EV premise, is based on a falsehood.
However, that fact is probably not what’s going to bring Tesla (and the rest of the market) down.
Let’s stop for a moment and consider the above link which has been available for nearly four-years.
How many views? Just 9,824 (as of this post)
That equates to only 0.003% of the U.S. population.
As the global supply chains implode, getting parts and having stable infrastructure (i.e., electricity) will probably be the defining factor.
Now, on to the charts.
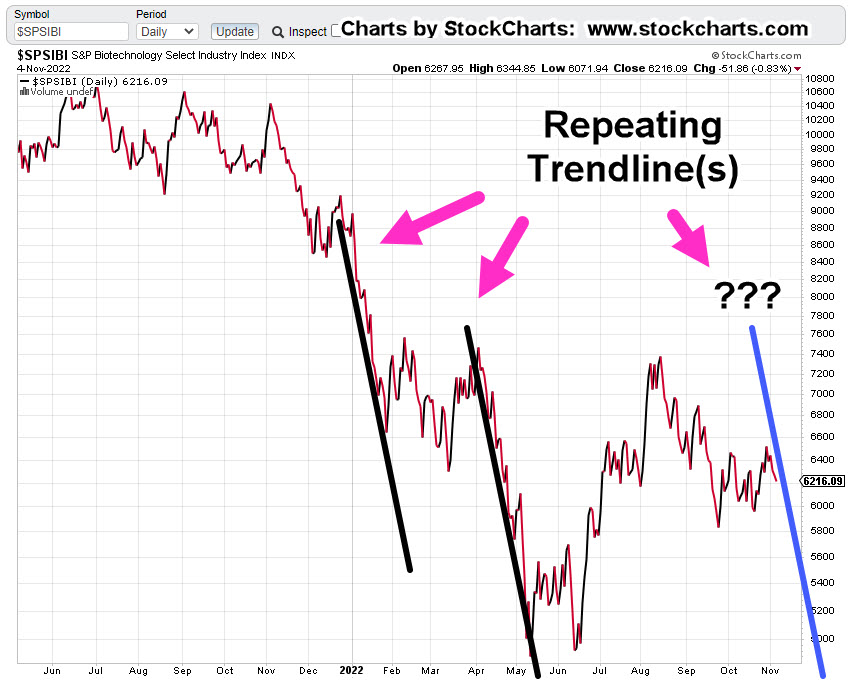
Biotech SPBIO, Daily Close
The following sessions will let us know if we’re at the right edge of the downtrend line.
We’ve already had an up-thrust reversal and a test of that reversal. last Friday was lower … probabilities point down.
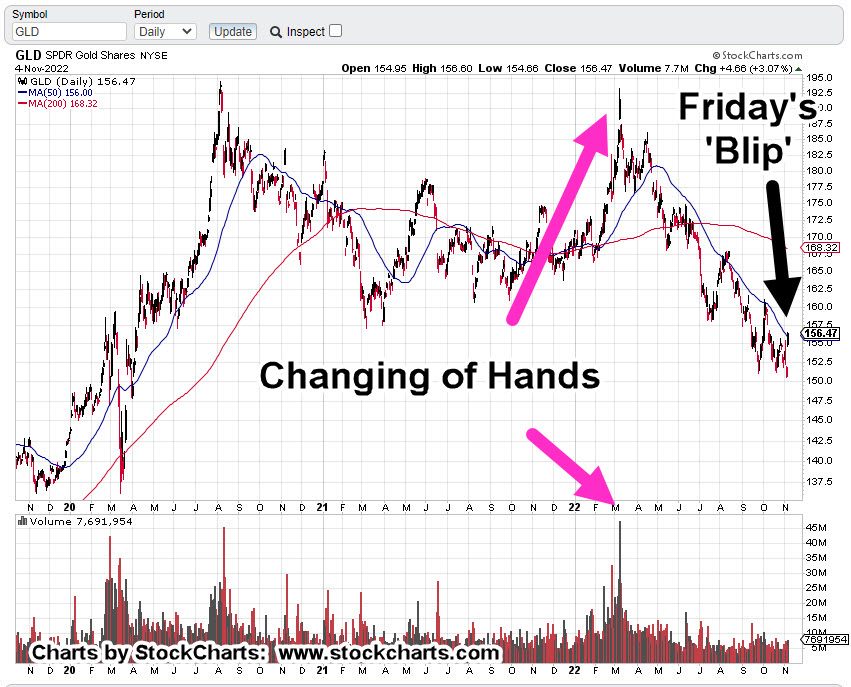
Gold GLD, Daily
Looking at the chart on the strategic, longer term, Friday’s blip is hardly noticeable. We’ve already presented how this could be a minor up-thrust (reversal) in itself.
To keep the upside intact, price action must remain and continue above current levels.
Real Estate IYR, Daily
Real estate may be working its way into an up-thrust condition. As shown, Fibonacci Day 21 from the October 13th, low is this coming Thursday, the 10th.
According to the Economic Calendar there are several potential catalysts that may push the price above resistance (temporarily).
Note: Posts on this site are for education purposes only. They provide one firm’s insight on the markets. Not investment advice. See additional disclaimer here.
Note: Posts on this site are for education purposes only. They provide one firm’s insight on the markets. Not investment advice. See additional disclaimer here.