It’s been a little nerve-wracking over the past two sessions being short biotech; was it an upward correction, or a full-blown reversal?
No one really knows, until it’s over.
Well, as of today’s new daily low in index SPBIO, it looks like what is now seen as a correction, may be complete (not advice, not a recommendation).
Bad, And More Bad
On the fundamental side, The List keeps building with links like this, this and this.
However, keep in mind, it may be something as simple as rising interest rates that’s ultimately going to collapse biotech and the rest of the markets (not advice, not a recommendation).
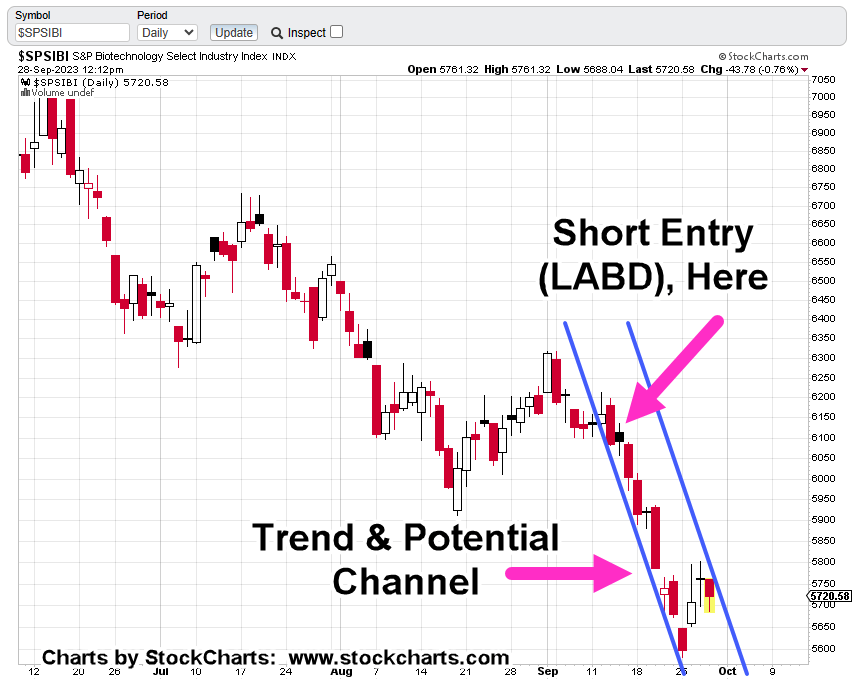
Moving on and looking at the chart of SPBIO, there’s a trend confirmation and potential trading channel.
Biotech SPBIO, Daily
The left side line is the trend … the right-side line is what’s called the ‘reverse trendline’ and possibly defines the trading channel.
As of this post (12:30 p.m., EST) the SPBIO, is doing all it can to reverse higher, against what may be the over-riding (down) trend.
So far, the daily high of SPBIO 5764.73, remains intact.
Positioning
As a result of today’s new SPBIO low, the stop has been moved on the position in the inverse fund LABD, from LABD 18.22, to LABD 19.18 (not advice, not a recommendation).
Note: Posts on this site are for education purposes only. They provide one firm’s insight on the markets. Not investment advice. See additional disclaimer here.
As a reminder, the economic (and population) collapse created by protection from ‘The Speck’, will last the lifetime of anyone reading this post (not advice, not a recommendation).
To support that statement and expand on the enormity of what’s happening, we have this link.
‘Over the next 10 years, ‘Speck’ lawsuits are projected to experience tremendous growth.’
With that, let’s move on.
Alcoa & ESG
Just looking at the website, it’s an ESG cornucopia.
When looking at the chart, it’s (almost) a no-brainer.
First, the very long-term view (Quarterly)
Alcoa AA, Quarterly
On the long-term, we have the repeating market characteristic; ‘Spring-to-Up-Thrust.
A ‘test’ of that up-thrust has been occurring over the most recent quarter.
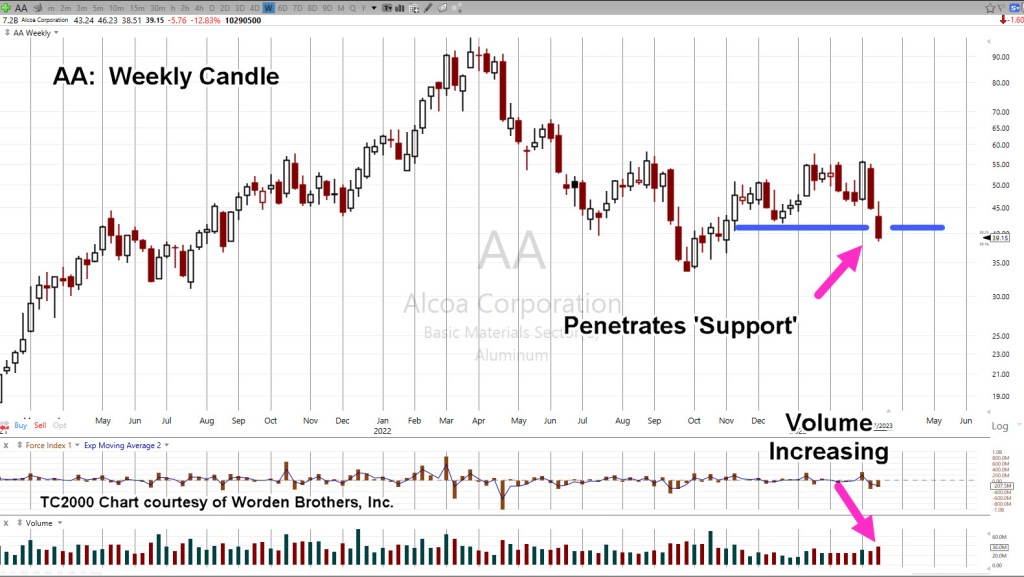
On the weekly chart, we see price action penetrated support with volume increasing.
Alcoa AA, Weekly
Technically, it’s a Wyckoff ‘Spring’ set-up. Some form of upward action next week is to be expected.
However, with the increased volume to the downside, probabilities are low at this point we’ll see any significant upside (not advice, not a recommendation).
Long Way To The ‘Open’
As said in the prior update, events are accelerating. The latest from ZeroHedge proves that to be true.
UBS Seeks Government Backstop As It Rushes To Finalize Credit Suisse Takeover Deal As Soon As Tonight
Another Nail in the Coffin
Looks like the Swedes have put another nail in the coffin for ESG. How long is it going to take for their pension system to fully collapse and then result in social unrest a la Paris?
Note: Posts on this site are for education purposes only. They provide one firm’s insight on the markets. Not investment advice. See additional disclaimer here.
Beginning next week, we’re about to find out if Intel (INTC) is on track to be a ‘penny stock’, by year-end.
Stocks trading below $5/share, are technically called ‘Penny Stocks‘, and mostly ignored by institutional money.
Dystopian Hell: The Stage Is Set
INTC, has already cut the dividend by 66% (note the symbolism) and is ‘conserving cash’.
A large part of their operation with 18,600 employees, is just outside Portland, Oregon.
Here’s a recent look at Portland, uploaded two months ago.
‘Gee honey. Let’s take the kids and move to Portland … Not.’
Incredible, that ‘Speck Protection’ is STILL being pushed (time stamp 2:11). How would you like to work at a location at this late date, where it’s normal to wear a mask?
All of this brings us to the chart. The price action itself defines the next likely course (Wyckoff).
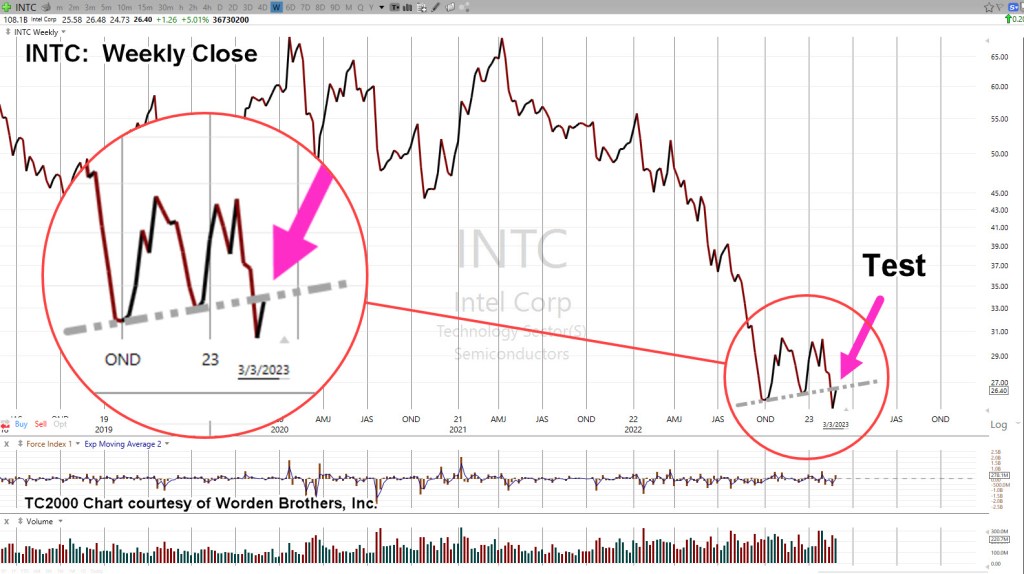
Intel INTC, Weekly Close
Last week closed testing underside resistance and potential right-side trend line contact (second chart).
Compressing the chart and expanding the downside scale, gives us the following.
Just in case anyone’s skeptical about ‘channels’ not being a real potential, here’s the latest look at Carvana (CVNA).
Carvana CVNA, Weekly Close
It’s important to note, not only the channel but the location of “No P/E”, which was the release of this post.
Carvana never closed higher after December 11th, 2021.
Intel, What’s Next?
Will it be the same for Intel?
Of course, that’s not known. Price action itself is the final arbiter; at this juncture, it’s at The Danger Point®
This is where the risk is least (not advice, not a recommendation).
If price action moves significantly higher from here, let’s say 5%, then we’ve likely bottomed and are heading into a rebound.
If not, and Monday, opens and closes lower, it may be a confirmation of the right-side trend line and potential trading channel (not advice, not a recommendation).
Note: Posts on this site are for education purposes only. They provide one firm’s insight on the markets. Not investment advice. See additional disclaimer here.
How appropriate then, that someone who typically plays the ‘village idiot’ comes out with the truth.
Whether the ‘false narrative’ is finally crumbling or not, is not directly related to analyzing price action.
It does, however, provide the backdrop.
The ‘Big Reveal’
The last update in biotech had this to say (emphasis added):
“If this is the big reversal and biotech is the downside leader, unfortunately, that could mean a planned ‘reveal’ by the mainstream media.“
What wasn’t known, was just exactly how the truth would come out. Now, we know.
All of which, brings us to the topic at hand: Biotech SPBIO.
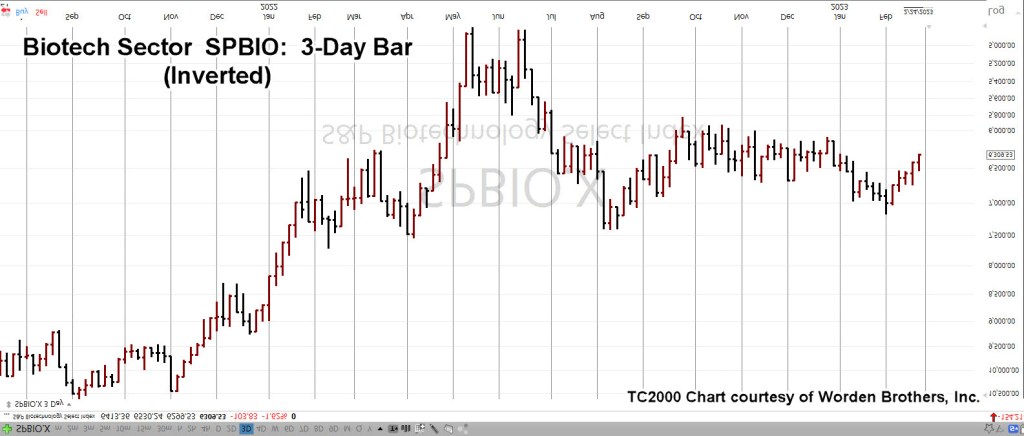
It turns out, SPBIO, is trading most consistently, on a three-day pattern.
Biotech SPBIO, 3-Day
In Wyckoff terms, the market itself defines what timeframes and what support/resistance levels are important.
Next up, we’re going to invert the chart to mimic the price action observed on the leveraged inverse fund LABD.
Biotech SPBIO, 3-Day, Inverted
And now, the characteristics of this sector the market itself, has revealed.
At this juncture, SPBIO, trades in a sequence of 3-Days after which, if there’s a directional move, continues on for nine consecutive bars.
After nine-bars, price action typically enters a correction for an undetermined amount of time.
After the correction’s compete the market has (in the past) continued on a directional move for another nine-bars.
Then & Now
We’re currently in a directional move that’s five ‘3-Day Bars’ in thus far.
If the market adheres to its prior behavior(s), we have at least four more ‘three-days’ to go (not advice, not a recommendation).
Note, the current reversal was identified to the day, with this update:
“However, today’s action is consistent with resolution of the five-months of congestion (not advice, not a recommendation).”
The fact the congestion period for SPBIO has taken so long to (apparently) resolve itself, has produced the potential for price action to go farther, last longer than anyone would normally expect.
That move if it happens, connects well with the introduction at the top of this post; a large part of the public has been informed in no uncertain terms, it was all a lie.
Note: Posts on this site are for education purposes only. They provide one firm’s insight on the markets. Not investment advice. See additional disclaimer here.
The last update about our chief cook and bottle washer of gene ‘modification’ had this to say about price action.
“We’re about forty minutes into the session; Moderna (MRNA) has just confirmed the up-thrust reversal discussed in the last update“.
From that point Moderna (MRNA) declined for seven weeks for a total of around – 31.5%.
However, that’s not the most important part.
In that update, a trading channel was shown which at the time, was declining at – 93.7%, on an annualized basis.
Well, the channel is back.
Only this time, probabilities and price action have come together to set up for a potential sustained decline.
Moderna MRNA, Weekly
Above, we have a Wyckoff ‘Up-Thrust’ and a test that has since turned lower.
Next, we have a series of repeating trend or channel lines.
Additional data has modified the downward slope to be declining at approximately – 90%, annualized.
From a fundamental standpoint, the data set is enormous on the events of the past three years.
At some point that data could provide a huge tailwind for downside action.
For now however, let’s stick with what price action is telling us and go to the Summary & Strategy
Summary & Strategy
The past week has identified two areas of position or trade execution and two areas for possible short-term options execution (not advice, not a recommendation):
Position or Trade: Real Estate IYR, and Biotech SPBIO
Options: Carmax KMX, and Moderna MRNA
As a reminder, most if not all trade analysis is for the short side (not advice, not a recommendation).
Final Thoughts
Since we have possibly the largest bull trap in market history with huge numbers of VIX Call options, the following week may be subdued by going modestly up, sideways or down, slowly.
With that said, options positioning (if any) could be slated for the week of 2/17/23.
Note: Posts on this site are for education purposes only. They provide one firm’s insight on the markets. Not investment advice. See additional disclaimer here.
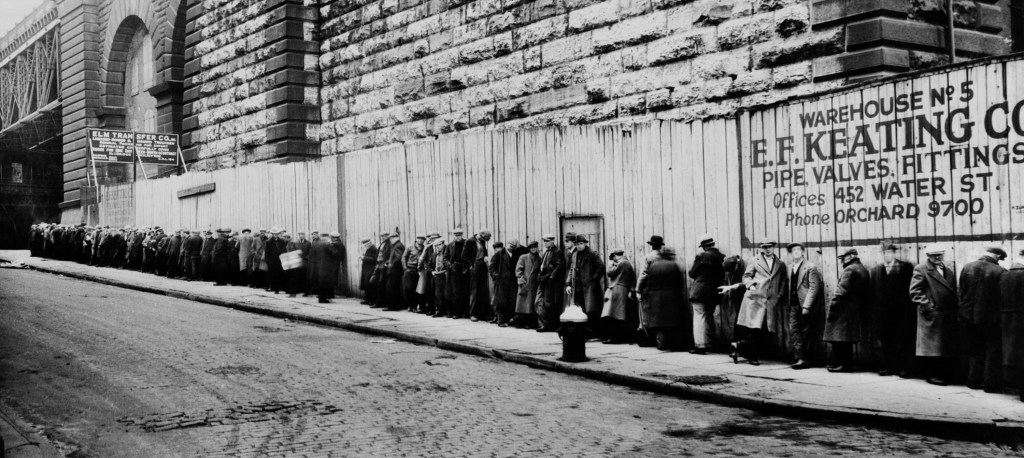
Provided many times on this site, the assessment we’ve gone straight past recession and directly to: ‘The Greater Depression’, or ‘The Great Depression 2.0’
By now, we’re all aware of this data, just out from ZeroHedge.
That data is at the ‘peak’ or the depths of 1932, and we in our current market, haven’t even got started!
The Fed’s interest rate announcement is due out at 2:00 p.m., Eastern, today; does it really matter?
We can see with unbiased observation; the wheels have already, irrevocably, been set in motion.
The economy along with the ‘elephant’ that no one talks about, are juggernauts on a downward course.
The 1929 Crash, Then Bull Rally
Remember, the big market speculators of the early 1900s typically made their fortunes on the way down (not advice, not a recommendation).
Let’s also not forget, one of, if not the largest market rallies up to that time (in percentage terms), happened right in the middle of The Great Depression.
Of course, to trade that mid-1930s rally, you had to have the capital to do so.
Which brings us to the next topic: Real Estate.
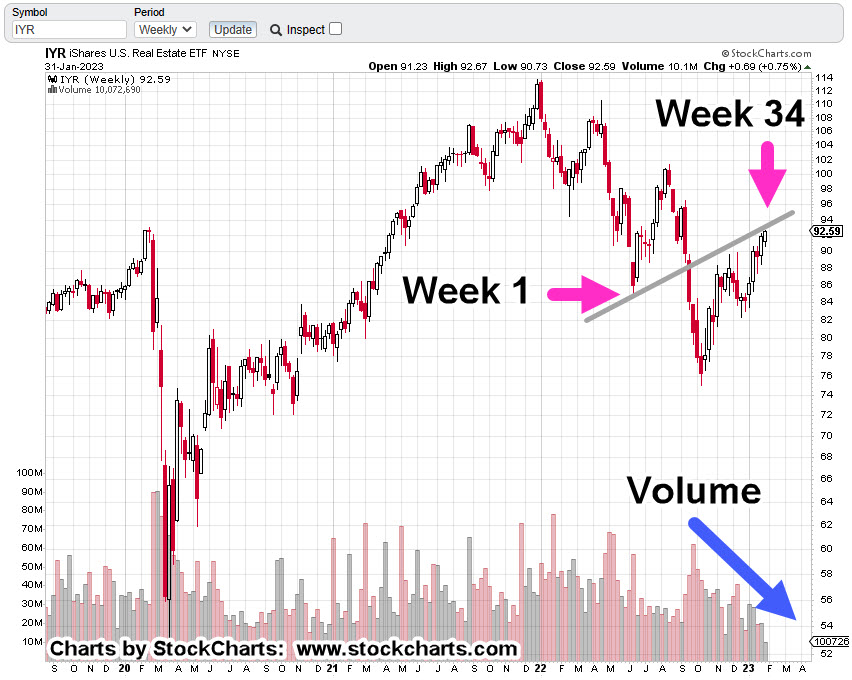
Real Estate IYR, Weekly
With yesterday’s new print high, we’re at Fibonacci Week 34. That puts us at a potential trading channel or inflection point as discussed in this post.
There’s no guarantee of a trading channel or even a reversal.
However, we do have a confluence of events; upside volume (pressure) declining, marginal new highs and the potential Fed pivot point, due out today.
It’s about 20-minutes before the open. Let’s see what happens next.
Note: Posts on this site are for education purposes only. They provide one firm’s insight on the markets. Not investment advice. See additional disclaimer here.
Nemont Mining (NEM), Gold, and the Oil & Gas Sector are at a critical juncture.
The rest of the major indices, Dow, S&P, QQQs, real estate (IYR), and so on, are in a similar position.
For this update, we’ll focus on Newmont (NEM), as it’s the largest cap in the Senior Mining Sector GDX, and a general representative of the commodities markets.
Financial collapse is a process, not an event.
Newmont topped-out in April, of last year. Exxon, the proxy for the Oil & Gas sector, may have reached its highs this past November.
Where’s The Inflation?
As Michael Cowan has just reported, banks are absconding with depositor’s money under the guise of ‘bail-in’.
If the fiat cash is so worthless, why are banks seizing it?
As Robert Prechter Jr., said years ago, ‘all fiat cash ultimately goes to zero’; the end game (most likely) for the dollar. However, it could be months, years, or even a decade before that happens.
For right now, today, this minute, the data is showing us, the banks want the money; ‘Show me the money‘.
With that, let’s look at the non-existent ‘inflation’ in the mining sector.
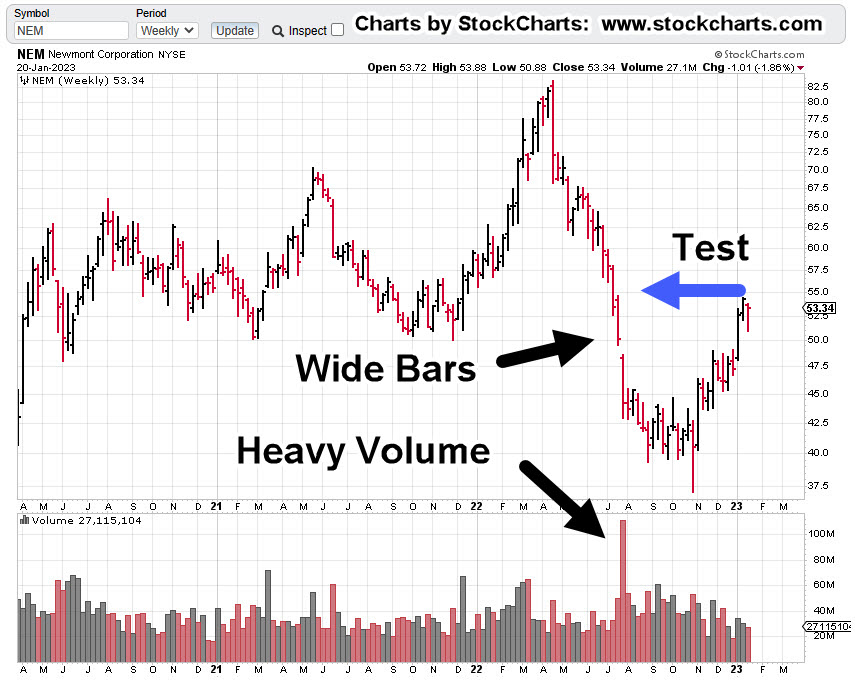
Newmont Mining NEM, Weekly
The first chart identifies the heavy volume and then test of wide price bars. This behavior is common in the markets; they tend to come back and test wide high-volume areas.
Next, we see there’s a terminating wedge developing as volume declines; the inference, is lack of significant commitment at these price levels.
We’ll get close-in on the wedge; last week printed a lower weekly low and closed lower for the week.
There’s no breakdown of the wedge … yet.
At this juncture, it’s up to the bulls to show they’re still in control.
Inflation vs. Scarcity
We have without a doubt, the effects of the event from the past three years gaining momentum. Whether or not those effects reach a peak this year, is unknown.
A lot of the mainstream and YouTuber’s alike talk about the upward move in gold as the result of ‘inflation’.
Here’s a little bit of insight you’ll not find anywhere else; how about gold rising because the above mentioned ‘effects‘ are causing production volumes to decline?
Maybe it’s because of scarcity (along with nearly everything else) that’s causing the increase in price.
Just to drive that idea home, the latest total gold production numbers, listed here.
Gold production for 2020 dropped -8.2%, from the year prior. Year 2021 was down -1%, from 2020.
From 2010 to 1019, gold production increased or was flat year over year … that is, until 2020.
Note: Posts on this site are for education purposes only. They provide one firm’s insight on the markets. Not investment advice. See additional disclaimer here.
Something’s not right in the precious metals sector.
Gold’s just off -8%, from its highs while other monetary metals (Palladium, Platinum, Silver) are far below their highs; silver’s off a whopping -51.75%, from its 2011, highs.
In addition, as we’ll see below, silver (SLV) is just now contacting the right side of a trend line and potential downward channel structure that goes all the way back to the lows of 2015.
The ‘Squeeze’ of 2021
Below on the weekly chart of SLV, is a point labeled “1”.
That’s the location of what turned out to be a right-side trend line contact. Back then, an update on the ‘squeeze’ was posted, linked here.
Taken from that update was the following (emphasis added):
Those attempting garner forces (the little guy) to move the markets, such as silver, will find out soon enough who’s in control … and it’s not them.
It’s unlikely silver is going higher any time soon. There could be some upward spasms as the crowded trade exhausts itself; it’s likely we’ve seen the SLV highs for quite some time.
So, here we are nearly two years later; SLV never posted higher than the February 2nd, squeeze of 2021.
So, what’s next? Is there something else going on?
We’ll look at that question after the charts.
Silver SLV, Weekly
First, is the un-marked chart.
Next, we see a pattern that’s not so clear without mark-up.
For SLV, to break out, there needs to be an absence of motivated sellers (prices drift higher) or sufficient buying demand to overcome the downward trend.
Inflection Point
For an idea of what’s likely to happen next, we’re going to go to an unlikely source; Daniela Cambone and Gregory Mannarino.
It’s not about ‘controlling’ inflation and it never was, going all the way back to 1913. It’s about the ‘end game’, as discussed by Mannarino.
“Eliminate The Middle Class” (time stamp 11:40)
The sticky wicket is the ‘debt bubble’ and the ‘elephant’.
The Elephant Grows
The chart of silver (and other precious metals) and its non-confirmation with gold, could be an indicator of debt collapse and demand collapse first, before hyperinflation.
Multiple times a day now we have reports like the following flooding into the marketplace:
COVID Vaccines Are “Obviously Dangerous” And Should Be Halted Immediately, Say Senior Swedish Doctors
Multiple Young Athletes And Former Athletes Died Suddenly This Past Month
Doctor Calls For Withdrawal Of Pfizer, Moderna COVID-19 Vaccines Following New Research
The above list is just since yesterday and it’s only 2:00 p.m., Central Time, today!!!
Monetary & Manufacturing
Silver is unique more so than gold, in that it’s an industrial metal as well as monetary.
The collapse in manufacturing demand could be the reason silver’s not confirming gold’s move.
It may also be telling us, as the effects of the elephant take hold, a huge liquidation of all assets could be coming; paradoxically as the need for fiat cash (not precious metals) to pay off debt, increases.
Note: Posts on this site are for education purposes only. They provide one firm’s insight on the markets. Not investment advice. See additional disclaimer here.
Let’s see if the market’s ready to hand it to this sector. What’s the price action telling us.
Biotech SPBIO, Weekly
The weekly chart shows the potetial breakout.
However, since we’re looking at this from a ‘going short’ perspective (not advice, not a recommendation), the chart following this one is inverted.
When we invert the chart, it takes on a whole different look.
Biotech SPBIO, Weekly (Inverted)
If price action’s spent over three months getting where support has been penetrated only to have it fail into a reversal, the ensuing move has massive potential.
In Wyckoff terms, it’s cause and effect.
The ’cause’ has been three months of congestion. The ‘effect’ is a potential long duration, or wide volatility move.
Before The Open
It’s twenty minutes before the open and 3X leveraged inverse fund LABD, is trading higher by about +3.5%.
This is normal behavior whether we have a reversal or not.
One last check of ZeroHedge, before releasing this post turns up this:
Senator Questions CDC On Why It Claimed No ‘Unexpected Safety Signals’ For COVID Vaccines
Note: Posts on this site are for education purposes only. They provide one firm’s insight on the markets. Not investment advice. See additional disclaimer here.
Was that the day where irrefutable evidence like this is going to stick?
Price action of Biotech Sector IBB, has posted a long awaited and anticipated reversal signal (not advice, not a recommendation).
We’ll look at that below.
The IBB, Up-Thrust & Reversal
As a reminder, in Wyckoff terms, an ‘up-thrust’ is where price action struggles above known resistance for some period of time and then reverses to the downside.
In the case of IBB, that ‘struggle’ lasted an incredible seven-weeks.
Biotech IBB, Weekly
Price action attempted to break above resistance for nearly two-months, before reversing lower.
Then we had an initial test during the week of 12/23/22 (on the daily for three days), and a secondary test last week.
Biotech IBB, Daily
The daily shows more detail on the struggle.
Point No. 1, was the initial test. Point No. 2, was the secondary test which appears to have decisively failed.
Pre-market action shows IBB, set to open slightly lower.
If it does, then expectation is for some (brief) attempt to rally as a test of the breakdown.
The Driving Force
For years, this site has not wavered in the assessment, what’s happening in this sector, will be the driving force for the entire market on a go-forward basis (not advice, not a recommendation).
Anything can happen.
It’s unknown if yesterday was ‘the day’.
What is known however, evidence is building on a massive scale. Every day, sometimes multiple times a day, we see the effects.
Positioning
This site presents the data, the insight and price action nuances. It does not give recommendations.
With that said, going short this sector is not as straightforward as the other major indices.
IBB, may be shorted directly but will likely result in a maintenance fee from the broker.
Of course, that puts one on the hook for the sector’s dividend payment (currently yielding 0.31%).
The other option is 2X leveraged inverse fund BIS.
However, this fund’s volume is thin … meaning it’s not nearly as liquid as the other inverse funds such as SDS, DXD, QID, SOXS and so on.
It’s up to the trader/speculator to participate or not.
We’re about fifteen-minutes before the open. Let’s see what happens next.
Note: Posts on this site are for education purposes only. They provide one firm’s insight on the markets. Not investment advice. See additional disclaimer here.