Note: Posts on this site are for education purposes only. They provide one firm’s insight on the markets. Not investment advice. See additional disclaimer here.
Note: Posts on this site are for education purposes only. They provide one firm’s insight on the markets. Not investment advice. See additional disclaimer here.
Everybody seems to talk about the crash of ’87, as if it suddenly appeared out of nowhere, October 19, 1987.
Digging deeper, the crash started months earlier, at the market peak on August 25th.
One may consider today, Monday, August 26th, the 37th anniversary of that top; when by chance, we’re at another all-time high.
By now, most of us are tired of The Gong Show style prognostications:
‘Crash this’ and ‘crash that’, ‘the dollar’s going to collapse’ and there’s that! 🙂
At this point, none of those things have happened … yet.
In fact, the ‘collapse’ may actually be of a different sort this time around; posed by Uneducated Economist, link here (time stamp: 2:04).
Real & Separated
We may indeed get an ’87 or ’07, type of collapse, eventually.
Or, it may be that sectors wipe-out individually.
However, as UE points out (above, link), the ‘crash’ this time is hidden. It’s the separation of wealth from the ever more have-nots, to the haves, and have-more.
The (Biggest) Bubble
As the Dow Jones is making an historic high, possibly the biggest bubble of all time, the A.I. bubble, led by NVDA, and the SOX Index (SOXX, tracking ETF), peaked out on July 11th (not advice, not a recommendation)
When we last left the SOXX, with this update, link here, it had this to say (emphasis added):
“If we just saw a test of resistance (solid black line), then there’s only one (or a variation of one) right answer at the next session.”
“That is, SOXX, price action (by the close) to be either net sideways or down (not advice, not a recommendation).”
Well, ladies and gentlemen, that’s exactly what happened.
The SOXX, posted a new daily low, closing down -5.86-pts., or -2.51%.
Note: Posts on this site are for education purposes only. They provide one firm’s insight on the markets. Not investment advice. See additional disclaimer here.
Provided many times on this site, the assessment we’ve gone straight past recession and directly to: ‘The Greater Depression’, or ‘The Great Depression 2.0’
By now, we’re all aware of this data, just out from ZeroHedge.
That data is at the ‘peak’ or the depths of 1932, and we in our current market, haven’t even got started!
The Fed’s interest rate announcement is due out at 2:00 p.m., Eastern, today; does it really matter?
We can see with unbiased observation; the wheels have already, irrevocably, been set in motion.
The economy along with the ‘elephant’ that no one talks about, are juggernauts on a downward course.
The 1929 Crash, Then Bull Rally
Remember, the big market speculators of the early 1900s typically made their fortunes on the way down (not advice, not a recommendation).
Let’s also not forget, one of, if not the largest market rallies up to that time (in percentage terms), happened right in the middle of The Great Depression.
Of course, to trade that mid-1930s rally, you had to have the capital to do so.
Which brings us to the next topic: Real Estate.
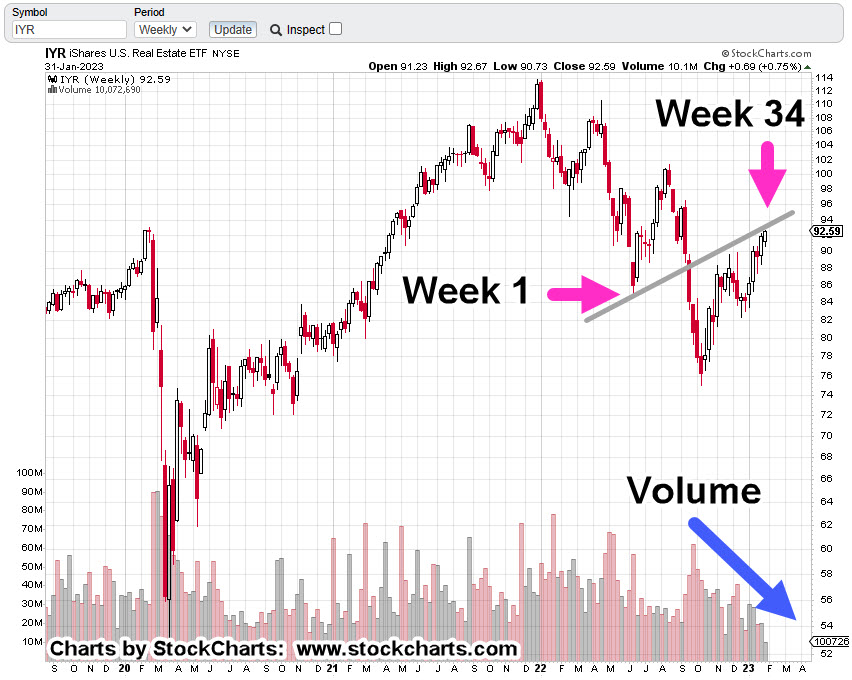
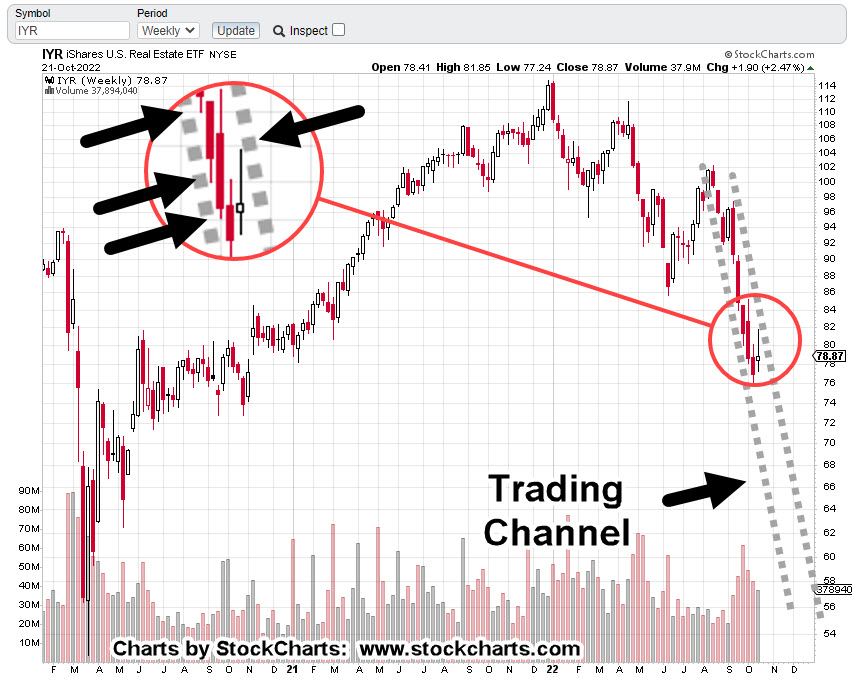
Real Estate IYR, Weekly
With yesterday’s new print high, we’re at Fibonacci Week 34. That puts us at a potential trading channel or inflection point as discussed in this post.
There’s no guarantee of a trading channel or even a reversal.
However, we do have a confluence of events; upside volume (pressure) declining, marginal new highs and the potential Fed pivot point, due out today.
It’s about 20-minutes before the open. Let’s see what happens next.
Note: Posts on this site are for education purposes only. They provide one firm’s insight on the markets. Not investment advice. See additional disclaimer here.
Nemont Mining (NEM), Gold, and the Oil & Gas Sector are at a critical juncture.
The rest of the major indices, Dow, S&P, QQQs, real estate (IYR), and so on, are in a similar position.
For this update, we’ll focus on Newmont (NEM), as it’s the largest cap in the Senior Mining Sector GDX, and a general representative of the commodities markets.
Financial collapse is a process, not an event.
Newmont topped-out in April, of last year. Exxon, the proxy for the Oil & Gas sector, may have reached its highs this past November.
Where’s The Inflation?
As Michael Cowan has just reported, banks are absconding with depositor’s money under the guise of ‘bail-in’.
If the fiat cash is so worthless, why are banks seizing it?
As Robert Prechter Jr., said years ago, ‘all fiat cash ultimately goes to zero’; the end game (most likely) for the dollar. However, it could be months, years, or even a decade before that happens.
For right now, today, this minute, the data is showing us, the banks want the money; ‘Show me the money‘.
With that, let’s look at the non-existent ‘inflation’ in the mining sector.
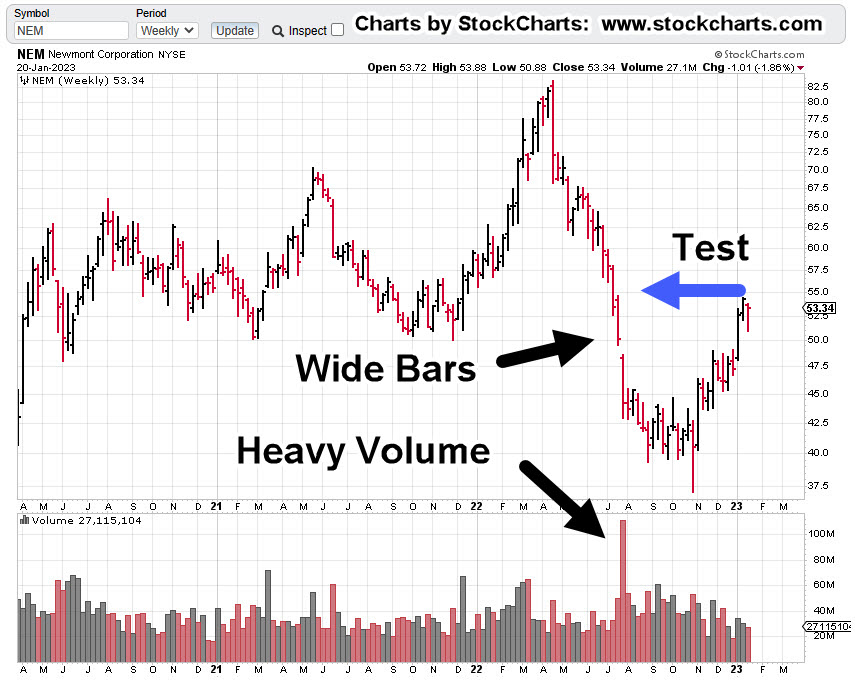
Newmont Mining NEM, Weekly
The first chart identifies the heavy volume and then test of wide price bars. This behavior is common in the markets; they tend to come back and test wide high-volume areas.
Next, we see there’s a terminating wedge developing as volume declines; the inference, is lack of significant commitment at these price levels.
We’ll get close-in on the wedge; last week printed a lower weekly low and closed lower for the week.
There’s no breakdown of the wedge … yet.
At this juncture, it’s up to the bulls to show they’re still in control.
Inflation vs. Scarcity
We have without a doubt, the effects of the event from the past three years gaining momentum. Whether or not those effects reach a peak this year, is unknown.
A lot of the mainstream and YouTuber’s alike talk about the upward move in gold as the result of ‘inflation’.
Here’s a little bit of insight you’ll not find anywhere else; how about gold rising because the above mentioned ‘effects‘ are causing production volumes to decline?
Maybe it’s because of scarcity (along with nearly everything else) that’s causing the increase in price.
Just to drive that idea home, the latest total gold production numbers, listed here.
Gold production for 2020 dropped -8.2%, from the year prior. Year 2021 was down -1%, from 2020.
From 2010 to 1019, gold production increased or was flat year over year … that is, until 2020.
Note: Posts on this site are for education purposes only. They provide one firm’s insight on the markets. Not investment advice. See additional disclaimer here.
It looks bad for being short biotech and maybe it is.
However, as we’ll see below, the leveraged inverse fund LABD, could be completing its reversal set-up.
While today’s thrust higher in the overall markets was not unexpected (shown here and here), one should take note of the violence.
As of this post, from yesterday’s low to today’s high, the Dow has moved over 1,000-pts.
It’s what happens next that’s important.
Weak shorts are probably terrified, have covered, now wondering what went wrong.
So, let’s take a look at the short position on biotech SPBIO, and see if it really is ‘wrong’ (not advice, not a recommendation).
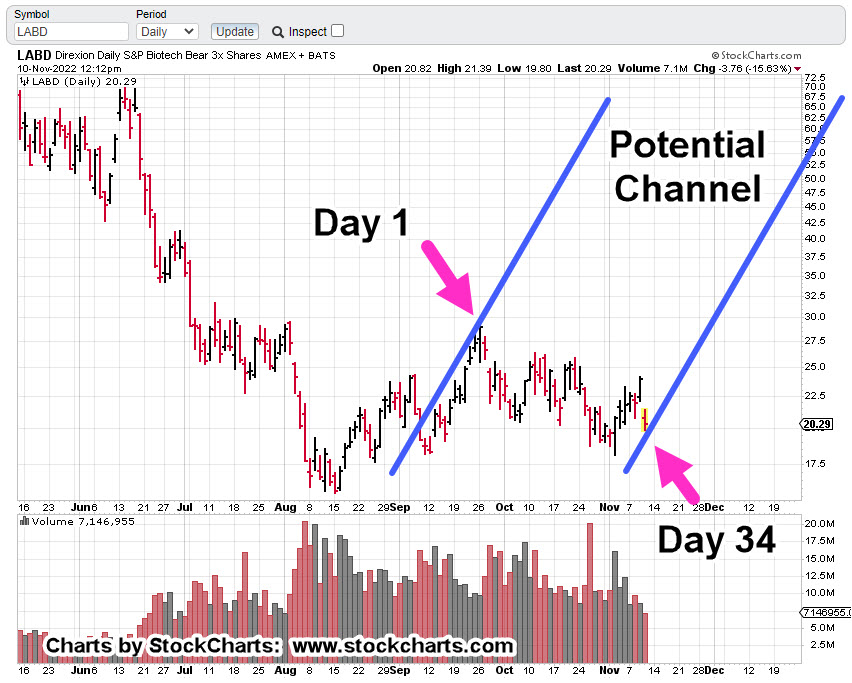
SPBIO, Leveraged Inverse Fund LABD, Daily
What we can see (above) is that LABD, is following the Wyckoff Schematic near exact for a spring set-up.
It’s just that today’s move is especially sharp and so one would think the set-up has failed … not so fast.
Another reason to think we’re completing a test of the spring, is below. Today is Fibonacci Day 34, from the high (low on SPBIO), set on September 26th.
We also have a potential trading channel as well.
As this post is being created, LABD is hovering at its lows; currently (as of 1:30 p.m., EST) trading at 19.89
Summary
Yesterday was an important day but it was not obvious, and not (yet) directly related to the markets.
A report was released on ZeroHedge (link here) which essentially confirms what some of us in the proletariat have known for years … if not decades.
It’s now out in the mainstream.
How long before the ‘elephant’ makes its way there also?
If indeed we’re at a reversal test of biotech and if that test passes (SPBIO downside continues), the move has the potential to be historic.
Positions, Market Stance (courtesy only, not advice).
LABD-22-09:
Price action blew through the stop located at 20.21 and is now hovering at those levels. The LABD position is being maintained but will likely be reduced in size as we head into the close (not advice, not a recommendation).
Special Note:
This sector and leveraged inverse LABD are highly volatile. Character of the market can change at any time.
Note: Posts on this site are for education purposes only. They provide one firm’s insight on the markets. Not investment advice. See additional disclaimer here.
The $2-Trillion Op-Ex today, provided upward bias for the overall markets.
Not expected, was biotech SPBIO, to be part of that move.
After today and possibly because of this announcement, we’re out of the sector until price action demands attention.
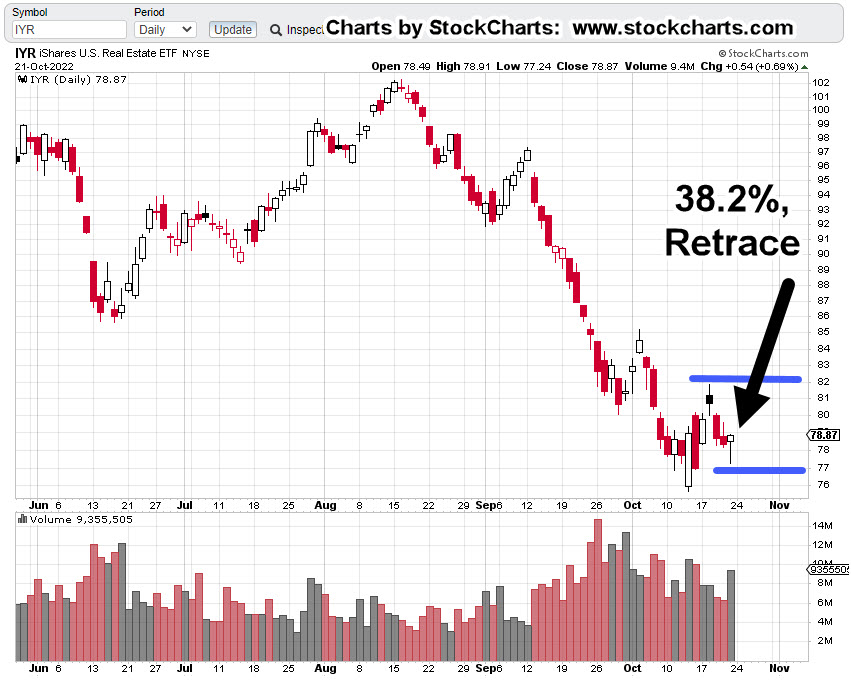
While the Dow, S&P, NASDAQ were up significantly for the day, obviously absent, was real estate (IYR).
Days like today help narrow the focus. Who is not participating in the up move?
While the other indices are up multiple percentage points, IYR, finished the day up only +0.69%.
Real Estate (IYR) Weekly
The prior linked YouTube post from Scott Waltersis not the premise for going short (not advice, not a recommendation).
It is, however, a reminder that what’s going on, is at a level no one has seen before.
Unless IYR, somehow gets out of the channel, it’s declining at -84%, annualized.
The set-up for this short trade (DRV-22-05) is based on a weak retrace (to 38.2%) on the daily with the anticipation, today’s reversal bar will ‘fail’ at the next session.
Real Estate, (IYR) Daily
The expectation for the next session is straightforward; lower open or gap-lower open and posting a new daily low.
The chart of IYR below, shows what we’re looking for (not advice, not a recommendation).
Obviously, a new daily high at the next session negates the set-up and warrants a trade exit.
A new daily low and we’ve got a ‘failure’ of the reversal bar; DRV-22-05, is liklely to be increased (not advice, not a recommendation).
Note: Posts on this site are for education purposes only. They provide one firm’s insight on the markets. Not investment advice. See additional disclaimer here.
Well, another financial media lie has come and gone.
As Jerrimiah Babe says, time stamp 6:05, at this link:
“The good times are over.”
The Dow Jones was down over 1,000 points on the day and finished (along with the S&P, NASDAQ) right at the session lows.
Typical action for the markets under such conditions, is a follow-through at the next trading session, Monday.
Recall, it’s been presented many times on this site (Holiday Turns), major reversals tend to occur just before, during, or just after, a holiday week.
The 2008, countertrend reversal took place on the Monday (5/19/08), leading into Memorial Day Weekend. The big one in 1929, was the Tuesday (9/3/29) following the Labor Day Weekend.
The current reversal (discussed below), if it holds, has come a couple weeks early in the ‘holiday’ window.
It’s possible because of the massive size of this monster, that a week or two does not make a difference.
Let’s look at the Dow 30 and its perfect Wyckoff Up-Thrust, Reversal, and Test.
Dow 30, DIA Daily Close
Daily Close with Fibonacci retrace levels identified.
A close-in look on the reversal area.
Looking at the zoom-chart above, we had a Wyckoff Up-Thrust that touched 61.8%, then declined sharply before coming back to test at 50%.
After the test was another sharp decline. One can make the case, the up-thrust has been tested.
Continued (overall) downside is the higher probability with a ‘no Fed pivot’ providing the tailwind.
Note: Posts on this site are for education purposes only. They provide one firm’s insight on the markets. Not investment advice. See additional disclaimer here.
This just out from Activist Post, shows we’re in yet another ‘never before seen’ event.
One of the references in the article can be found at this link.
Many times on this site, the ‘reduction in size’ has been discussed.
Now, the official numbers are starting to show-up. The bottom line? Retail demand is going to evaporate.
As a side note, it’s interesting that YouTube now has videos on how to spot Myocarditis …. something we’ve (in the serfdom) have never heard of … until now.
While everyone seems to be focused on the overall markets, S&P, Dow, and QQQ, underneath the radar, gold and the miners continue to rachet themselves lower.
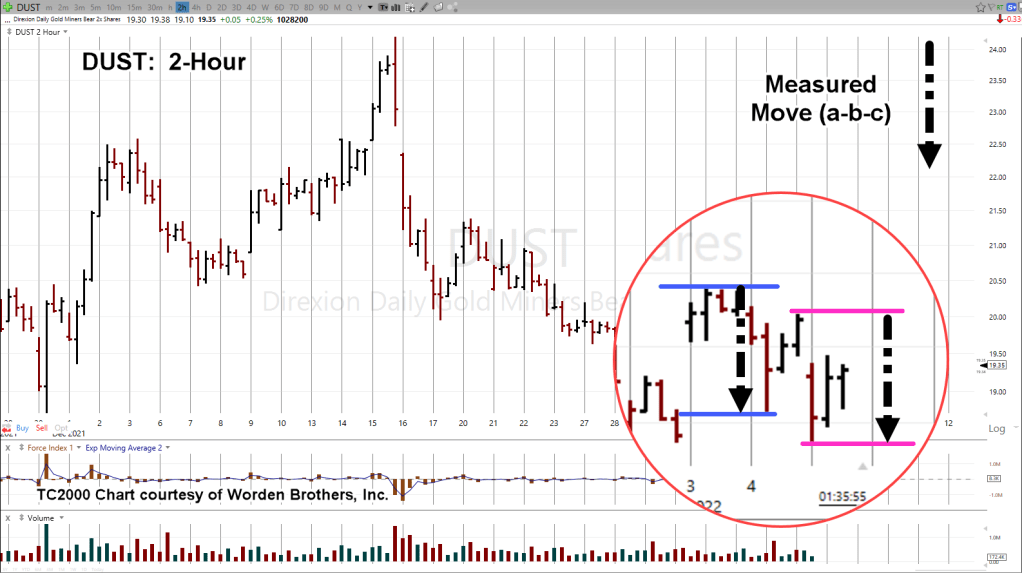
Senior Miners, GDX & Inverse DUST
The 2-Hour chart of inverse fund DUST shows we’re still at the danger point discussed yesterday.
The zoom chart (below) has an interesting distinction.
The distance between the blue-line trading range and the magenta-line trading range, is the same. The black-dashed arrow is equal length.
This implies that yesterday’s move, along with today’s may be an ‘a-b-c’ correction. A counter-trend move.
If so, the main direction has changed from down to up (for DUST).
Summary:
Still at the danger point, we remain short this sector (not advice, not a recommendation).
The good part, if price action reverses in DUST and begins to pressure the most recent lows, it’s an indication something else is afoot and the trade is failing.
Note: Posts on this site are for education purposes only. They provide one firm’s insight on the markets. Not investment advice. See additional disclaimer here.
However, this fund is not like inverse ETFs; SDS, DXD, SOXS, QID, DUST, and so on.
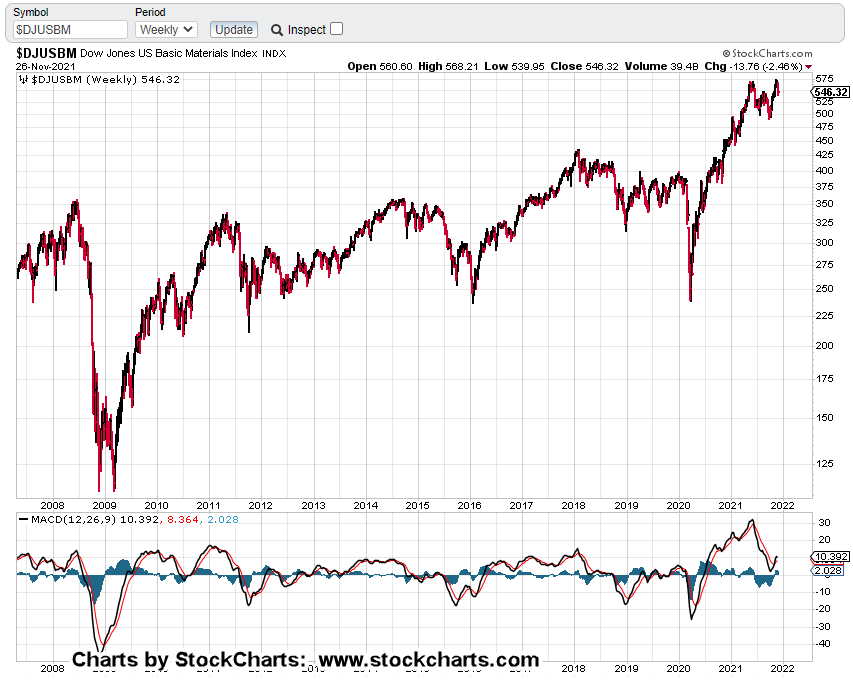
Basic Materials is not ‘popular’. At least, not yet.
That means the fund is illiquid with larger spreads (bid/ask). In addition, it takes a good few minutes after each open for those spreads to calm down and narrow up.
It’s not for the inexperienced.
Summary:
As we’ll get into tomorrow, ‘normal’, is gone.
There’s not going to be ‘normal’ (a personal opinion) in the lifetimes of anyone reading these updates.
That doesn’t mean there are no opportunities.
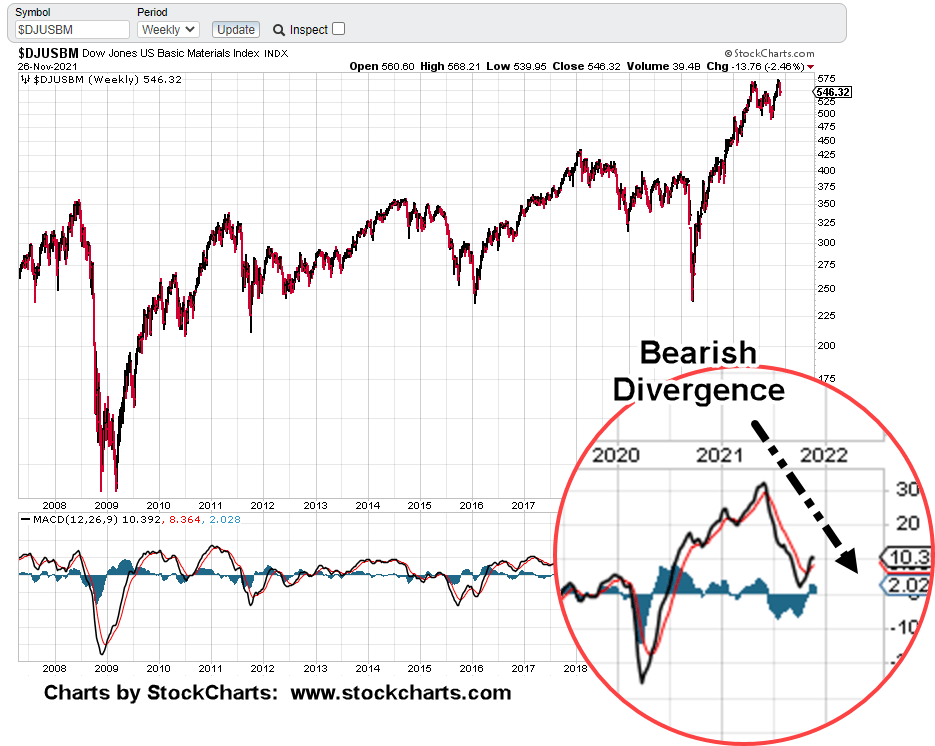
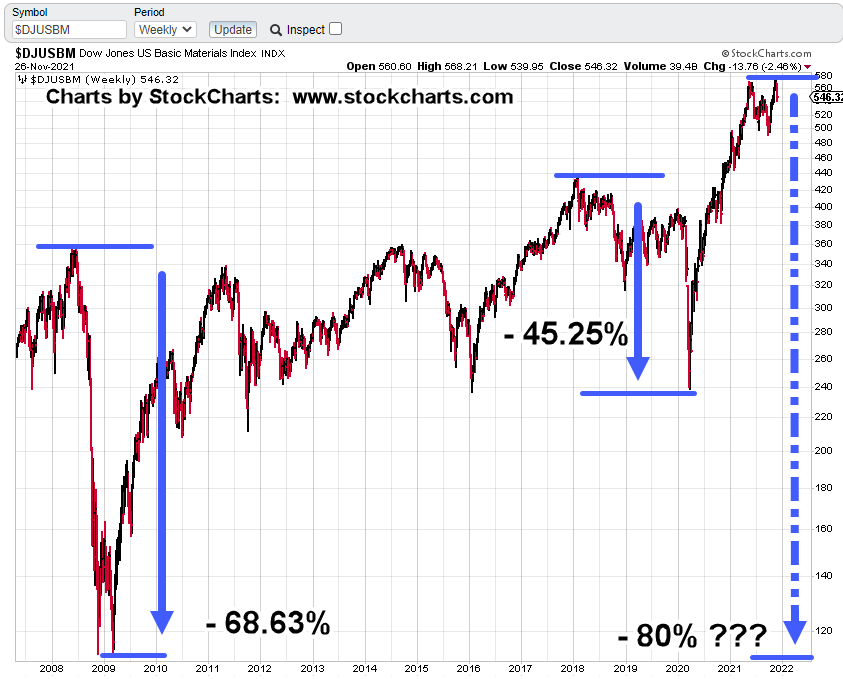
Basic Materials, DJUSBM, is about to, or already has (potentially) started its downside reversal.
Note: Posts on this site are for education purposes only. They provide one firm’s insight on the markets. Not investment advice. See additional disclaimer here.