In the weeks and months that followed, dollar updates proposed that because we’re looking at the longer weekly timeframe, ‘any rally is likely to go farther and last longer than anyone expects.’
So now, here we are.
ZeroHedge just acknowledged the obvious, with this report.
At the time of the original dollar analysis, it was (still is) popular to talk about the ‘imminent dollar collapse’.
That (dollar) post was released in the face of overwhelming opposition to any upside.
All of which, brings us to gold and silver.
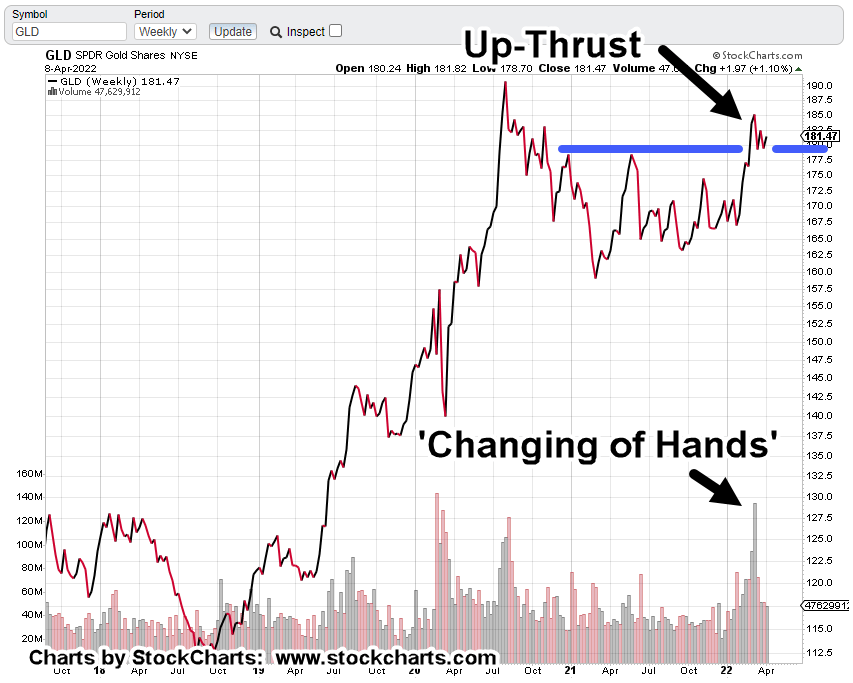
Gold’s ‘Changing of Hands’
With the passing days and weeks, it looks like the insight of gold (GLD) changing hands (here and here) is proving correct.
It’s not a popular view and it’s sure not getting any ‘clicks’.
However, as we’ll see below, there’s potential for gold and silver to head to much lower levels if not just temporarily.
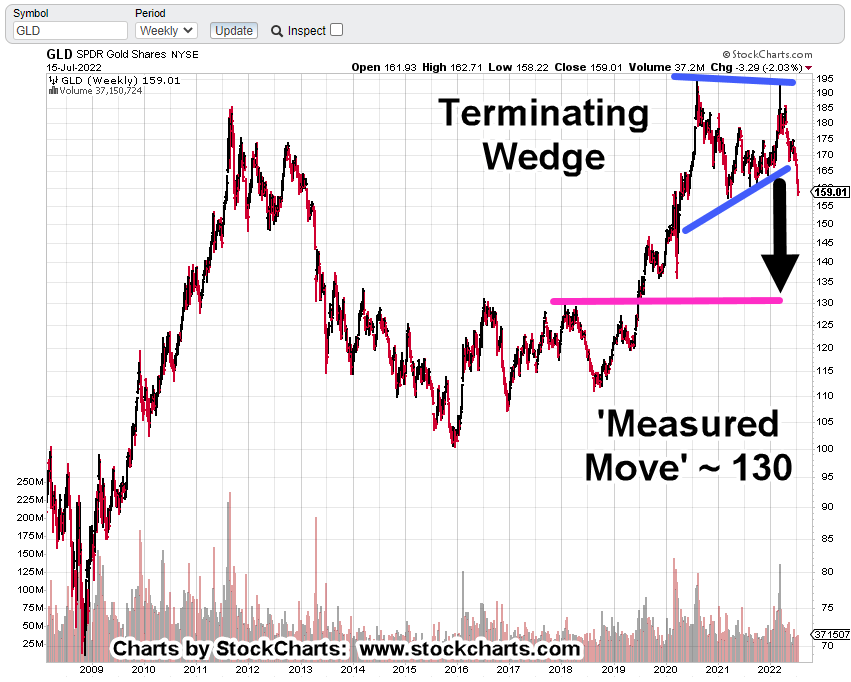
Gold (GLD), Weekly Bar
The wedge breakdown with measured move.
It’s clear, the 130 area, is an obvious support level.
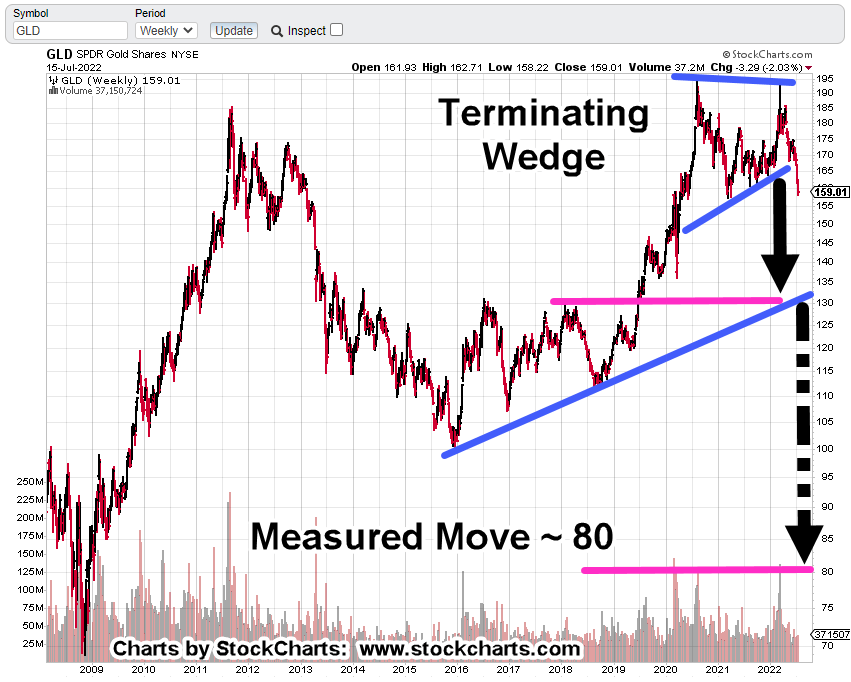
The sticky part, previously discussed here, what if somehow, gold heads lower after the measured move?
We may have something that looks like this:
If that happens, think of the confusion that would result.
From an ‘oligarch’ standpoint, it makes perfect sense.
We’ll not elaborate on that in an open (unsecured) forum.
However, let’s just say, we should keep in mind, it’s the corn and grain first, then gold and silver (not advice, not a recommendation).
Silver (SLV) projections are similar; potential targets at SLV 13 -14, then, if lower to single digits, around SLV 9.0 – 9.5
Summary
First it was, ‘The dollar’s going to collapse’, it’s ‘Imminent‘ (years ago).
Then, when that did not work out, it was the ‘Silver short-squeeze’ and we’re going to ‘Put it to the man!
Then, when that did not work out, it was ‘Gold’s going to $3,000/oz. in months, not years!’
Then, when that did not work out, it’s now ‘The Fed’s going to seize all your money.’
Ah ha! … We may have some truth but not in the way that’s obvious.
If the typical middle-class individual is maxed-out with debt, having overpaid for depreciating ‘assets’ such as cars and housing, there really isn’t much left in the banking accounts, right?
Retirement accounts … now, that’s different.
Covered many times (scroll to No. 3) on this site is just how easy it is (will be) to confiscate the IRA.
Note: Posts on this site are for education purposes only. They provide one firm’s insight on the markets. Not investment advice. See additional disclaimer here.
Anyone who thinks the Fed’s going to ‘pivot’ because the numbers are weak, does not understand (or won’t admit to) the real purpose of the entity; but I digress.
The Strategy
Way back in December of 2020, this post was released which discussed ‘Genesis 41’, specifically.
It was an intuitive assessment; we’re in a phase where corn and grain (i.e., the food supply) are potentially more important than ‘stacking‘ silver or gold.
Over the ensuing year and a half, how correct, that has proven to be.
Then, nine-months ago, was this post, presenting the ‘elephant’; a massive population decline whose repercussions would last the lifetimes of anyone reading.
Now, we have this. A report that confirms the elephant.
It’s all starting to hit the mainstream, although the language is still being couched to not cause undue panic. Good luck with that.
So, what’s next?
The Danger Point: Real Estate
While mainstream press and money managers alike struggle to figure out the obvious, we have price action itself telling us the next likely direction of the market.
During an economic downturn there are many places not to be such as semiconductors, airlines and other low margin businesses, restaurants and so on.
However, the most illiquid of all, is real estate. It does not matter how bad one wants to sell, if there is no buyer, there is no sale.
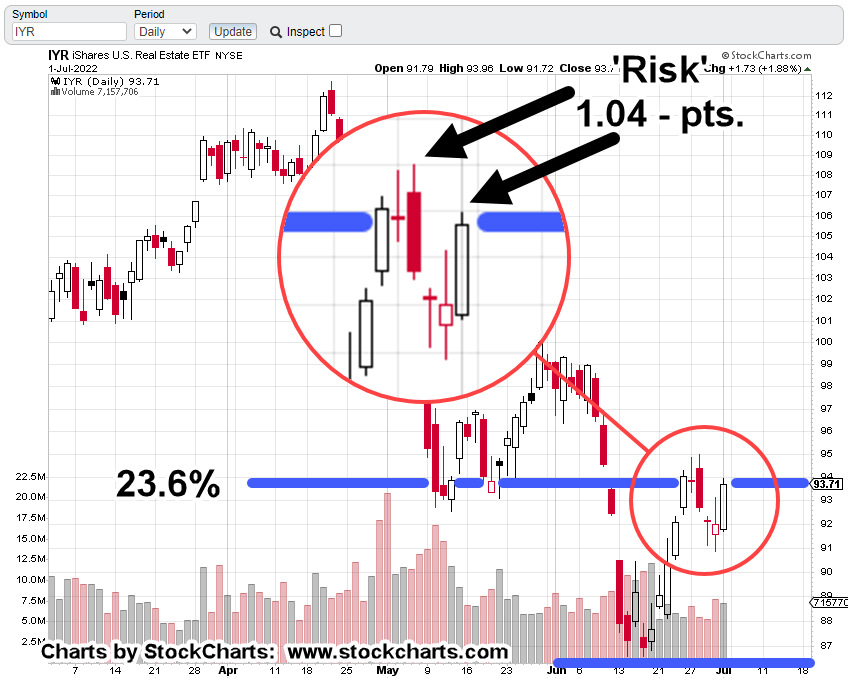
Real Estate IYR, Weekly Chart
Last week, real estate IYR, closed right at the Fibonacci 23.6% retrace as shown.
Getting closer in on the daily, it’s marked up to show the risk from a shorting perspective (not advice, not a recommendation).
Real Estate IYR, Daily Chart
In this case, the risk on a short position is defined as the distance from last Friday’s high (IYR: 93.96) to that same week’s high of IYR: 95.0
Let’s add, Friday’s action saw IYR, retrace a Fibonacci 76.4% (the most available) of the entire move for the week.
The Summary
Amazon (AMZN), ProLogis (PLD), and Real Estate IYR, are joined at the hip.
Now the economy’s imploding, massive warehouse space is not needed.
Ditto that for employees as well.
ProLogis is already down – 31.2%, from its all-time highs set just this past April.
We’ve already shown PLD, has a nasty habit of going straight down during a market route.
Last time, PLD, crashed over – 84%, in just two months.
Note: Posts on this site are for education purposes only. They provide one firm’s insight on the markets. Not investment advice. See additional disclaimer here.
Wyckoff and Fibonacci analysis allowed the reversal of gold miners GDXJ, to be identified to the week and then, to the day.
A quick review of this post, is the reversal on a weekly basis and this one is a follow-up, showing Fibonacci correlation on a daily basis.
If we want to go way-back, this report, shows the miners were not in a bull market and have not been for some time; for years, actually.
That does not mean there were no trades for upside or downside; there were.
However, from a strategy standpoint, gold miners are not bullish.
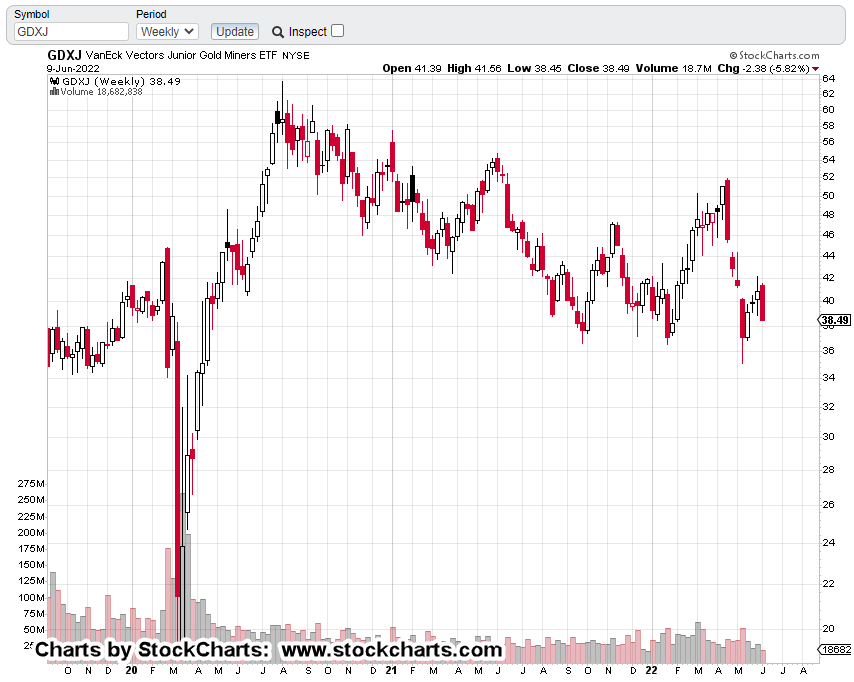
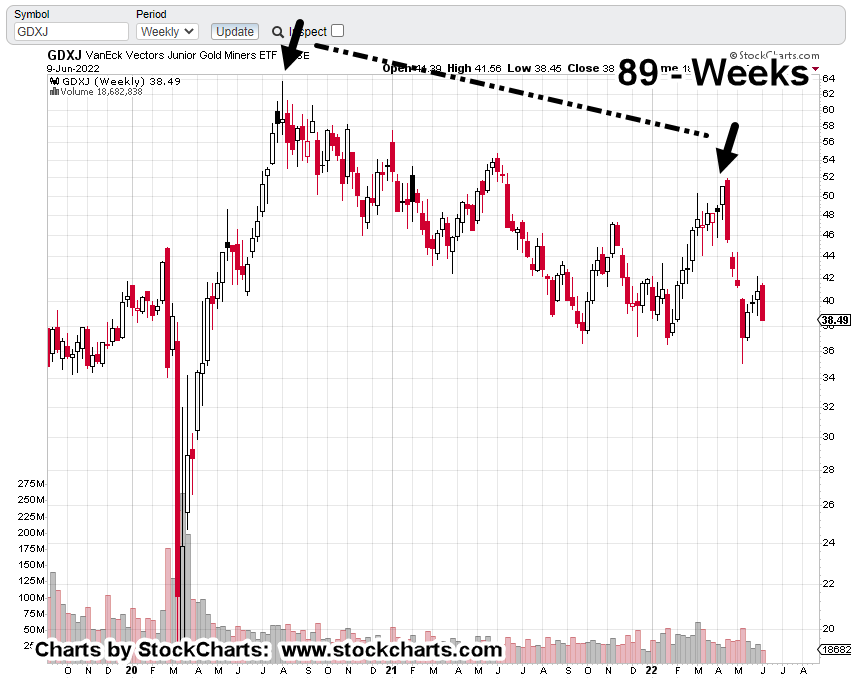
So, let’s look at the Junior Miners GDXJ, as it’s the weakest in the sector.
Junior Miners GDXJ, Weekly Chart
Un-marked
First Mark-up
The reversal is at Fibonacci 89-weeks, plus one day.
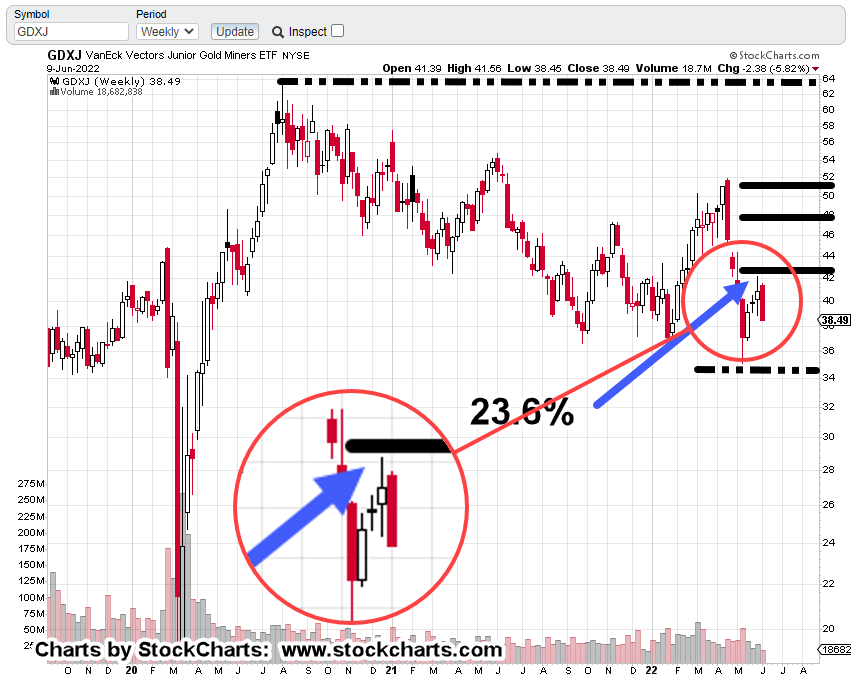
However, it’s the next chart that’s more disconcerting for the bulls.
Price action reversed right at a Fibonacci 23.6%, retrace; indicating severe weakness (if it holds).
The two black lines above the 23.6%, are 38.2%, and 50%, respectively.
The next chart zooms into the reversal area.
This week has already posted a new weekly low, providing additional confirmation of the reversal.
As gold, silver and the associated miners reverse lower, we have news reports of precious metals purchases going off the charts.
Where was everybody in 2001, as gold was bottoming?
That’s, 2001 – to – 2022, a Fibonacci, 21-years.
Which brings us to the next point.
The YouTube “Herd”, is Forming
Several YouTube sites that have been monitored for years, have recently blown-up, passing 100,000 subscribers; more than a few are past 200,000 or higher.
Recently, they have started giving each other ‘shout-outs’, to indicate their approval of that particular site’s ‘content’.
Viewer, Beware
By definition, the ‘herd’, does not have the right answer.
Each one is now monitoring what the other one is doing; they are all, influencing themselves.
The only way to have a hope of getting unique insight is to remain aloof. Wyckoff described this exact phenomenon in his autobiography.
He had very wealthy clients that wanted to get closer (unlimited) access to him. To this overture, he refused.
He isolated himself and remained cloistered.
Summary
Thus far, the analysis of gold ‘changing hands‘ remains intact. Gold continues to be well off its highs; silver is not anywhere close.
Strategy, Tactics, and Focus.
The Junior Miner’s reversal can’t be disputed … there it is.
If precious metals and the miners are not responding to all the ‘money printing;’, then something else’s afoot that’s not being revealed to us in the proletariat.
That ‘something’, is probably starvation … which gets us back to Genesis 41; corn and grain come first, then gold and silver (not advice, not a recommendation).
Note: Posts on this site are for education purposes only. They provide one firm’s insight on the markets. Not investment advice. See additional disclaimer here.
If you’re blowing whatever’s left of your money (or credit), it’s likely you have no real marketable (high pay) skills, no talent, lazy, obese; so, we’re off to Vegas.
Add to that, we’rejust at the start of the depression.
Patera, from Appalachia’s Homestead (time stamp 4:24) addresses the problem a little differently but her final assessment is the same.
It’s true, there are some barriers to learning a new skill.
Dan from i-Allegedly points out the high cost to get a CDL, to be a trucker.
However, those who are awake, those with their nose in the KJV Bible, those leaving the corrupt church (in droves), knew that current events were coming; they took action way before it became obvious.
Yet another indicator of the current strange weather (warfare) that’s going to strain the system.
Here’s the link to the very first post that specifically referenced Genesis 41; posted on December 31, 2020.
As with the ‘Mask on, Mask off (linked above), how has the post aged?
Is it still relevant?
What about this quote … seemed extreme at the time.
They paid for the corn first, with gold and silver. Then they paid with their livestock. Then they paid by selling themselves into life-long slavery. We can equate that last part (slavery) as getting the vax.
No. 5
Chess Board Strategy
It’s a bitter pill to realize we’re in the long game. ‘Normal’, is not coming back … ever.
That does not mean there’re no opportunities. There are.
Those opportunities (if we survive) are/will be potentially life changing for the good.
The Sunday futures market opened about two hours ago and we’re up around +0.40%, in the S&P.
Let’s see if that spills over to the Monday open; remembering that we’re short the real estate sector with the finger on the sell trigger (not advice, not a recommendation).
Note: Posts on this site are for education purposes only. They provide one firm’s insight on the markets. Not investment advice. See additional disclaimer here.
The food supply is, and is going to be destroyed; one way or another.
The latest in this ‘planned’ series of events, can be found here and here.
More information on the first link, is here. The initial paragraph says it all.
That second link calls the news a ‘Black Swan’ event.
Really?
It’s been known for years and reported by those who are brave (moving forward despite ridicule, threats, bank account closures), and who had insight, times like these were coming.
As a result, (i.e., since the Derecho) the commodities, specifically corn, have risen dramatically.
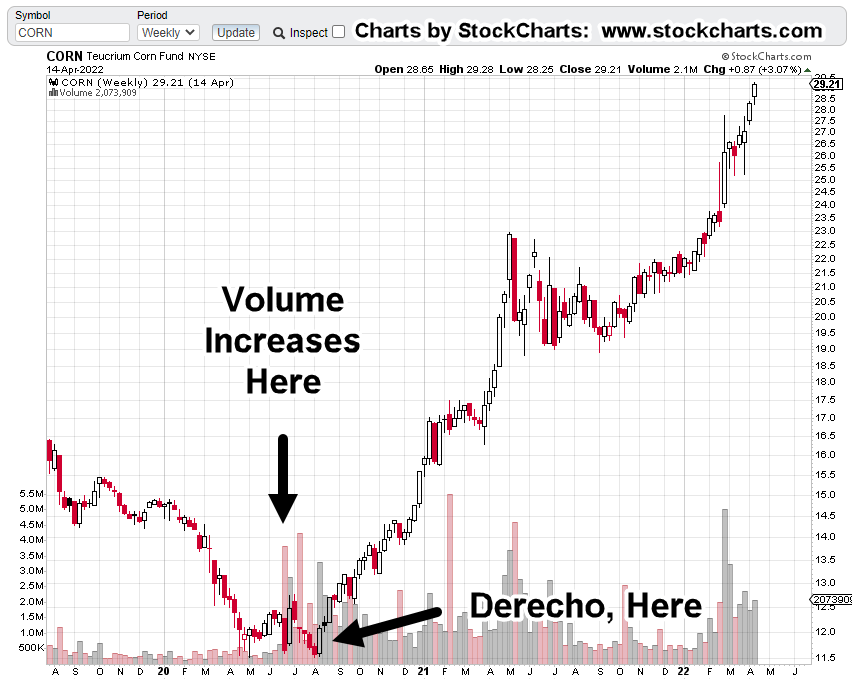
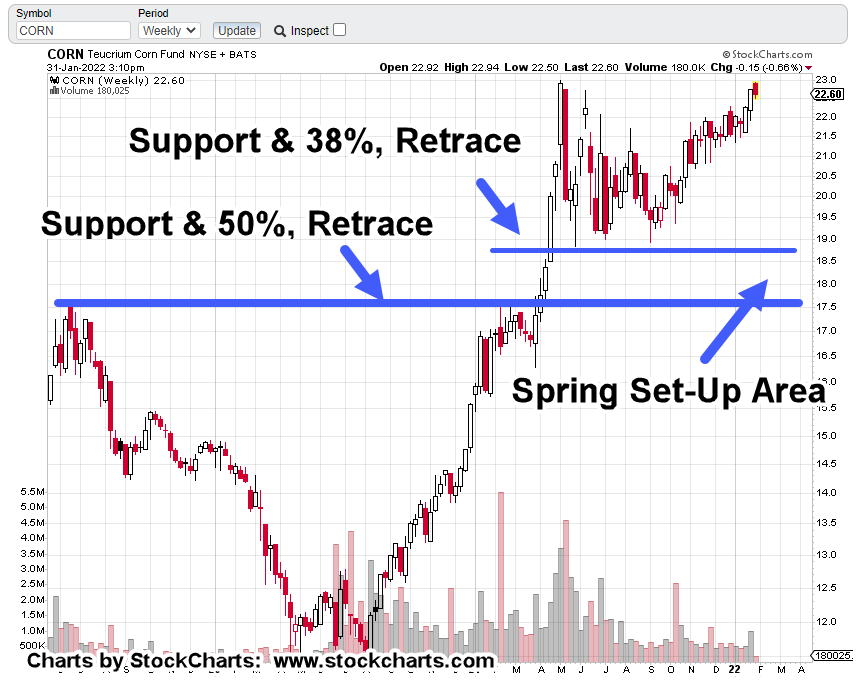
Teucrium tracking fund, CORN, Weekly
Looking and the chart, several items of note.
First: Volume picked up markedly in the fund, before the Derecho of 2020. Almost like someone knew something was about to happen … which it did.
Wyckoff said it best a century ago … those in the know, will have their actions show up on the tape.
Second: We’re currently in Fibonacci Month 21, since the Derecho. Does that mean we’ll have another market event?
Let’s see how the fertilizer news affects the futures market at the next open.
However, more specifically as posted in this update, we’re looking for some type of ‘administration’ announcement that temporally crashes the price of corn.
Third: Getting back to the chart of CORN, the right side is showing signs of potential distribution.
We’ve had the largest weekly volume, ever, during the week of March 4th.
After that, volume has remained elevated … a possible changing of hands and distribution.
Summary
Markets like to test wide high-volume print areas. There’s always a potential for that type of test in any market.
For CORN above, the high-volume area is around 23.00 – 23.50; an approximate drop of -21%, from current levels.
If we get some type of ‘export restriction’ announcement, a (temporary) 20-plus percent drop in CORN, is not unreasonable.
Note: Posts on this site are for education purposes only. They provide one firm’s insight on the markets. Not investment advice. See additional disclaimer here.
Note: Posts on this site are for education purposes only. They provide one firm’s insight on the markets. Not investment advice. See additional disclaimer here.
Note: Posts on this site are for education purposes only. They provide one firm’s insight on the markets. Not investment advice. See additional disclaimer here.
What if the ‘imminent collapse’ of the dollar is overblown by about 50 – years?
According to this just out, on private gold-filled currency, the article states average life of a fiat currency, is four generations. It goes on to say there are exceptions like the British Pound, continuing on even after hundreds of years.
The Black Swan
In Taleb’s book ‘The Black Swan’, he says it’s an event that nobody expects. It has long lasting repercussions and permanent change.
However, what most if not nearly everybody ignores or leaves out, is his alternate definition. That is:
A Black Swan can also be a future event that’s widely accepted as fact, that does not happen !!!
Is that where we are with the U.S. Dollar?
Even though the dollar has not collapsed and in fact, has rallied as we’ll see below, the ‘collapse’ talk continues unabated.
It’s easy to talk about dollar collapse.
It’s what gets the clicks. No matter that an actual collapse may be years if not decades away.
As of this post, how many ‘monopoly money’ YouTube videos can be found? Seems like it’s the same number or more than, ‘gold to skyrocket higher’.
Well, so far, gold has not skyrocketed higher.
On top of that, this site’s even provided an exclusive correlation that gold’s moving inversely to corn.
See ‘Insight Note‘ at the end of this post.
Ever since the ‘Derecho‘, it’s never been the same.
Back to the dollar.
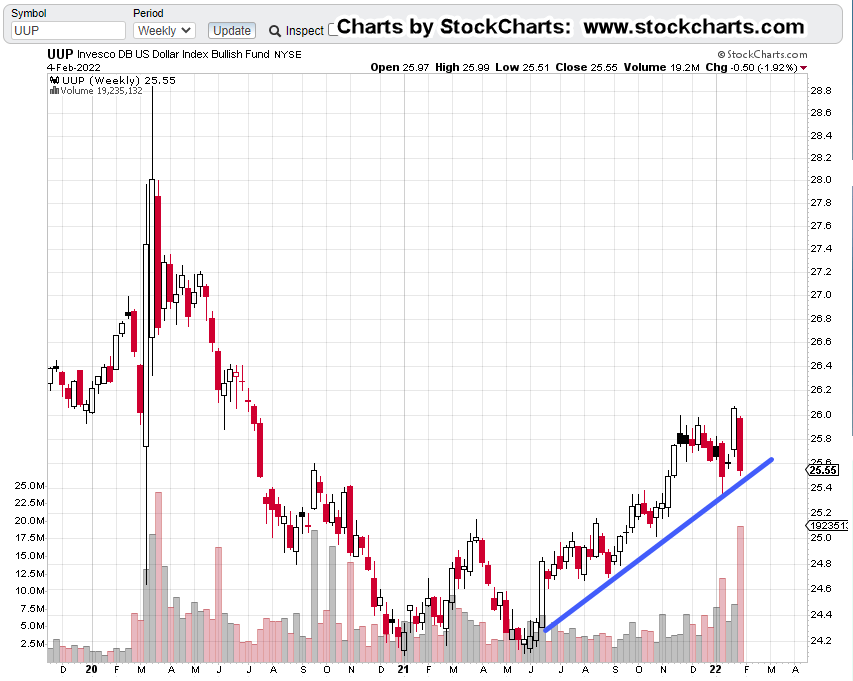
No doubt, the dollar was whacked over the past trading week. Let’s take a look at what the UUP, price action is saying about itself.
Dollar, UUP, Weekly Chart
The unmarked chart shows the dollar oscillating, testing support for six-months at the beginning of 2021.
Then, in mid-June ’21, UUP pivoted decisively higher (gold, GLD, pushed lower) and never came back to those levels.
Of course, this past week The Usual Suspects were out talking about the dollar and ‘monopoly money’.
The chart below shows last week’s bloodbath has served to bring UUP, down to an established trend-line.
It’s important to note, with all that (down) volume, the most since early 2020, UUP was not able (thus far) to break through the trend (blue line).
That leaves the dollar at or near, the danger point.
Continued, sustained selling, risks breaking the uptrend.
If the opposite takes place and UUP starts to rally, last week may have been an inflection point (to the upside).
Gold (GLD) and the dollar appear to still be inversely correlated.
Summary:
Ever since removal of the link to gold in 1971, the dollar has the potential to collapse at any moment.
However, in this case, we at least have some historical precedent that on average, fiat currencies tend to last four generations before becoming worthless.
Wyckoff sates in his writings over and again, ‘somebody always knows something’.
If there’s a collapse afoot, he tells us to look at what the market is saying about itself (not advice, not a recommendation).
Note: Posts on this site are for education purposes only. They provide one firm’s insight on the markets. Not investment advice. See additional disclaimer here.
The Danger Point®, trade mark: No. 6,505,279
Insight Note:
It’s been a strange coincidence over the past year or so, ideas presented on this site make their way to certain YouTube sites either in the titles, or within their content.
The timing of this phenomenon, that within a day or two, ‘post it first here, see it on YouTube there’, has occurred more times than one would consider as just ‘coincidence’.
Admittedly, the insights (making their way to certain YouTubers) have not been exclusive … that is, until now.
Recognition of the Gold/Corn inverse correlation, first posted here, is unique to this site.
As far as is known, this correlation has not been presented on any other financial site or YouTube channel or any other medium.
It may be an important data-point and map into this site’s long-time premise; it’s the corn and the grain first, then gold and silver (not advice, not a recommendation).
For more detail, search for Genesis 41.
When ideas from others are incorporated into the analysis presented on this site, full acknowledgement of the source is cited.
As Dr. Elder said in his book ‘Come Into My Trading Room’:
“I have zero respect for thieves”
He’s talking about the theft of his book title: “Trading For A Living”. He goes on to say, (paraphrasing)
‘Do you really want to use market analysis or input from someone that can’t think for themselves?’
Authorization:
Therefore, this footnote is authorizing the further use of the Gold/Corn inverse correlation by others in the industry if they so choose with the following caveat:
If one of the sites monitored (or some other media) uses this exclusive insight, and does so without referencing the source, it puts this author in the unenviable (but not unfamiliar) position of calling out the thief by name … not unlike what Stew Peters is doing (to the hoax/genocide perpetrators) on his broadcasts.
This market environment’s providing a fantastic public service:
It’s separating out the hucksters, the shysters and the otherwise incompetent from those who are, or who are striving to provide a service or useful insight.
The general investing public may find out soon enough, they’re on their own. Maybe unbeknownst to them, they’ve always been on their own.
For the evening/overnight session, both gold and the S&P futures have opened lower.
The S&P is down 50-pts, nearly 1.10% (at about 8:15 p.m. Eastern) and already penetrating the last session’s low.
The number of technical factors concerning gold, the miners and especially the Junior Miners GDXJ, is significant.
We’ll cover just a few in this update.
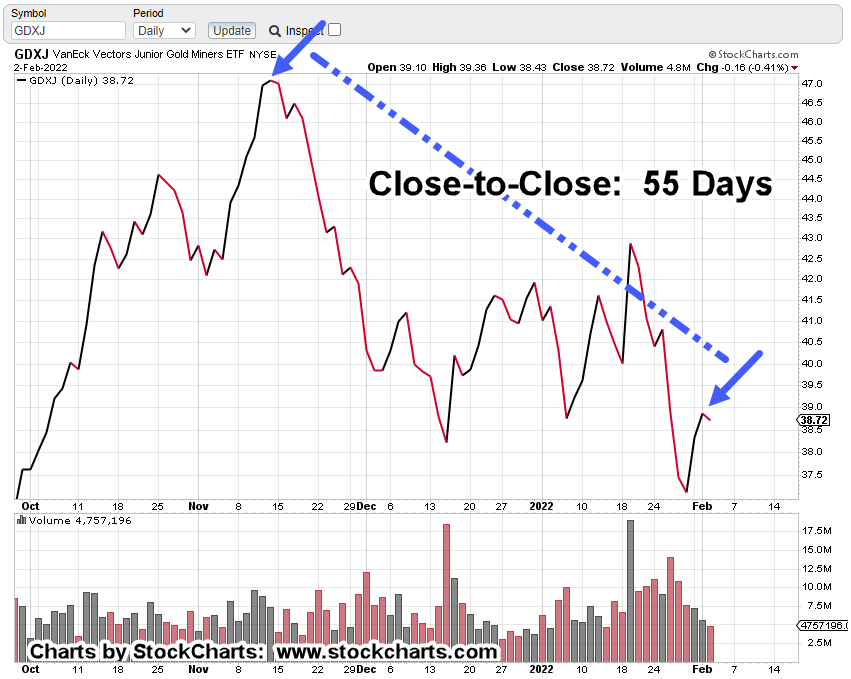
Junior Miners, GDXJ: Daily
The un-marked daily chart shows GDXJ oscillating but in a general downward trend:
The next chart shows price action posted a reversal bar right at Fibonacci 23.6%, for the entire move; from the breakout highs in mid-November ’21, to the lows on January 28th, this year.
A ‘Fib’ retrace of 23.6%, is rare and if it holds, indicates significant weakness.
The next two charts present a case for why this shallow retrace may indeed hold and thus, indicate the start of the next leg lower.
On a print basis, it’s been a Fibonacci 55 (+1) days from the GDXJ print high on November 12th, 2021, to the high posted today (2/2/22).
The next chart shows that November 12th, 2021 was also the closing high of the breakout set-up.
The Important Part:
Yesterday, was the closing high of GDXJ (so far) and that makes it a perfect Fibonacci 55-Days, from peak-to-peak.
The last update on the miners showed significant down-pressure at support levels, unlike previous visits to the area.
Looks like we’ve had the rally that was forecast; that rally may now be fading.
“It’s reasonable to expect an attempt to rally in the coming week … but with this much down force, a successful rally is not the high-probability outcome.”
Gold Could Hold
Already discussed, is the idea, the actual price of gold may hold steady or even go higher and yet the mining sector collapses.
As Dan from i-Allegedly posts in this report, Italian wine makers are having a hard time getting corks for their bottles. That’s right, corks !!!
Does anyone really think a massive mining outfit is going to be able to source all they need to continue operations without interruption?
Let’s not even get started with the ‘sustainability’ corporate failure already baked into the cake 🙂
“For we wrestle not against flesh and blood, but against principalities, against powers, against the rulers of the darkness of this world, against spiritual wickedness in high places.”
Sorry for those who think it’s all a ‘myth‘. I’m with Good Patriot on this one (time stamp 17:09); that we’re in a battle surpassing all that’s come, since 33 AD.
Gold & Silver
Hard assets: Good to have for sure (ammunition, seeds and egg-laying hens may be better) … but if we’re really in a similar event to Genesis 41, that means the corn and grain come first, then gold and silver.
Summary:
This post started with the S&P down about -0.80% and it’s now down -1.10%, posting a new daily low.
Gold is down slightly, holding steady but that’s already been discussed above.
Remaining short the sector via JDST-22-01 (not advice not a recommendation).
Position size on JDST-22-01, has been increased. More on that in the next report.
Note: Posts on this site are for education purposes only. They provide one firm’s insight on the markets. Not investment advice. See additional disclaimer here.
What we’re looking for here, is some kind of Jimmy Carter type stunt where corn exports are halted in the name of ‘national security’ or some such thing.
More detail on the Carter grain embargo at this link … scroll down to No. 12
Of course, if that happens, corn is likely to crash (like it did last time) if only temporarily.
More Is Less
A corn embargo means more corn for us, right?
Probably, wrong.
Remember, fertilizer prices are sky-high.
Elevated corn prices (like now) might just cover the cost for the farmers … maybe.
A corn crash in the commodities would likely mean even less corn gets planted … maybe none at all.
Enter, The ‘Bought And Paid For’
It may be that easy (as above), or get complicated because a major consumer of U.S. exported corn, is China.
Exports to China over the last year have literally gone off the scale. Add to that, China is the number two holder of U.S. Debt.
So, one can already see where this may be going.
After the initial fake panic where the politicians realize there’s a crisis (that part being real), which they themselves created, they’ll likely pontificate about halting exports for just long enough, to have farmers throw in the towel with no spring planting.
After all of that, and let’s not forget special investigative news coverage about ‘how all this happened’; blame it on climate change and then keep everything the same.
Exports continue (to China) as much as possible and the U.S. citizens starve … literally.
By the way, go to time stamp 24:04, at this link and look at the clouds in the upper right. For those awake, it’s clear; right angle, cross-hatch pattern.
Right angles are not a natural phenomenon. Whatever climate change there is, is the one being created.
When Corn Takes The Dive
If or when corn takes a hit, price action itself will define the correct trade action.
So, let’s be ready and not surprised, if we see corn in chaos.
Note: Posts on this site are for education purposes only. They provide one firm’s insight on the markets. Not investment advice. See additional disclaimer here.