Doing What It Does

Nat-Gas likes to spike at reversals.
In that sense, it’s similar to the silver futures market; it’s just what they do.
A spike does not guarantee reversal.
However, when we get one like today’s early morning (pre-market) session, it’s time to watch and position for what happens next (not advice, not a recommendation).
The futures chart link here, shows the early morning spike to 1.946. Now, we’re getting a recovery and test.
So, What’s Next?
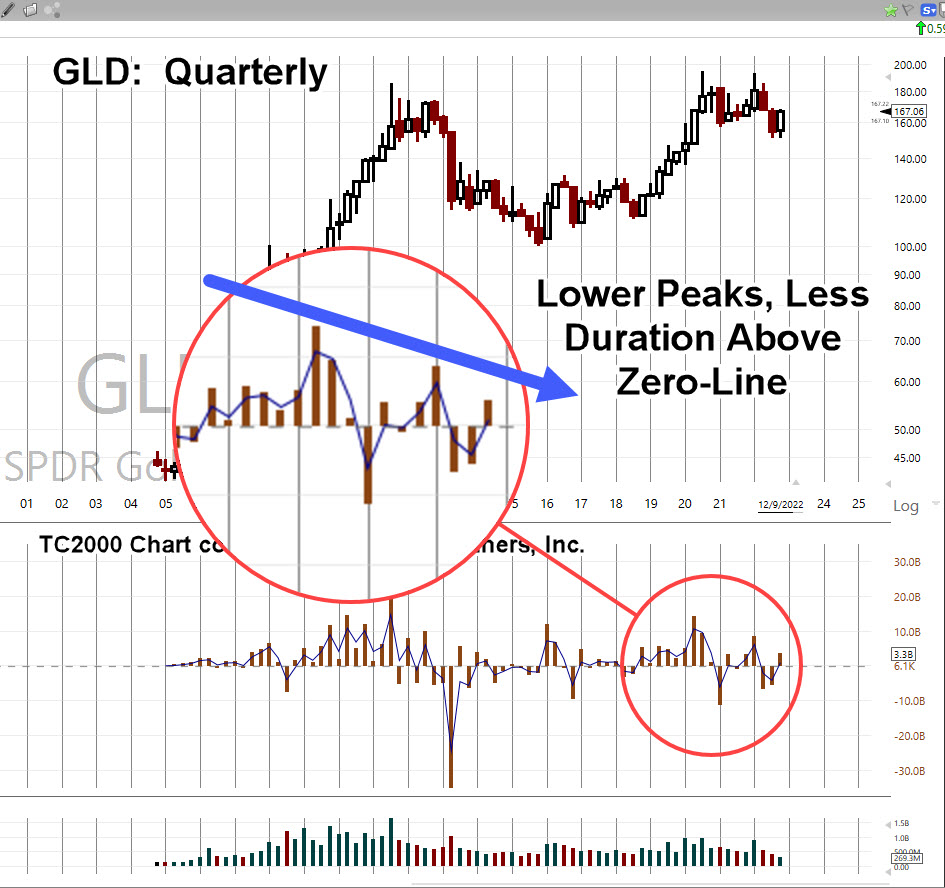
The fundamentals say, nat-gas is lower on ‘over-supply’.
That may be true but here’s where it gets interesting; supply can be ‘destroyed‘ in an instant.
In the above article, the colloquial ‘ZeroHedge Guys’ with astute comments, shed light here and here.
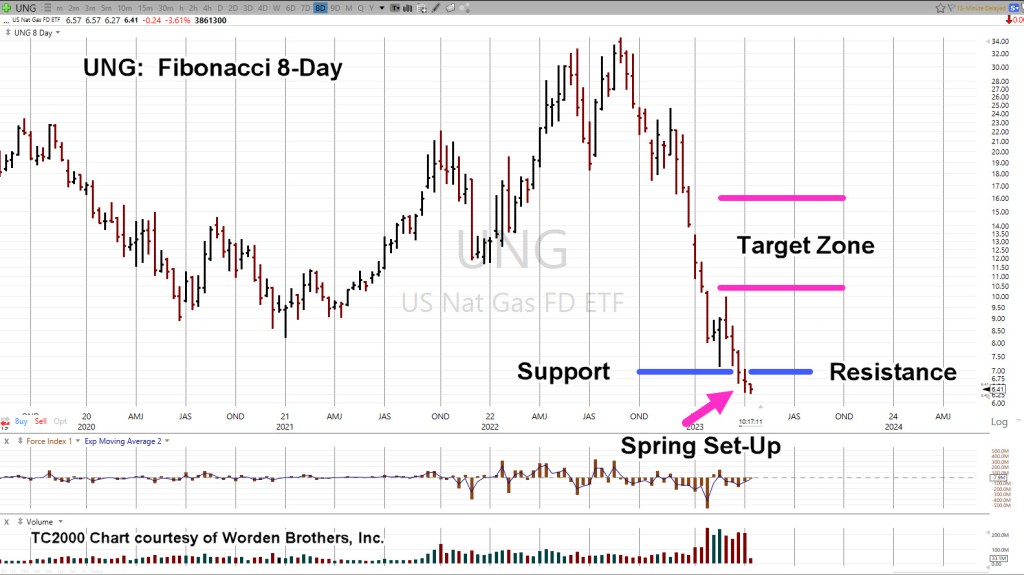
Moving on to the chart of Nat-Gas we’re looking at UNG on a Fibonacci 8-Day, basis.
Natural Gas UNG, 8-Day
The chart shows a Wyckoff spring set-up in progress.
We’ve pushed below support.
Now, early in the session (11:20 a.m., EST), price action is inching its way back to test the resistance.

Positioning long at this juncture is potentially both strategic and tactical (not advice, not a recommendation).
Strategic in the sense, we’re operating in an environment of possible ‘shortage’ and ‘disruption’.
Tactical in the sense, nat-gas tends to reverse on a spike (either up or down).
Probabilities have put the odds to the upside.
Target Area(s)
If nat-gas gets to the target area shown, we can expect the requisite chaos to be part of the picture.
As Livermore frequently said, we’re looking at ‘what is’ and not what we want it to be.
If this is a medium to long-term move, we’re still in the very early stages.
Stay Tuned
Charts by StockCharts
Note: Posts on this site are for education purposes only. They provide one firm’s insight on the markets. Not investment advice. See additional disclaimer here.
The Danger Point®, trade mark: No. 6,505,279