Note: Posts on this site are for education purposes only. They provide one firm’s insight on the markets. Not investment advice. See additional disclaimer here.
Warehouse vacancy space in California’s industrial sector is increasing and the consumer, may have finally spent themselves into oblivion.
Let’s throw on top, the food supply continues to contract just as forecast.
With all that, one can ask:
‘Just how’s silver going to enter into a bull market under these conditions?’
So far, since this post and this one, over two years ago, it hasn’t (not advice, not a recommendation).
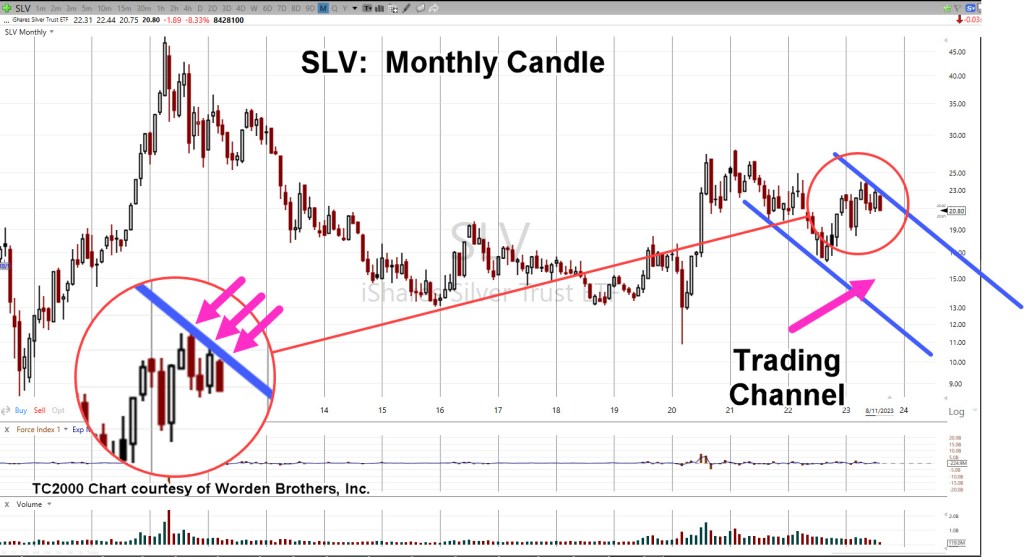
A New Down Channel
Silver continues its bear market that started way back in April, of 2011.
However, early-May and late-July peaks in SLV, appear to confirm the right side of a new down channel.
Silver SLV, Monthly Candle
With successive hits on the right side, trending down, there appears to be a significant barrier to moving higher.
The next chart uses a standard Fibonacci projection tool, showing potential downside targets.
The critical area on the chart is the ‘23.6%’ projection to the SLV 19-area.
If price action retraces to this level and then starts to change character, it’s a possible bullish indication.
If not, and we push lower, SLV then continues on with its decade-long decline.
Sovereign Default … Waiting
There’s a lot of world-wide debt built up in the system.
China appears ready to collapse into a real estate depression … probably co-incident with our own.
Couple that with record level stock valuations, record margin borrowing and mass psychosis, not seen since at least South Sea Bubble of 1720.
Could it be, among many trigger-events, we get a sovereign debt crisis (assets dumped to pay debt) that send both gold and silver to much lower levels?
Note: Posts on this site are for education purposes only. They provide one firm’s insight on the markets. Not investment advice. See additional disclaimer here.
What’s happening in the markets is important but so is what’s not happening.
The SOXX, as of 1:15 p.m., EST has not made a new daily high.
Price action’s hovering in a tight range and looks to be coiling for a directional move.
If the breakout is to the downside as anticipated, here is where the ‘rules’ come in.
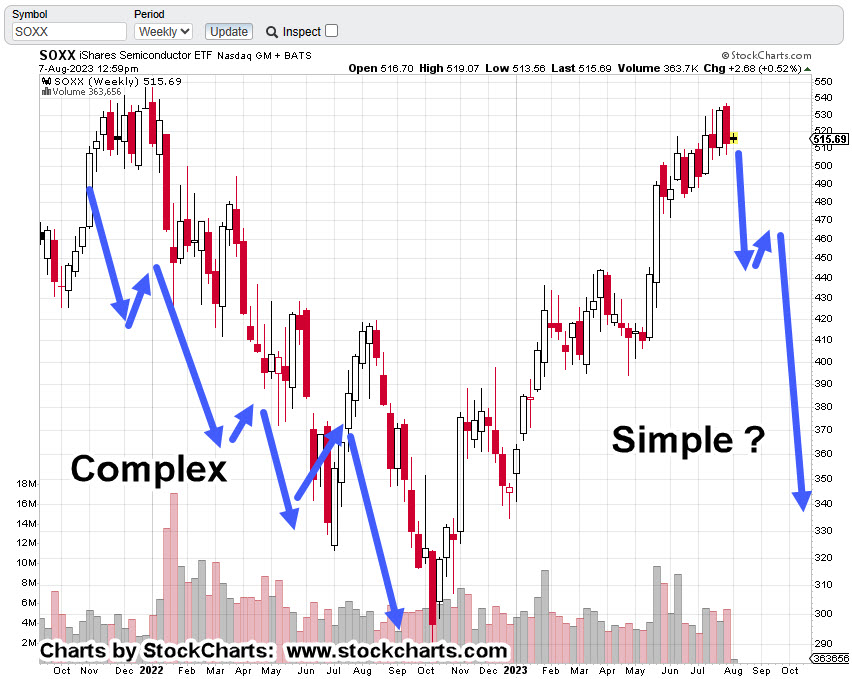
The ‘Rule’ of Alternation
Originally discussed by Prechter years ago, as an observation, the rule is basically described as:
‘The market will alternate in wave structure from complex to simple or from simple to complex.’
When we look at the SOXX, the implication is, we may be due for ‘simple’ wave structure (not advice, not a recommendation).
Semiconductors SOXX, Weekly Candle
The weekly chart shows the potential.
The first leg down was complex, overlapping price action.
If there’s a break to the downside, the ‘rule’ says to expect price action to alternate from a prior complex structure, to simple (not advice, not a recommendation).
The Maverick of Wall Street
One recent example of such a move can be found at this link, time stamp 11:20.
Note: Posts on this site are for education purposes only. They provide one firm’s insight on the markets. Not investment advice. See additional disclaimer here.
Note: Posts on this site are for education purposes only. They provide one firm’s insight on the markets. Not investment advice. See additional disclaimer here.
The day the SOXX, closed higher but failed to print a new high.
It’s now early in the session (9:55 a.m., EST) and we have a new daily low.
There have been sell signals before but this one has a different ‘feel’ (not advice, not a recommendation).
Yesterday, bonds (TLT) gapped open lower and broke below support; rates are rising … again.
The 1987 Set-Up
Those old enough, remember the set-up. Rates up (bonds down) and market rising to all-time highs at the same time.
A chart of the ’87 crash is here. Note, the high was in August, that year.
Now, a video from Robert Prechter, about the current historic extremes.
‘Not since the South Sea Bubble of the 1700s’
Couple all of that with bonds (TLT) breaking down and we could have that ‘inflection point’, saying we’ve reached the top (not advice, not a recommendation).
The Mania Goes ‘Manic’
Going back to this post, it said to expect the AI proaganda to increase as we reach the top and reverse down.
If yesterday was that day, then we’ve got more articles coming about the downside being a ‘buying opportunity’.
It’s been the same throughout history
From a positioning standpoint and Wyckoff analysis perspective, under such conditions, one is to pick the weakest market to short and not the strongest (not advice, not a recommendation).
Junior Gold Miners, GDXJ, Bear Market
The last update showed how positions can be de-risked.
There’s always uncertainty but working long enough in the markets and eventually an understanding is formed on how the game is played.
Fake, fabricated or ‘serendipitous’ news articles getting the public on the wrong side, are just part of the game.
In the early session, the GDXJ, is continuing its move lower.
Note: Posts on this site are for education purposes only. They provide one firm’s insight on the markets. Not investment advice. See additional disclaimer here.
‘Some of the best market traders are former Marines.’, Prechter
That’s a paraphrased quote from Robert Prechter Jr., given during an interview in the early 1990s.
The inference: Marines succeed at trading because they have been conditioned to endure and perform while being in pain … physical and mental.
On the other hand, the financial press, being ever so helpful during this unprecedented collapse, is all too happy to help analyze the situation by catastrophizing on how ‘painful’ the market feels.
If we go to Jerimiah Babe at time stamp 1:36, the mainstream press is still touting ‘The consumer is strong’.
In other videos, Babe, has shown how devastated the real estate market really is … ‘boots on the ground’ reports at vacant malls, empty parking lots and new (unoccupied) housing developments that stretch for miles.
With that backdrop, let’s look at what the price action of real estate is telling us … is the consumer strong?
Real Estate IYR, Weekly
There are so many things happening in IYR, it will probably take several updates.
At this point, price action exhibits the following:
Currently in Wyckoff ‘Up-Thrust’ condition, potential reversal
On a close basis, IYR has retraced 38.2% of its entire move.
Repeating trend line(s) underside test.
Trading channel that’s a Fibonacci 34 (-1) weeks wide.
For the week just ended, Force Index is divergent (54.7%, weaker) than the last push higher.
We’ll look at the first three of those, below.
As the market came to a close on Friday, price action pushed through established resistance (and axis line) to end the week higher.
Price action’s in Up-Thrust condition, The Danger Point®
Next, we have on a close basis, a Fibonacci 38.2% retrace as well as testing the underside of a resistance/trend-line.
In the next update, we’ll discuss the possible trading channel and the pressures (Force Index) behind the last move higher.
There Will Be Great ‘Wringing Of Hands’
As always, anything can happen in the markets. The above is not advice or a recommendation.
Next week, we can expect the Usual Suspects to come out and provide their ‘expert analysis’ on what the Fed is likely to do or not.
The Fed on the other hand, has repeatedly said what’s it’s going to do; that is, raise rates.
Interest rate sensitive real estate already appears ready for reversal.
Note: Posts on this site are for education purposes only. They provide one firm’s insight on the markets. Not investment advice. See additional disclaimer here.
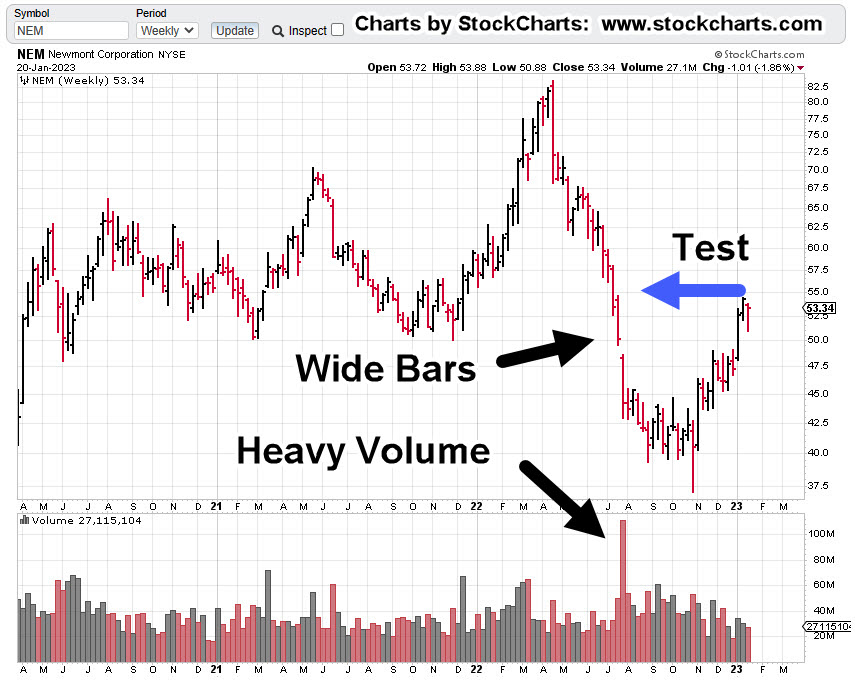
Nemont Mining (NEM), Gold, and the Oil & Gas Sector are at a critical juncture.
The rest of the major indices, Dow, S&P, QQQs, real estate (IYR), and so on, are in a similar position.
For this update, we’ll focus on Newmont (NEM), as it’s the largest cap in the Senior Mining Sector GDX, and a general representative of the commodities markets.
Financial collapse is a process, not an event.
Newmont topped-out in April, of last year. Exxon, the proxy for the Oil & Gas sector, may have reached its highs this past November.
Where’s The Inflation?
As Michael Cowan has just reported, banks are absconding with depositor’s money under the guise of ‘bail-in’.
If the fiat cash is so worthless, why are banks seizing it?
As Robert Prechter Jr., said years ago, ‘all fiat cash ultimately goes to zero’; the end game (most likely) for the dollar. However, it could be months, years, or even a decade before that happens.
For right now, today, this minute, the data is showing us, the banks want the money; ‘Show me the money‘.
With that, let’s look at the non-existent ‘inflation’ in the mining sector.
Newmont Mining NEM, Weekly
The first chart identifies the heavy volume and then test of wide price bars. This behavior is common in the markets; they tend to come back and test wide high-volume areas.
Next, we see there’s a terminating wedge developing as volume declines; the inference, is lack of significant commitment at these price levels.
We’ll get close-in on the wedge; last week printed a lower weekly low and closed lower for the week.
There’s no breakdown of the wedge … yet.
At this juncture, it’s up to the bulls to show they’re still in control.
Inflation vs. Scarcity
We have without a doubt, the effects of the event from the past three years gaining momentum. Whether or not those effects reach a peak this year, is unknown.
A lot of the mainstream and YouTuber’s alike talk about the upward move in gold as the result of ‘inflation’.
Here’s a little bit of insight you’ll not find anywhere else; how about gold rising because the above mentioned ‘effects‘ are causing production volumes to decline?
Maybe it’s because of scarcity (along with nearly everything else) that’s causing the increase in price.
Just to drive that idea home, the latest total gold production numbers, listed here.
Gold production for 2020 dropped -8.2%, from the year prior. Year 2021 was down -1%, from 2020.
From 2010 to 1019, gold production increased or was flat year over year … that is, until 2020.
Note: Posts on this site are for education purposes only. They provide one firm’s insight on the markets. Not investment advice. See additional disclaimer here.
Note: Posts on this site are for education purposes only. They provide one firm’s insight on the markets. Not investment advice. See additional disclaimer here.
As with the Carvana analysis, a year ago which said CVNA, would likely not survive, so too it would appear, biotech is about to join the ranks.
Join the ranks but for different reasons.
Price action leading the news was a concept presented decades ago by Robert Prechter Jr., as part of his Elliott Wave Theory.
His view was the market indicates ‘social mood’; in that case, the market must go down first, before the bad news comes out.
In effect, the public has to be ready and actually want bad news and/or be ready for unexpected, cataclysmic events.
It’s the complete opposite of the accepted mantra, from financial advisors and media alike.
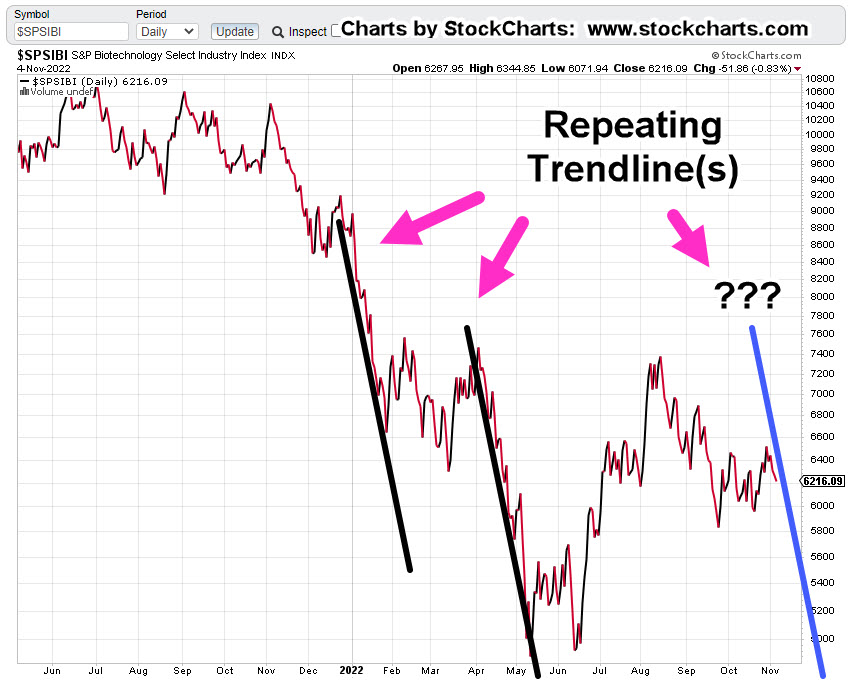
The bear flag in biotech SPBIO, has been forming now for three months. In the history of this sector, there’s never been anything like it.
The last update said there’s been a change in the character of price action; that SPBIO, is heading lower and about to threaten the bottom of the flag.
As we’ll see from the daily chart, indeed we’re getting close.
At this point, there’s no apparent demand for the upside.
Biotech SPBIO, Daily
The change in character is clear. We’re pulling away from the top of the flag and now, hovering at the lows.
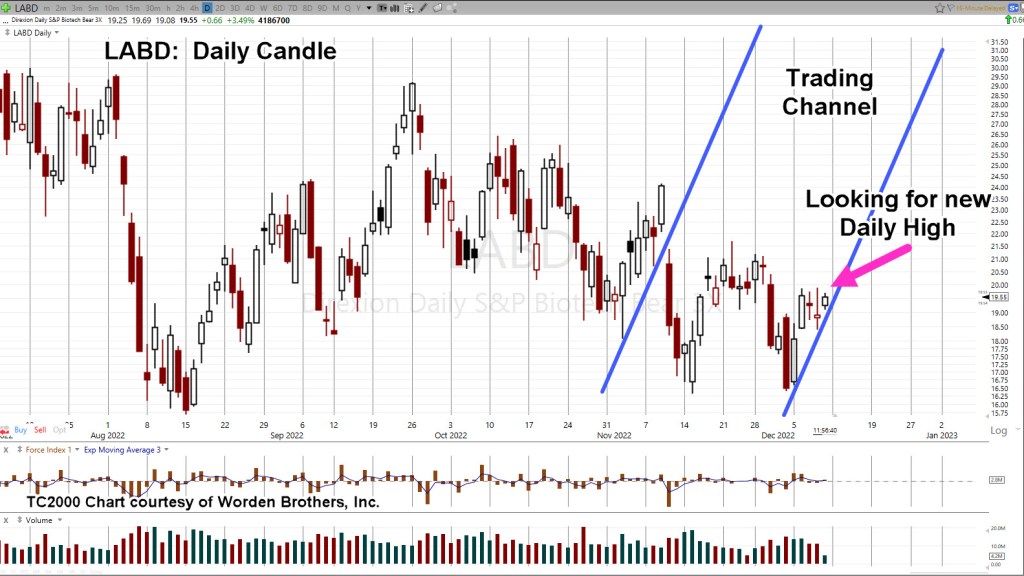
Switching gears and going to the 3X leveraged inverse fund LABD, on the daily basis, we see repeating trend lines.
SPBIO, 3X Leveraged Inverse LABD, Daily
As the magenta arrow shows, we’re looking for a new daily high in LABD, to confirm the trendline; that high would naturally correspond to a new daily low in SPBIO.
As of this post (1:02 p.m., EST) neither one has occurred.
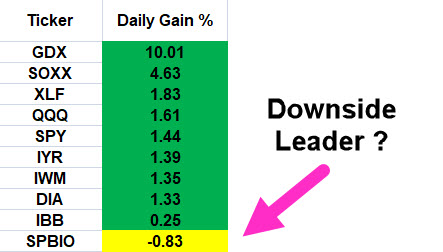
Summary
Even as the overall markets are mixed to slightly higher, SPBIO, is posting down – 1.51%; a possible indication it may lead to the downside.
Just exactly what ‘news’ is about to come out is unknown.
However, at this juncture with action pressing lower, it appears, the market is ready.
Positioning
Not advice, not a recommendation.
LABD-22-14
Entry@ 18.905, 18.95*** Stop @ 18.36***
Note: Positions may be increased, decreased, entered, or exited at any time.
Note: Posts on this site are for education purposes only. They provide one firm’s insight on the markets. Not investment advice. See additional disclaimer here.
There’re a lot of moving parts to biotech and it’s like a game of chicken.
Is there going to be another ‘planned’ event pulled out of the bag that requires ‘protection’ or will this side (and this one) win-out before that happens?
Price action’s always the final arbiter and right now, it’s positing lower.
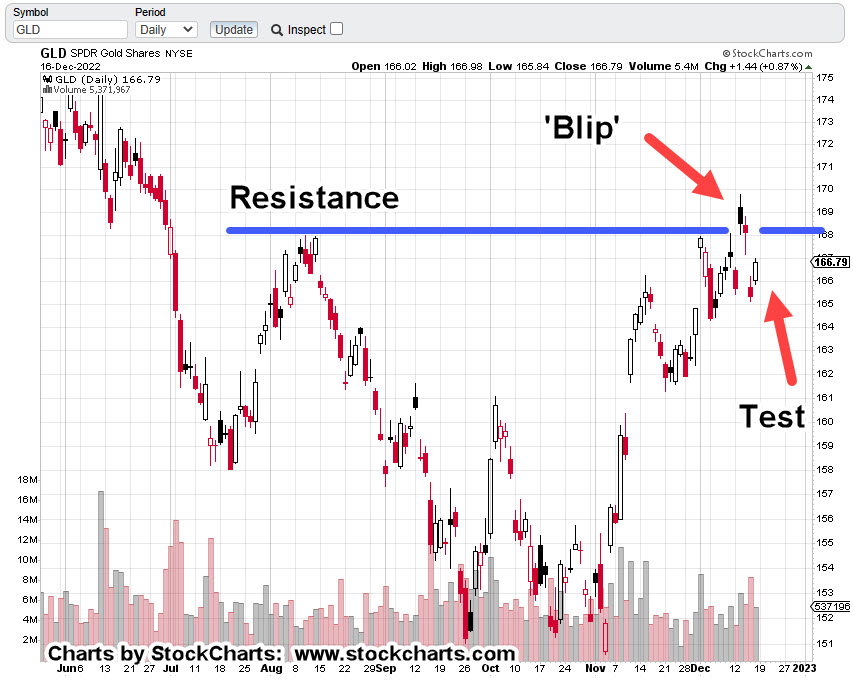
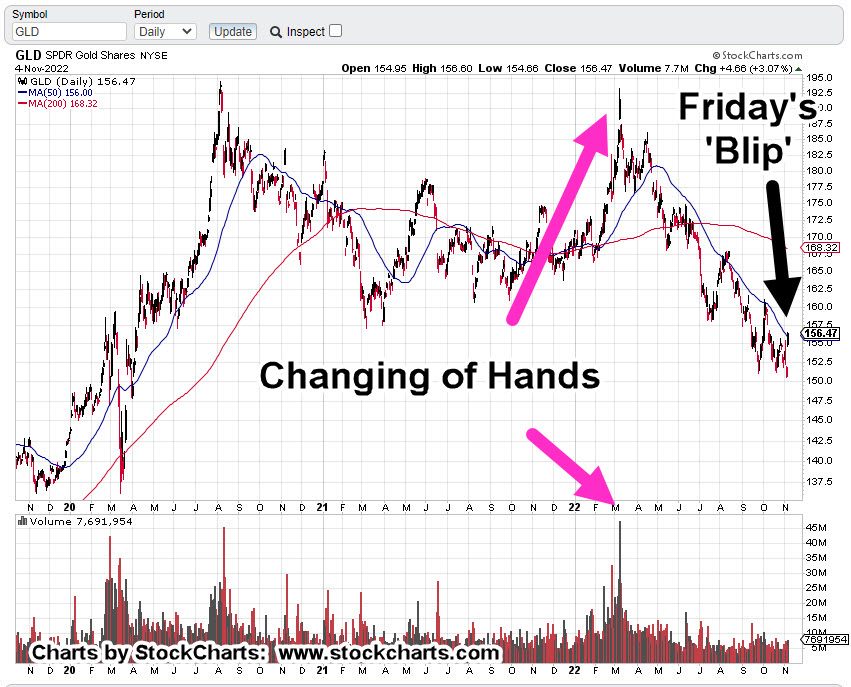
Gold:
Gold (GLD) ‘blipped’ higher on Friday and the usual suspects are out touting the hyperinflation narrative.
Owning (some) precious metals seems to be a good thing.
However, the public constantly knee-jerks into this sector and is absolutely rabid in their behavior (i.e., silver stockpiles are running out!!!).
It suggests at least, there’s something else afoot.
Prechter published in the early 2000’s, Central Banks, are followers, not leaders. The fact they are buying gold at this point, may be a contrary indicator.
Talk about going against the herd. 🙂
Over and again, it’s the boring (does not generate ‘clicks’) food supply first, then gold and silver (not advice, not a recommendation).
Real Estate:
What can be said?
It’s the largest manufactured bubble in world history and it has already popped.
Thinking it’s all going to sort itself out in a year or two is delusional. We’ve probably got decades of bear market.
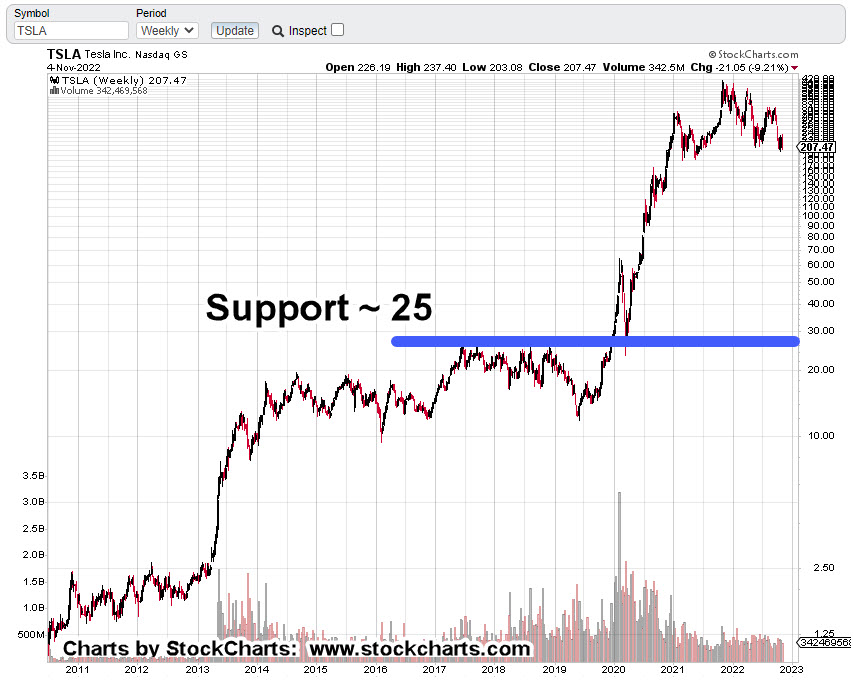
Tesla:
Anyone with an anode of research capability, knows the whole EV premise, is based on a falsehood.
However, that fact is probably not what’s going to bring Tesla (and the rest of the market) down.
Let’s stop for a moment and consider the above link which has been available for nearly four-years.
How many views? Just 9,824 (as of this post)
That equates to only 0.003% of the U.S. population.
As the global supply chains implode, getting parts and having stable infrastructure (i.e., electricity) will probably be the defining factor.
Now, on to the charts.
Biotech SPBIO, Daily Close
The following sessions will let us know if we’re at the right edge of the downtrend line.
We’ve already had an up-thrust reversal and a test of that reversal. last Friday was lower … probabilities point down.
Gold GLD, Daily
Looking at the chart on the strategic, longer term, Friday’s blip is hardly noticeable. We’ve already presented how this could be a minor up-thrust (reversal) in itself.
To keep the upside intact, price action must remain and continue above current levels.
Real Estate IYR, Daily
Real estate may be working its way into an up-thrust condition. As shown, Fibonacci Day 21 from the October 13th, low is this coming Thursday, the 10th.
According to the Economic Calendar there are several potential catalysts that may push the price above resistance (temporarily).
Note: Posts on this site are for education purposes only. They provide one firm’s insight on the markets. Not investment advice. See additional disclaimer here.