Non-Confirmation

First off, before we get started, there’s this on ZeroHedge; Gold price out of control?
The short answer is ‘probably not’ and we’ll use the confirmation proxy Silver (SLV), as our example (not advice, not a recommendation).
The Silver Non-Confirmation
In a traditional ‘inflation’ scenario, silver and gold typically move in tandem.
We can see that’s the case during the last (major) inflation event back in the late ’70s and early ’80s.
Gold spiked right along with silver; Gold chart link here. Silver chart link here.
That Was Then
What we have now, is different. Something’s wrong.
Silver’s not confirming the price rise of gold; Silver vs. Gold, link here.
There’s a massive divergence between the two.
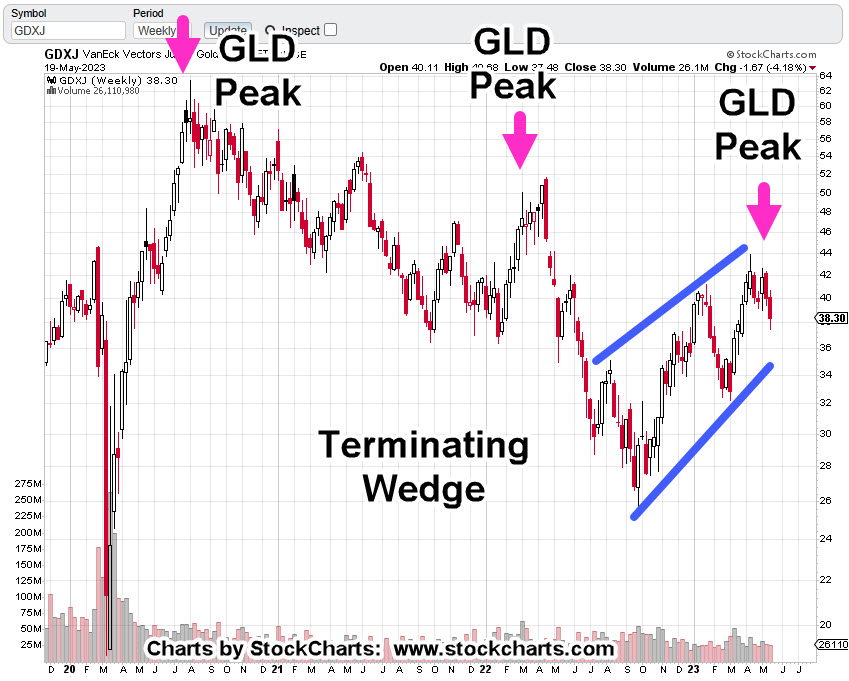
Silver (SLV) Weekly Close
The SLV weekly, shows we’ve broken down from a wedge, now testing the underside of resistance.

Silver more than gold, is tied directly to the economy; over half of all silver is used in production.
It seems, production is about to fall off a cliff.
Evidence can be seen in a corollary indicator, layoffs.
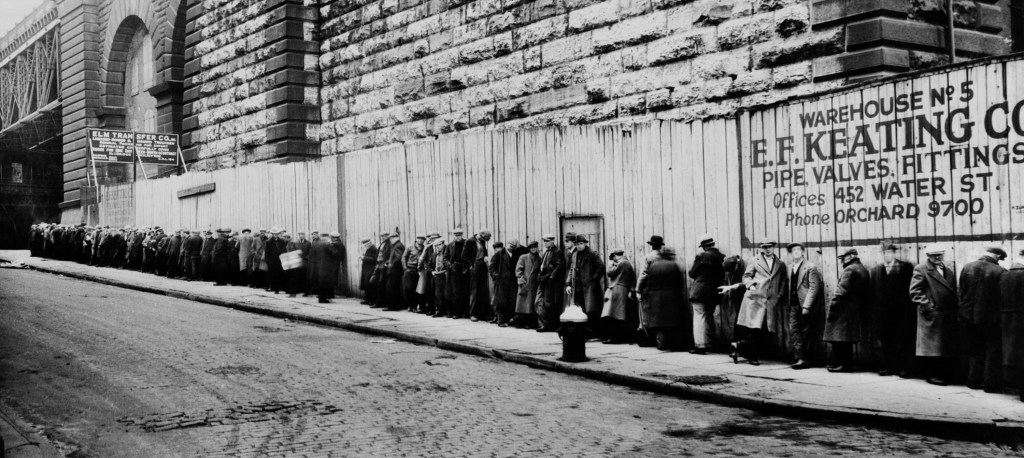
Mass Layoffs
As Michael Cowan shows (time stamp 1:30), layoffs are accelerating.
Let’s not forget, ShadowStats shows its own unemployment indicator, already at Depression Era levels.
Positioning
On this site, beginning in mid-September, short positions (via LABD) were opened in possibly, the weakest sector, biotech, SPBIO, $SPSIBI (not advice, not a recommendation).
The initial position was stopped out (gain around +21%), then re-established the same day (LABD-23-11) with an LABD entry of 21.69.
So far, with today’s action, LABD’s trading around 23.90; approximately + 10% from the entry.
In addition, we now have a new Hard Stop @ LABD 21.65, yesterday’s low (not advice, not a recommendation)
Chart updates are planned for the next post.
Stay Tuned
Charts by StockCharts
Note: Posts on this site are for education purposes only. They provide one firm’s insight on the markets. Not investment advice. See additional disclaimer here.
The Danger Point®, trade mark: No. 6,505,279