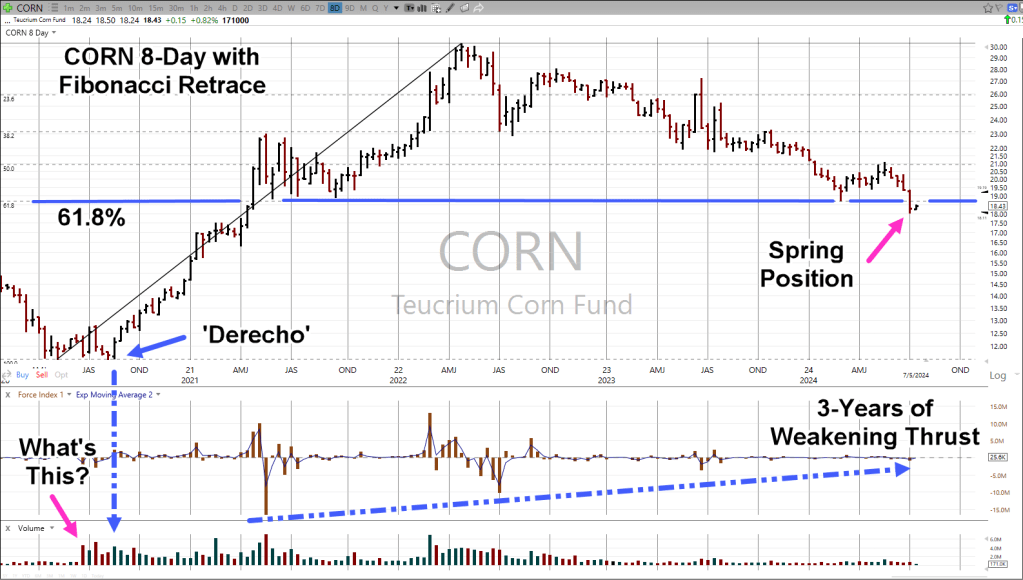
Penetrating and holding just below support, we know what that means.
CORN is at The Danger Point®, in spring position (not advice, not a recommendation).
The chart below covers over four-years of price action; within that, we have at least three technical items to cover.
Somebody Always ‘Knows’
First, how does volume in CORN, go from basically nothing, to increasing over 400%, six weeks before, the perfectly timed and positioned (in the corn belt), ‘Derecho‘.
That location is identified as ‘What’s This?’
As Wyckoff said a century ago: ‘Somebody always knows something and that ‘something’ shows up on the tape’.
CORN Fibonacci, 8-Day
Second, is the successive decrease in downward thrust over the past three-years; at this point, nobody’s watching.
All of that brings us to the third technical point.
CORN has retraced to support (blue line) which just happens to be a Fibonacci 61.8%, level; penetrates that support and so far, has stopped dead.
Note: Posts on this site are for education purposes only. They provide one firm’s insight on the markets. Not investment advice. See additional disclaimer here.
Since Wyckoff analysis doesn’t care about the press, we’ll use it to discern the (potential) truth.
Let’s see how it did in the recent past. The Nat-Gas (UNG) low, was identified to-the-day,link here.
From that post, was this:
“Downward thrust in Nat-Gas UNG, appears to be exhausting itself after a 20-month, bear market.Risk is never zero, but currently appears to be at a low … “
So, it was. Afterwards, UNG bounced near, but never touched that low.
Twelve trading days later (Fibonacci 13 days, from low), it reversed decisively to the upside.
The Same, But Not
On the medium, to long-term, CORN action is the same as biotech (XBI), but opposite.
Instead of an up-thrust two-years in the making, we may have a spring set-up, taking just as long if not longer.
Note: Posts on this site are for education purposes only. They provide one firm’s insight on the markets. Not investment advice. See additional disclaimer here.
“What we’re looking for here, is some kind of Jimmy Carter type stunt where corn exports are halted in the name of ‘national security’ or some such thing.”
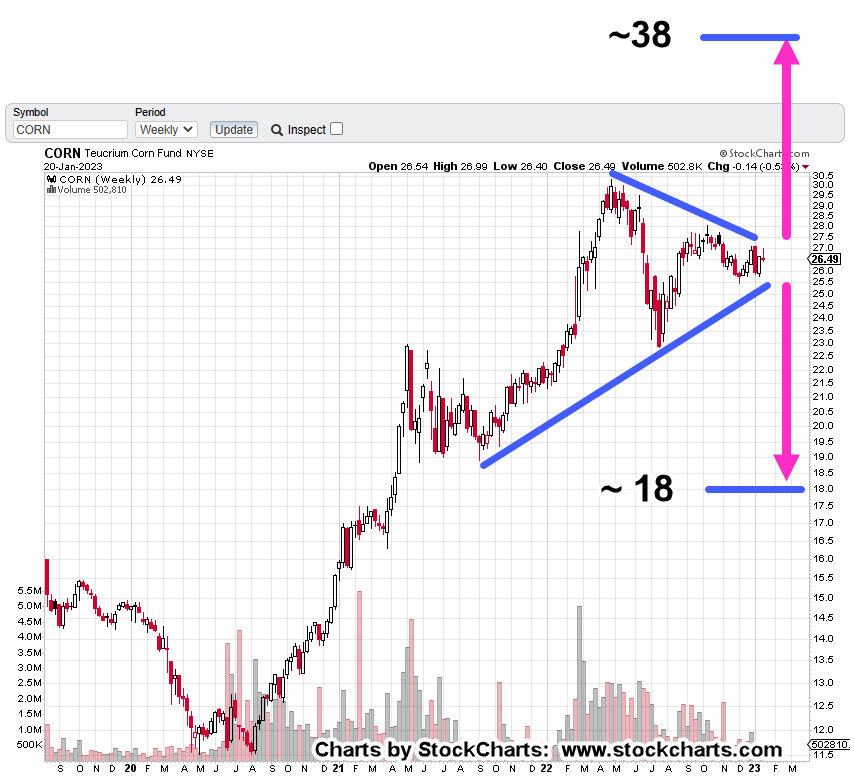
Corn Tracking Fund CORN, Weekly
Two Fibonacci projections are overlaid on the chart.
First, a simple retrace starting near ‘Derecho’ lows, to highs set during the week of April 29th, 2022.
Second, a counter-trend projection from those highs to the intermediate lows set during week of May 19th, 2023 and highs of June 23rd, week, the same year.
CORN has retraced 61.8%, which is also the 1:1 counter-trend projection. In addition, it’s the measured move from the wedge break.
The market has effectively confirmed the support area.
Oil Goes Negative … And Corn?
Remember that ‘anything can happen’. Oil futures made history by going negative.
We’re in a new construct, a new paradigm, our strategy should match accordingly.
Everyone has their own perspective and plan for the markets; fair enough.
From here, CORN could continue to new, all-time highs.
However, for my accounts, I’ll wait until such time it appears the downside risk is removed as much as possible.
One potential area for that ‘removal’ is the 76.4%, retrace in the vicinity of CORN @ 16 (not advice, not a recommendation).
Note: Posts on this site are for education purposes only. They provide one firm’s insight on the markets. Not investment advice. See additional disclaimer here.
In our example above, the commentor said their family survived in part, because they had “100kg of salt”.
That amount equates to about 220 lbs.
Converting 1oz gold for (roughly) 18-oz. salt, at today’s gold prices, is about $392,000 ‘worth’ of salt.
When they came out other side, the salt may have been gone, but they had the gold. 🙂
Now, moving on to the chart.
Gold (GLD), Weekly
Gold is at a critical juncture.
We’re either in a potential ‘throw-over’ on the wedge formation (with reversal) or about to pressure higher into all-time highs (not advice, not a recommendation).
We see a rising (terminating) wedge, along with a decline in volume (thrust).
We’re at The Danger Point®
Gold’s price action does not need much of a push to go either way.
Then, The Dollar
Recall, from the dollar update (link here), there’s a possibility for it to decline from current levels; potentially setting up a Wyckoff spring condition.
A dollar decline would naturally provide a likely correlation for gold rising into new all-time highs.
If either one happens, there’s probably going to be panic.
Note: Posts on this site are for education purposes only. They provide one firm’s insight on the markets. Not investment advice. See additional disclaimer here.
In chess, most (if not all) opens and responses have a name:
‘Danish Gambit’
‘Cochrane Gambit’
‘Petrov Defense’
‘Scotch Game’
‘King’s Gambit’
It’s been nearly one year, since discussing a potential corn trading strategy; during that time, the strategy remains in effect (not advice, not a recommendation).
We’re still waiting for a chess move from the ‘other side’.
Keeping in concert with traditional opening moves as named above, we’re going to name our set-up as follows:
‘Potato Head Gambit’
That is, an ‘administrative’ move which temporally puts the corn futures market into chaos. A move similar to Carter’s grain embargo of the 1980s.
The weekly chart of tracking fund CORN, shows us something’s about to happen.
Either we get a breakout … or breakdown.
Teucrium Corn Fund, CORN, Weekly
The ‘Derecho‘ is marked as it was the kickoff to the current structure.
A wedge has formed.
A breakdown puts CORN, at a measured move in the vicinity of 18.0; a breakout to the upside, measures approximately to 38.0.
From a trading perspective, a breakdown is preferred.
Price action pushing lower to the 18-area, puts CORN below well established (support) lows of 2021.
A penetration of those lows would (potentially) put CORN in Wyckoff Spring Position.
Note: Posts on this site are for education purposes only. They provide one firm’s insight on the markets. Not investment advice. See additional disclaimer here.
There’re a lot of moving parts to biotech and it’s like a game of chicken.
Is there going to be another ‘planned’ event pulled out of the bag that requires ‘protection’ or will this side (and this one) win-out before that happens?
Price action’s always the final arbiter and right now, it’s positing lower.
Gold:
Gold (GLD) ‘blipped’ higher on Friday and the usual suspects are out touting the hyperinflation narrative.
Owning (some) precious metals seems to be a good thing.
However, the public constantly knee-jerks into this sector and is absolutely rabid in their behavior (i.e., silver stockpiles are running out!!!).
It suggests at least, there’s something else afoot.
Prechter published in the early 2000’s, Central Banks, are followers, not leaders. The fact they are buying gold at this point, may be a contrary indicator.
Talk about going against the herd. 🙂
Over and again, it’s the boring (does not generate ‘clicks’) food supply first, then gold and silver (not advice, not a recommendation).
Real Estate:
What can be said?
It’s the largest manufactured bubble in world history and it has already popped.
Thinking it’s all going to sort itself out in a year or two is delusional. We’ve probably got decades of bear market.
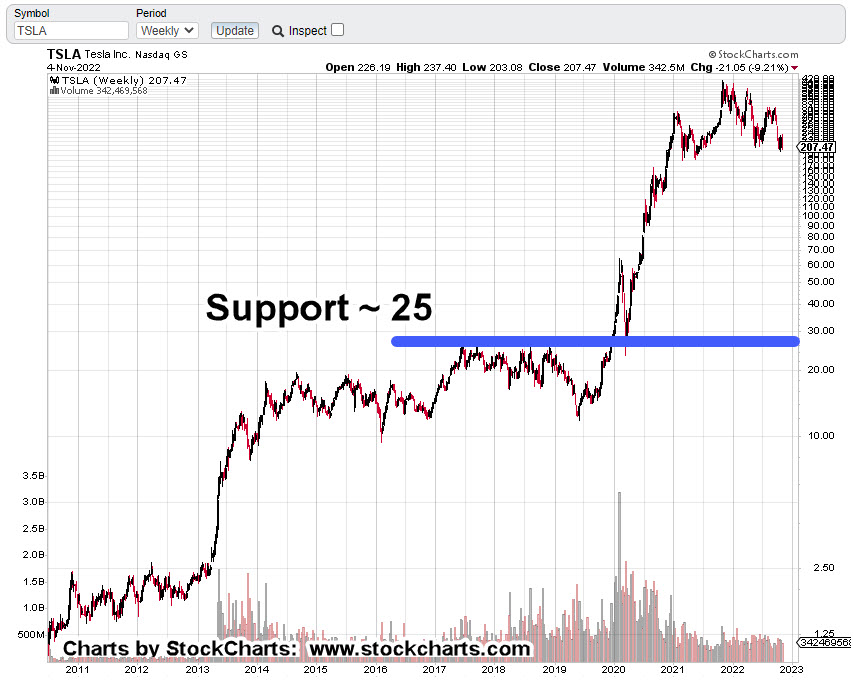
Tesla:
Anyone with an anode of research capability, knows the whole EV premise, is based on a falsehood.
However, that fact is probably not what’s going to bring Tesla (and the rest of the market) down.
Let’s stop for a moment and consider the above link which has been available for nearly four-years.
How many views? Just 9,824 (as of this post)
That equates to only 0.003% of the U.S. population.
As the global supply chains implode, getting parts and having stable infrastructure (i.e., electricity) will probably be the defining factor.
Now, on to the charts.
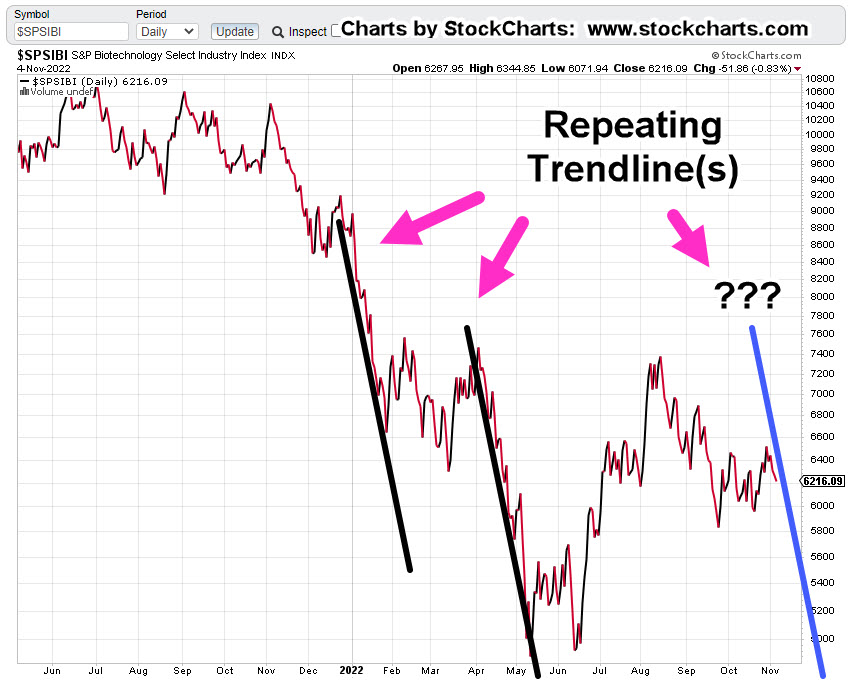
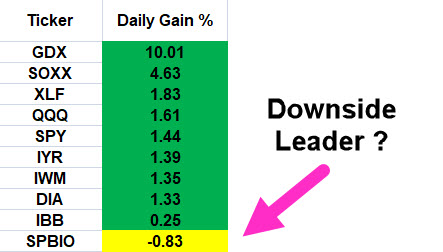
Biotech SPBIO, Daily Close
The following sessions will let us know if we’re at the right edge of the downtrend line.
We’ve already had an up-thrust reversal and a test of that reversal. last Friday was lower … probabilities point down.
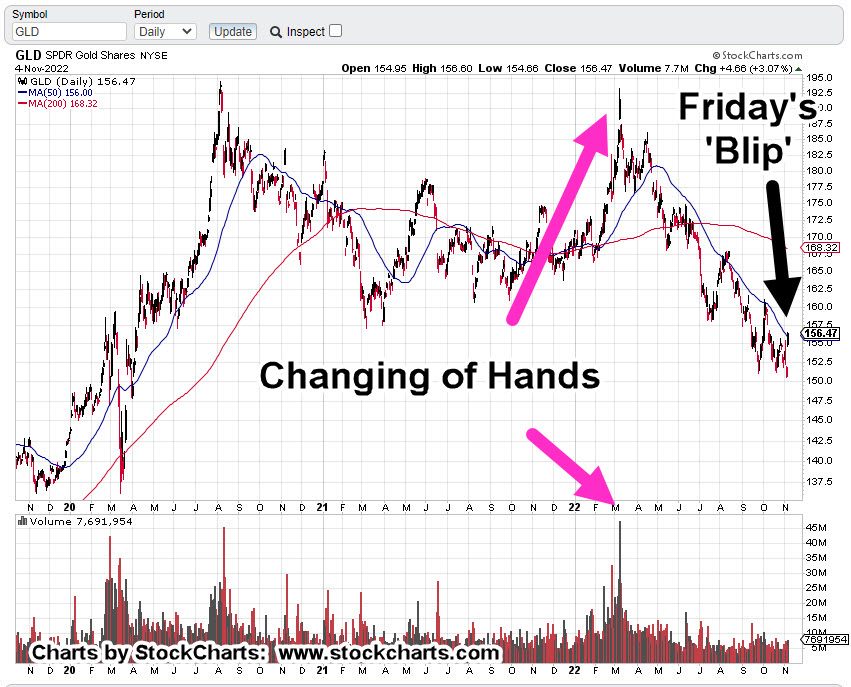
Gold GLD, Daily
Looking at the chart on the strategic, longer term, Friday’s blip is hardly noticeable. We’ve already presented how this could be a minor up-thrust (reversal) in itself.
To keep the upside intact, price action must remain and continue above current levels.
Real Estate IYR, Daily
Real estate may be working its way into an up-thrust condition. As shown, Fibonacci Day 21 from the October 13th, low is this coming Thursday, the 10th.
According to the Economic Calendar there are several potential catalysts that may push the price above resistance (temporarily).
Note: Posts on this site are for education purposes only. They provide one firm’s insight on the markets. Not investment advice. See additional disclaimer here.
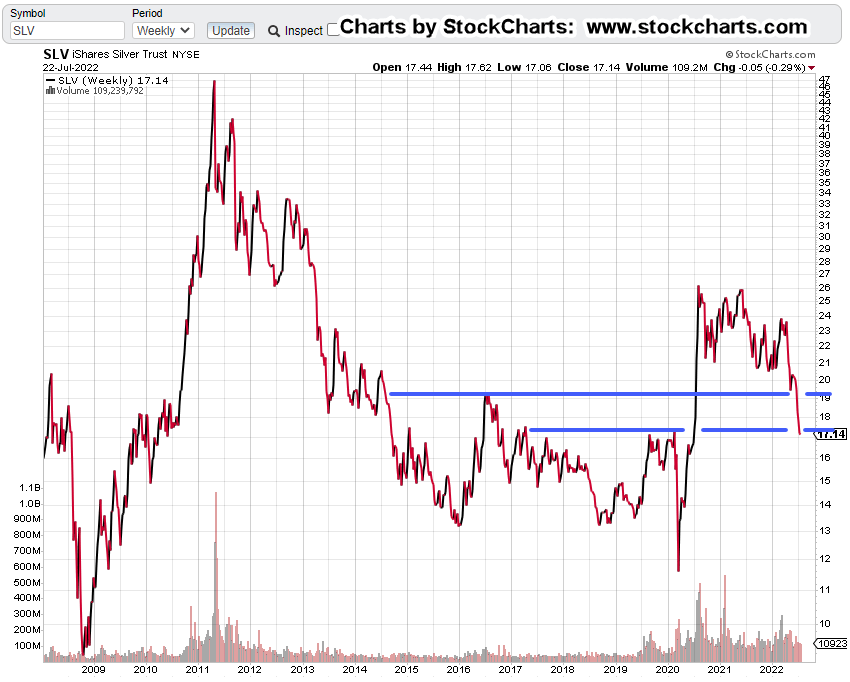
Media analysts and YouTubers alike, are scratching their collective coneheads.
They’re asking; why is silver down a whopping – 39%, from its print high of February 1st, this year?
If we factor in the high of SLV 48.35 (from April of 2011), silver’s been pummeled – 65%.
With the ‘rampant’ inflation and never-ending money printing, silver (along with gold) should, there’s that word ‘should’, be skyrocketing higher.
It’s an apparent mystery; steeped with smoke-filled back rooms and intrigue.
The ‘Inflation’ Narrative
Let’s help unravel silver’s decline by taking a look at some of the facts.
First up, is ‘inflation’.
The inflation narrative is false. There; glad we got that out of the way. 🙂
How do we know?
We know it’s false because the price action itself, tells us it’s false.
It’s obvious at this point, what we have is supply destruction and not inflation.
The Economic ‘Connection’
Next up, is the economy.
Silver along with copper are industrial metals. They follow the economy … more so with copper. Copper futures are down – 32.5%, from their March 7th, highs.
Coper’s industrial uses are linked here. Nearly half of copper production is for building and construction.
Since the largest real estate bubble in world history has just popped, copper demand is essentially going to collapse.
If at this early stage of Great Depression 2.0, the average person can’t pay the phone bill, where are they going to get any money to drive precious metals demand higher?
Moving on to ‘truth’, we have price action.
Silver SLV, Weekly Close
The chart below has SLV, penetrating one support level (upper blue line) and just now, at the next support.
Since gold (GLD) is in position for an upward test of its wedge breakdown (chart not shown), it’s reasonable to expect another bounce off support for silver.
Using the ‘rule of alternation’, we already had a brief move off the first support level before reversing.
The next contact at lower support, will likely bounce for longer or not at all.
If silver can’t go higher … look out below.
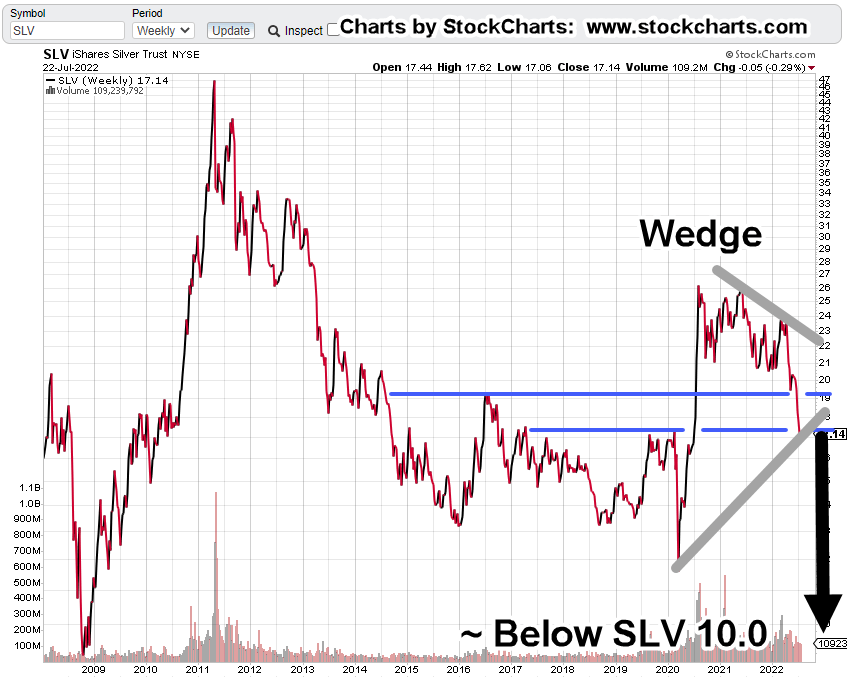
Silver SLV, To Single Digits?
The economic depression is just getting started and industrial metals demand is already collapsing.
Although a data point of one, the following is significant.
Supporting the ‘depression’ assessment is this link; specifically, time stamp 3:20, with a recent graph of housing listings in California … going vertical.
SLV, is in position to test higher; thus, confirming the wedge pattern (grey lines) shown below.
Added to that pattern is a measured move target should SLV, break down to lower levels after an upward test.
There it is: ‘Mystery’ solved.
Silver is heading lower because price action said it would.
Now, the fundamentals are kicking in to add a potential mass acceleration to the decline.
Note: Posts on this site are for education purposes only. They provide one firm’s insight on the markets. Not investment advice. See additional disclaimer here.
If you’re blowing whatever’s left of your money (or credit), it’s likely you have no real marketable (high pay) skills, no talent, lazy, obese; so, we’re off to Vegas.
Add to that, we’rejust at the start of the depression.
Patera, from Appalachia’s Homestead (time stamp 4:24) addresses the problem a little differently but her final assessment is the same.
It’s true, there are some barriers to learning a new skill.
Dan from i-Allegedly points out the high cost to get a CDL, to be a trucker.
However, those who are awake, those with their nose in the KJV Bible, those leaving the corrupt church (in droves), knew that current events were coming; they took action way before it became obvious.
Yet another indicator of the current strange weather (warfare) that’s going to strain the system.
Here’s the link to the very first post that specifically referenced Genesis 41; posted on December 31, 2020.
As with the ‘Mask on, Mask off (linked above), how has the post aged?
Is it still relevant?
What about this quote … seemed extreme at the time.
They paid for the corn first, with gold and silver. Then they paid with their livestock. Then they paid by selling themselves into life-long slavery. We can equate that last part (slavery) as getting the vax.
No. 5
Chess Board Strategy
It’s a bitter pill to realize we’re in the long game. ‘Normal’, is not coming back … ever.
That does not mean there’re no opportunities. There are.
Those opportunities (if we survive) are/will be potentially life changing for the good.
The Sunday futures market opened about two hours ago and we’re up around +0.40%, in the S&P.
Let’s see if that spills over to the Monday open; remembering that we’re short the real estate sector with the finger on the sell trigger (not advice, not a recommendation).
Note: Posts on this site are for education purposes only. They provide one firm’s insight on the markets. Not investment advice. See additional disclaimer here.
There were so many comments on the ZeroHedge article (linked here) about the musings of a 78-year-old money manager (effectively saying he’s an idiot … a dolt), we’re going to use those comments for reference on a go-forward basis.
Everybody has an opinion but nobody’s actually looking at what the market is saying about itself.
That’s where the answers will be found … no matter one’s personal bias.
Looking at real estate IYR, we see that price attempted to get above the axis line shown but did not make it.
Before we go further, a correction: The last post said the stop on DRV-22-02 was located at DRV 32.71.
The stop is actually located at DRV 37.21. Numbers got swapped.
Real Estate IYR, Daily
It’s interesting to note, ProLogis (PLD), the largest cap in the sector did not close higher for the session.
If IYR, with other indices do not have a decisive follow-through (stopping out DRV-22-02, in the process) at tomorrow’s session, the Ponzi scheme’s in serious trouble.
As already stated, events may happen faster than anyone expects.
Summary
We’ll leave off with this just out from ice-age-farmer; linked here.
The collapse of the entire food supply has been building (sorry, in the planning stages) for years.
It’s intentional.
Does anyone think that ‘raising rates into weakness’ is not also intentional?
Note: Posts on this site are for education purposes only. They provide one firm’s insight on the markets. Not investment advice. See additional disclaimer here.
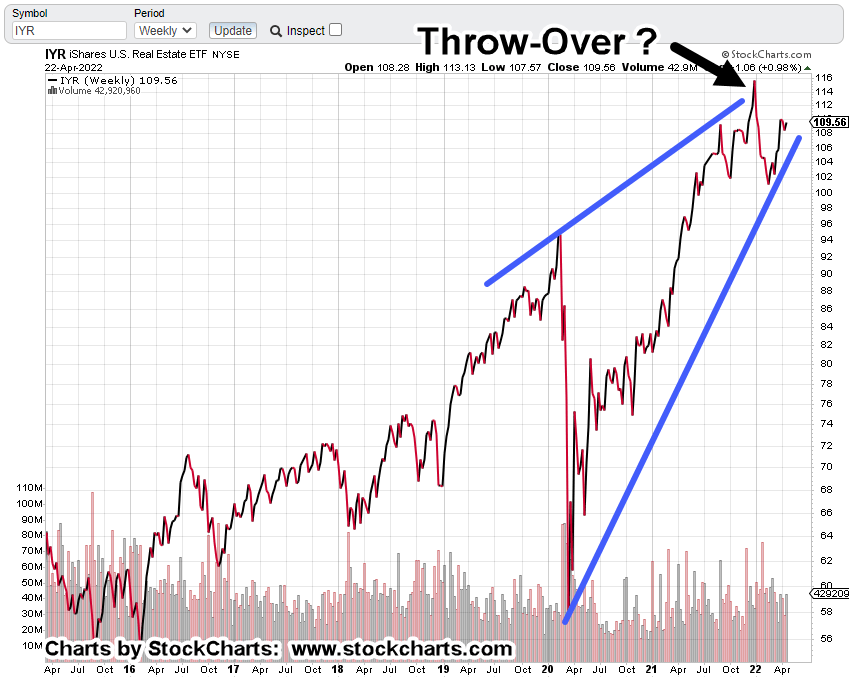
The previous bearish analysis was overwhelmed by the larger, upward trend.
Instead of continuing lower, real estate IYR, moved higher. It’s now at another inflection point.
The position in DRV (DRV-22-01) was exited at 32.66, when it was obvious the trade was going to fail.
Taking a hit like that gets one’s attention; there must be something else going on … something on a larger timeframe.
There’s nothing wrong, with being wrong.
However, there is something wrong with being wrong and staying wrong.
If we pull farther out to the longer, weekly timeframe, it looks like there’s danger ahead; possible new all-time highs and Wyckoff upthrust (potential reversal).
Real Estate IYR, Weekly
As with the Junior Miners, GDXJ, it looks like we have yet another Fibonacci time correlation.
During the financial crisis, IYR, posted its low the week of March 6th, 2009.
Thirteen years later, another major inflection point?
Shown below, is a terminating wedge that may have already completed a throw-over.
One probability suggesting new highs instead of a reversal at this point (which seems like even odds) is the repeating tendency of markets to go from ‘spring to up–thrust‘.
This site has presented over and again, it’s a common market behavior.
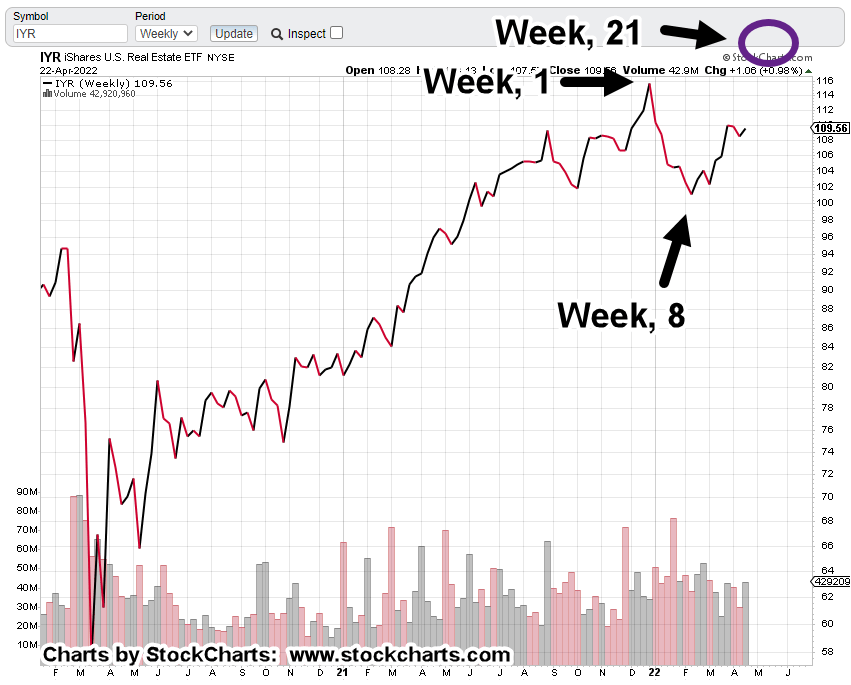
Getting closer-in on the weekly, the spring set-up is identified.
Now, comes the Fibonacci time correlation.
From the all-time highs, the market closed at the lows on Week 8. The print low came one week later.
Using that information and projecting forward, if this correlation is in effect, if it’s valid, we can expect an up-thrust high somewhere during the week of May 20th, to May 27th.
Note: Posts on this site are for education purposes only. They provide one firm’s insight on the markets. Not investment advice. See additional disclaimer here.