How long have we heard incessant rants, gold and silver hyper-launch is imminent?
Sure, I like gold as much as the next guy. It feels good when you hear the ‘clink’ of real money in your hands.
However, one has to remain unbiased and look at what price action, the market is actually telling us.
Strategy First
Since December 2020, this site has proposed, we’re in a situation similar to Genesis 41; it’s the food supply first, then gold and silver (not advice, not a recommendation).
In this post (two years ago), an observation, ‘stackers’ may be forced to liquidate just to survive.
Now, we have this and this. On that second link, the comments tell the real story:
‘… people are selling their silver because they need cash.’
With that, let’s look at the chart of gold, GLD.
Gold GLD, Weekly Bar
We’ve seen it before, the set-up, The Danger Point®
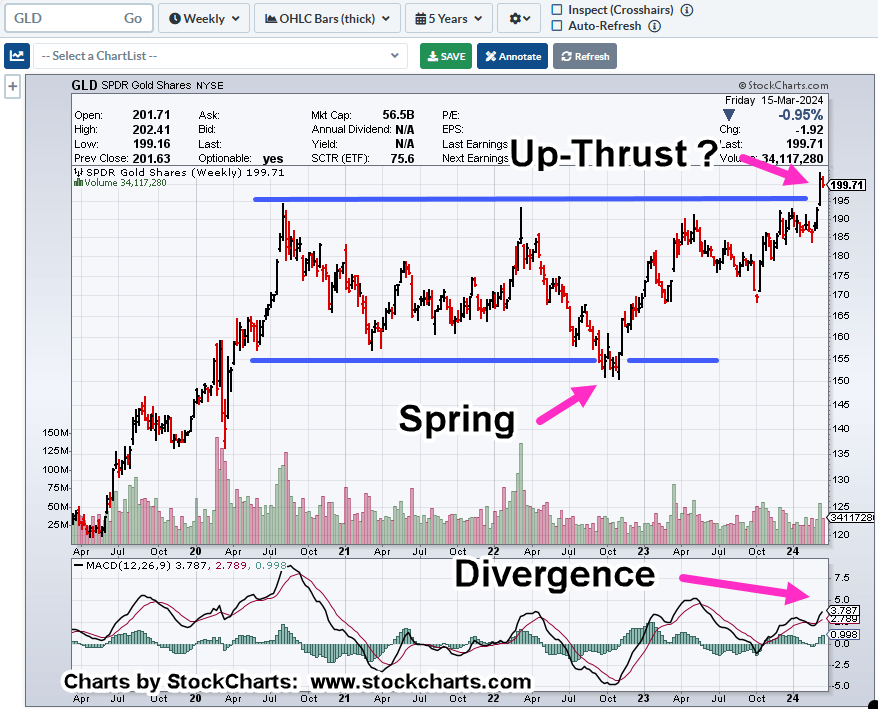
Let’s add some insight to this picture, hidden in the chart; we have the following:
Look at how much time it’s taken GLD, to go from the bottom of the range to the top; longer each time and with less energy, shown by the decline in (upside) volume.
Longer & Less
Takes longer and less energy.
Still, that does not guarantee anything. Gold cold just keep on grinding higher.
However, probabilities suggest (the chart itself) we may be at or near, a pivot to the downside (not advice, not a recommendation).
Note: Posts on this site are for education purposes only. They provide one firm’s insight on the markets. Not investment advice. See additional disclaimer here.
Not in any particular order; not advice and not a recommendation.
No 1. There (still) is no Fed Pivot. Seriously, have rates really, actually been lowered? Everyone has a huge case of ‘normalcy bias’. i.e., what the Fed did last time will happen this time.
The 40-year bond bull market from the 80’s, ended in 2020. We’re in a different paradigm now.
No. 2 Natual Gas UNG, is reversing. We’ll see whether or not there’s going to be a supply disruption.
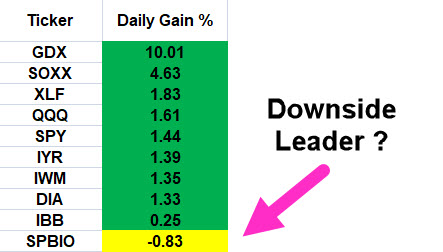
No. 3 The semiconductors SOXX, now have a monthly bearish MACD divergence; daily and the weekly indicators posting even to prior tops (as of Friday’s close).
No. 4 Components of biotech index XBI, are being shuffled around faster than deck chairs on the Titanic … or, the Olympic 🙂
Seems like a mad dash to add/remove, increase, reduce equities to prop things up. We’ll see how that turns out. Currently, XBI is right at resistance level, 86.50 – 87.0
Here’s just one example from an index, riddled with equities that have no P/E.
No. 5 Carvana is very close to posting new highs and potentially, running the stops.
No. 8 Gold, GLD, is currently not going higher (look at the divergences); silver (SLV) is in a major non-confirmation, down nearly – 55%, from all-time highs.
During the 1980s inflation, precious metals moved (upward) together.
Silver looks like it’s responding to the destruction/collapse of (economic) demand.
No. 9 American Tower (AMT), number two in the IYR index, posts a clear false breakout and reversal.
If rates really are going (materially) lower, interest rate sensitive real estate should continue going higher, right?
No. 10 Which brings us to the bond market, TLT.
Price action broke above established resistance, currently hovering above that level.
It’s at The Danger Point®
We can see the set-up, a price action pattern repeated time and again, between the lower and upper blue lines, called a ‘Spring-to-Up-Thrust.
While the media laughs at the bears, let’s just see how this all works out.
Note: Posts on this site are for education purposes only. They provide one firm’s insight on the markets. Not investment advice. See additional disclaimer here.
From a long-term strategy standpoint, this site has been consistent; it’s the food supply first, then gold and silver (not advice, not a recommendation).
The next shoe has yet to drop on how or what’s going to be used to extract (or confiscate) precious metals from the (stacking) proletariat.
So far, it’s been three-for-three (here, here and here) identifying recent significant technical conditions and turning points for gold, GLD.
At this juncture, the dollar collapse, and the silver/gold bull launch are just not happening. It’s not there … something else is going on (not advice, not a recommendation).
We’re in the middle of a massive sovereign bankruptcy (Time Stamp 7:10) that’s never happened before.
What’s going on behind the scenes is not visible to us.
However, from a Wyckoff analysis standpoint, those (hidden) actions and decisions show up on the chart(s).
Constantly giving press conferences discussing the strength of the military campaign when the exact opposite was true.
It may be so with gold as well (not advice, not a recommendation).
The local supermarket has decided, after a 22-year long bull market, it’s ‘safe’ for profit.
The hapless public is now standing at the gold kiosk; with face-mask firmly secured, arm bandaged from the latest booster, EV FOB in hand (or pocket), hypnotized into yet another mania.
Note: Posts on this site are for education purposes only. They provide one firm’s insight on the markets. Not investment advice. See additional disclaimer here.
If gold does not go higher, it’s because of ‘manipulation’, right?
The typical YouTube gold grifter acts like manipulation is a new discovery.
It’s the ‘go-to’ excuse when their forecasts don’t work out.
Way back in the early 1900s, Wyckoff discovered the market has always been manipulated.
His insight was, it’s up to the speculator to figure out the objective of the manipulation and then act accordingly (not advice, not a recommendation).
Livermore knew about manipulation and even engaged in it himself. He looked at things in a slightly different way; meaning, what is, not, what should.
A very key difference.
So, let’s look at what is happening with gold (GLD), and where it may head from here.
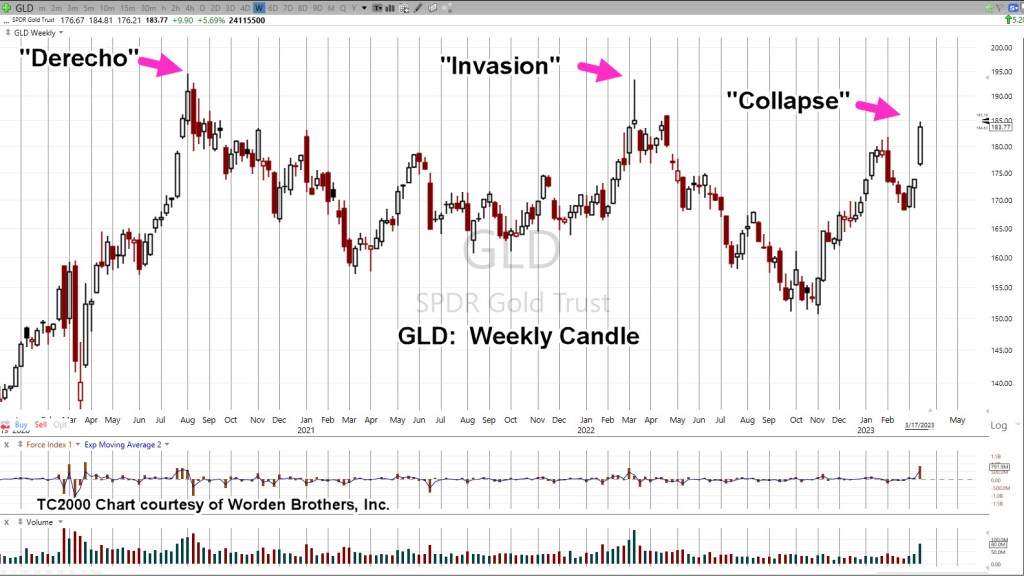
It took gold (GLD) several weeks to labor higher on ever shortened thrusts before finally exhausting itself and rolling over into a reversal … where we are now.
Is price action hesitating before heading higher or is this a significant downside move in the making?
It probably won’t be long before we have the answer.
Junior Mining Sector GDXJ, Weekly
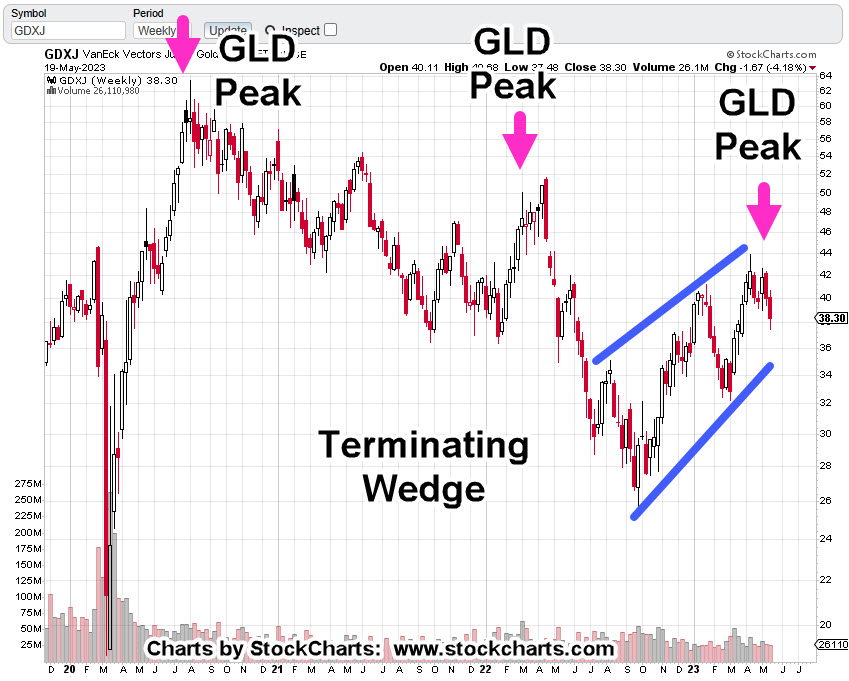
The gold mining indices GDX, and GDXJ, have already made their decision, reversing to the downside.
Note: Each reversal from a gold peak in the Junior Sector GDXJ below, is at significantly lower levels. This is not gold miner ‘bull market‘ behavior (not advice, not a recommendation).
It’s clear, the Junior Miners are in a bear market …
The GDXJ, is completing or has completed what is an obvious bear flag or terminating wedge.
Unless price action shows us differently, this is the current assessment; lower prices ahead (not advice, not a recommendation).
Fundamentals
From a fundamental standpoint, where’s the demand for inedible (possibly fake) metal going to come from? The consumer’s already tapped-out and borrowing money just to buy the weekly groceries.
Maybe something else is going on.
Something else that’s causing precious metals miners to anticipate another huge (economic) move lower.
Possibly completely unrelated (in a way) to the mining sector … maybe yet another ‘Speck’ event, shown at time stamp 3:40, at this link.
At the same link, time stamp 5:25, we’re back to the food supply … yet again.
“And all countries came into Egypt to Joseph for to buy corn; because that the famine was so sore in all lands.”
Note: Posts on this site are for education purposes only. They provide one firm’s insight on the markets. Not investment advice. See additional disclaimer here.
In our example above, the commentor said their family survived in part, because they had “100kg of salt”.
That amount equates to about 220 lbs.
Converting 1oz gold for (roughly) 18-oz. salt, at today’s gold prices, is about $392,000 ‘worth’ of salt.
When they came out other side, the salt may have been gone, but they had the gold. 🙂
Now, moving on to the chart.
Gold (GLD), Weekly
Gold is at a critical juncture.
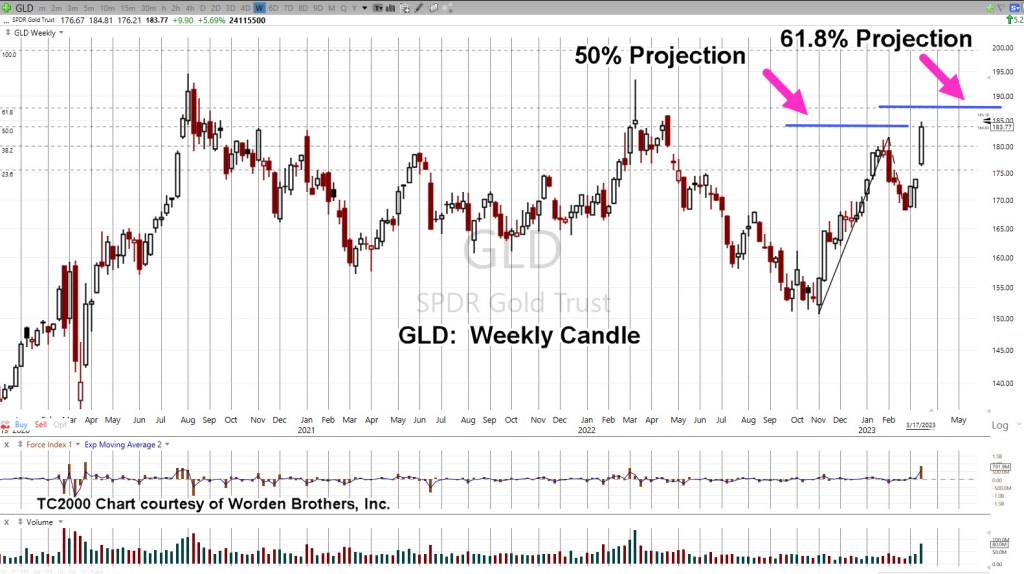
We’re either in a potential ‘throw-over’ on the wedge formation (with reversal) or about to pressure higher into all-time highs (not advice, not a recommendation).
We see a rising (terminating) wedge, along with a decline in volume (thrust).
We’re at The Danger Point®
Gold’s price action does not need much of a push to go either way.
Then, The Dollar
Recall, from the dollar update (link here), there’s a possibility for it to decline from current levels; potentially setting up a Wyckoff spring condition.
A dollar decline would naturally provide a likely correlation for gold rising into new all-time highs.
If either one happens, there’s probably going to be panic.
Note: Posts on this site are for education purposes only. They provide one firm’s insight on the markets. Not investment advice. See additional disclaimer here.
Note: Posts on this site are for education purposes only. They provide one firm’s insight on the markets. Not investment advice. See additional disclaimer here.
In chess, most (if not all) opens and responses have a name:
‘Danish Gambit’
‘Cochrane Gambit’
‘Petrov Defense’
‘Scotch Game’
‘King’s Gambit’
It’s been nearly one year, since discussing a potential corn trading strategy; during that time, the strategy remains in effect (not advice, not a recommendation).
We’re still waiting for a chess move from the ‘other side’.
Keeping in concert with traditional opening moves as named above, we’re going to name our set-up as follows:
‘Potato Head Gambit’
That is, an ‘administrative’ move which temporally puts the corn futures market into chaos. A move similar to Carter’s grain embargo of the 1980s.
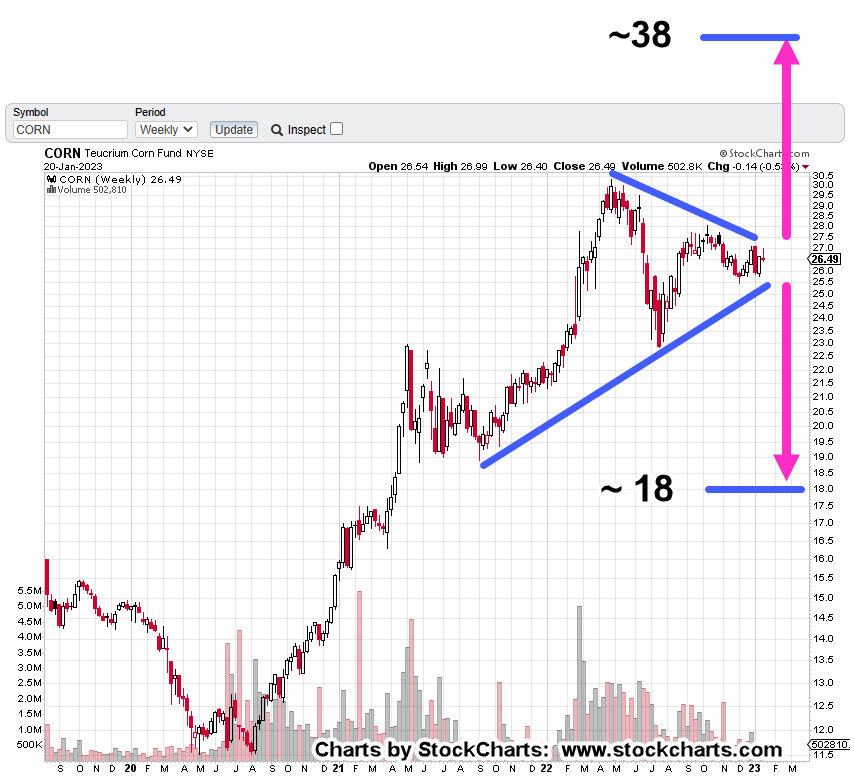
The weekly chart of tracking fund CORN, shows us something’s about to happen.
Either we get a breakout … or breakdown.
Teucrium Corn Fund, CORN, Weekly
The ‘Derecho‘ is marked as it was the kickoff to the current structure.
A wedge has formed.
A breakdown puts CORN, at a measured move in the vicinity of 18.0; a breakout to the upside, measures approximately to 38.0.
From a trading perspective, a breakdown is preferred.
Price action pushing lower to the 18-area, puts CORN below well established (support) lows of 2021.
A penetration of those lows would (potentially) put CORN in Wyckoff Spring Position.
Note: Posts on this site are for education purposes only. They provide one firm’s insight on the markets. Not investment advice. See additional disclaimer here.
There’re a lot of moving parts to biotech and it’s like a game of chicken.
Is there going to be another ‘planned’ event pulled out of the bag that requires ‘protection’ or will this side (and this one) win-out before that happens?
Price action’s always the final arbiter and right now, it’s positing lower.
Gold:
Gold (GLD) ‘blipped’ higher on Friday and the usual suspects are out touting the hyperinflation narrative.
Owning (some) precious metals seems to be a good thing.
However, the public constantly knee-jerks into this sector and is absolutely rabid in their behavior (i.e., silver stockpiles are running out!!!).
It suggests at least, there’s something else afoot.
Prechter published in the early 2000’s, Central Banks, are followers, not leaders. The fact they are buying gold at this point, may be a contrary indicator.
Talk about going against the herd. 🙂
Over and again, it’s the boring (does not generate ‘clicks’) food supply first, then gold and silver (not advice, not a recommendation).
Real Estate:
What can be said?
It’s the largest manufactured bubble in world history and it has already popped.
Thinking it’s all going to sort itself out in a year or two is delusional. We’ve probably got decades of bear market.
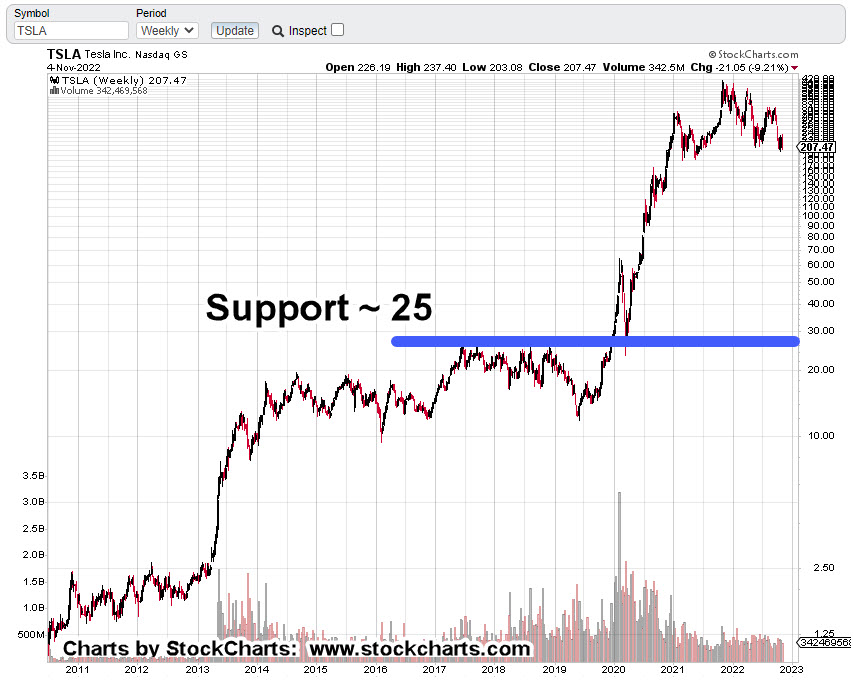
Tesla:
Anyone with an anode of research capability, knows the whole EV premise, is based on a falsehood.
However, that fact is probably not what’s going to bring Tesla (and the rest of the market) down.
Let’s stop for a moment and consider the above link which has been available for nearly four-years.
How many views? Just 9,824 (as of this post)
That equates to only 0.003% of the U.S. population.
As the global supply chains implode, getting parts and having stable infrastructure (i.e., electricity) will probably be the defining factor.
Now, on to the charts.
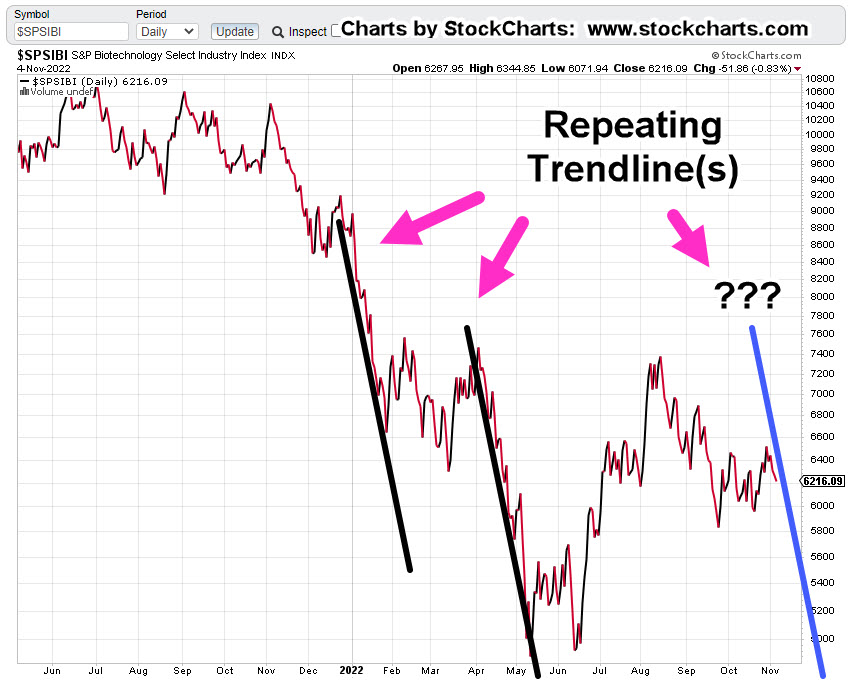
Biotech SPBIO, Daily Close
The following sessions will let us know if we’re at the right edge of the downtrend line.
We’ve already had an up-thrust reversal and a test of that reversal. last Friday was lower … probabilities point down.
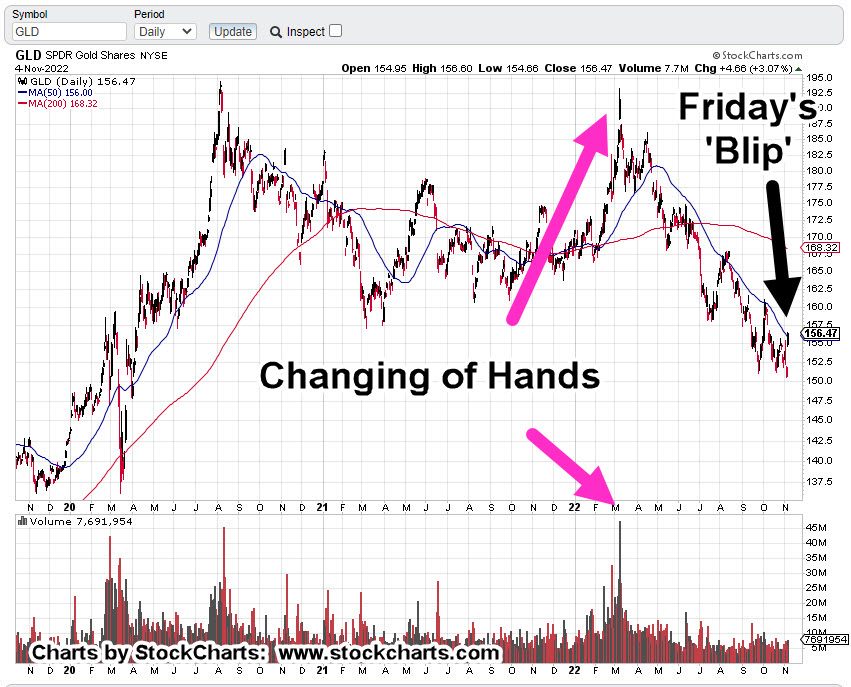
Gold GLD, Daily
Looking at the chart on the strategic, longer term, Friday’s blip is hardly noticeable. We’ve already presented how this could be a minor up-thrust (reversal) in itself.
To keep the upside intact, price action must remain and continue above current levels.
Real Estate IYR, Daily
Real estate may be working its way into an up-thrust condition. As shown, Fibonacci Day 21 from the October 13th, low is this coming Thursday, the 10th.
According to the Economic Calendar there are several potential catalysts that may push the price above resistance (temporarily).
Note: Posts on this site are for education purposes only. They provide one firm’s insight on the markets. Not investment advice. See additional disclaimer here.
No one expects the Spanish Inquisition like no one expects a collapse in silver.
From a contrarian standpoint, just because it’s not expected does not in itself, mean it’s going to happen.
However, this site’s been building a strategic premise for years, food supplies come first then precious metals (not advice, not a recommendation).
Here are links that span over two-years; successively building on the case, we’re (potentially) in a ‘Genesis 41‘ situation first more than a Wimar Republic event.
“As we continue on, it’s becoming clear that single-mindedly stockpiling inedible metal in hopes of surviving what’s here now, and what’s coming, is a major (if not potentially fatal) blunder”.
Being on the right side of the trade means by definition (nearly) everyone else, is on the wrong side.
The last report said that both silver and gold are at The Danger Point®; The location where risk is least for positioning either long or short (not advice not a recommendation).
Based on prior analysis, the expectation is for a continued decline in the precious metals.
Silver Trading ‘Vehicles’
There are many ways to work the silver market.
Several trading vehicles are silver futures (mini futures), silver ETFs, options on ETFs, leveraged bull and bear ETFs and lastly, the physical metal itself.
As of this date (9/18/22), quotes for a typical bag of ‘junk silver’ are below:
Note: Posts on this site are for education purposes only. They provide one firm’s insight on the markets. Not investment advice. See additional disclaimer here.
In the weeks and months that followed, dollar updates proposed that because we’re looking at the longer weekly timeframe, ‘any rally is likely to go farther and last longer than anyone expects.’
So now, here we are.
ZeroHedge just acknowledged the obvious, with this report.
At the time of the original dollar analysis, it was (still is) popular to talk about the ‘imminent dollar collapse’.
That (dollar) post was released in the face of overwhelming opposition to any upside.
All of which, brings us to gold and silver.
Gold’s ‘Changing of Hands’
With the passing days and weeks, it looks like the insight of gold (GLD) changing hands (here and here) is proving correct.
It’s not a popular view and it’s sure not getting any ‘clicks’.
However, as we’ll see below, there’s potential for gold and silver to head to much lower levels if not just temporarily.
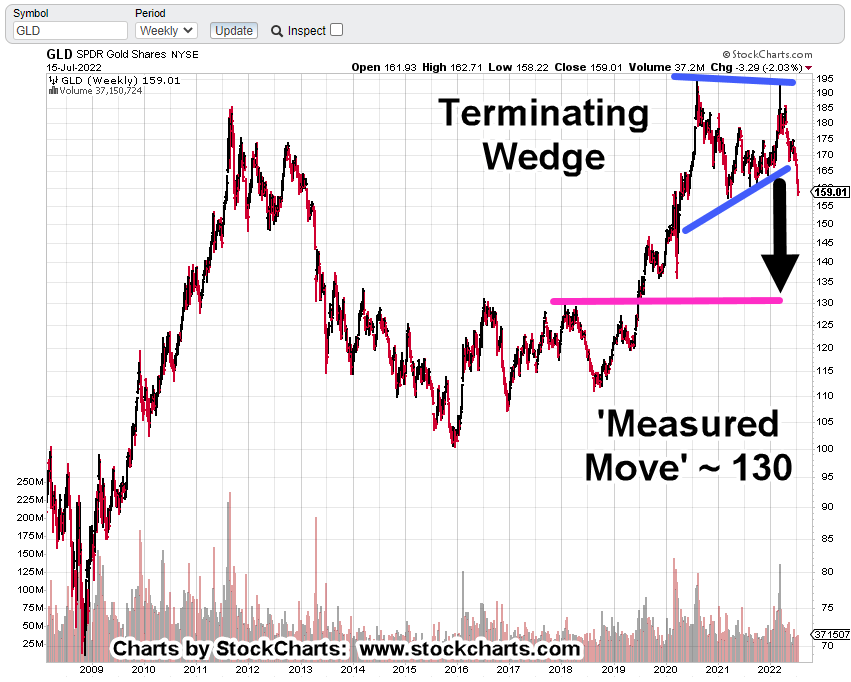
Gold (GLD), Weekly Bar
The wedge breakdown with measured move.
It’s clear, the 130 area, is an obvious support level.
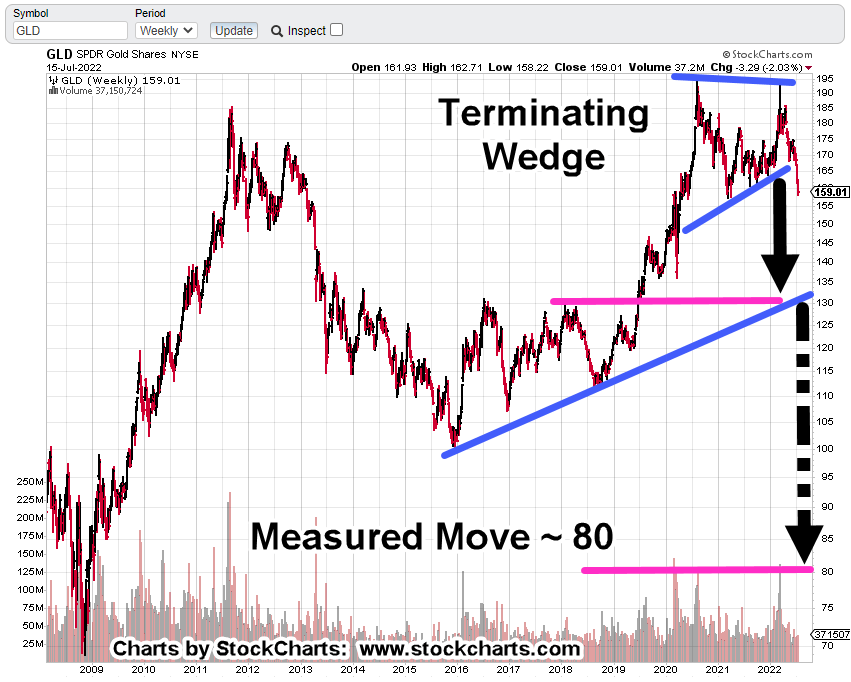
The sticky part, previously discussed here, what if somehow, gold heads lower after the measured move?
We may have something that looks like this:
If that happens, think of the confusion that would result.
From an ‘oligarch’ standpoint, it makes perfect sense.
We’ll not elaborate on that in an open (unsecured) forum.
However, let’s just say, we should keep in mind, it’s the corn and grain first, then gold and silver (not advice, not a recommendation).
Silver (SLV) projections are similar; potential targets at SLV 13 -14, then, if lower to single digits, around SLV 9.0 – 9.5
Summary
First it was, ‘The dollar’s going to collapse’, it’s ‘Imminent‘ (years ago).
Then, when that did not work out, it was the ‘Silver short-squeeze’ and we’re going to ‘Put it to the man!
Then, when that did not work out, it was ‘Gold’s going to $3,000/oz. in months, not years!’
Then, when that did not work out, it’s now ‘The Fed’s going to seize all your money.’
Ah ha! … We may have some truth but not in the way that’s obvious.
If the typical middle-class individual is maxed-out with debt, having overpaid for depreciating ‘assets’ such as cars and housing, there really isn’t much left in the banking accounts, right?
Retirement accounts … now, that’s different.
Covered many times (scroll to No. 3) on this site is just how easy it is (will be) to confiscate the IRA.
Note: Posts on this site are for education purposes only. They provide one firm’s insight on the markets. Not investment advice. See additional disclaimer here.